The System Activity section of the Admin menu displays built-in dashboards that show usage and performance information about your Looker instance. You can download, schedule, set alerts on, and drill into metrics and elements just like on any other dashboard. Data in the System Activity dashboards is updated and cached every 12 hours.
Before enabling System Activity on a customer-hosted Looker deployment with MySQL backend, verify that you have properly set up the user for the backend database. Specifically, you must perform the step to
grant all on looker_tmp.* to '<DB_username>'@'%';before enabling the System Activity feature. See the procedure on the Migrating the Looker backend database to MySQL documentation page.Because the permission to deliver content to email destinations is model specific, to send or schedule System Activity dashboards to email destinations, users must have All models selected in the Model Set specified for their role.
The System Activity dashboards connect to the underlying application database of your Looker instance. They show information about your instance, including Looks and dashboards, user information, historical query information, and performance statistics. Both the granularity and retention of System Activity data are subject to system constraints. System Activity is designed for collecting high-volume data, and aggregating it can be used to supplement your business logs.
This data can be useful for supplementing monitoring and auditing activities, but is not intended to replace your current compliance strategy.
By default, System Activity data is stored in the internal database of your Looker instance. In this configuration, Looker stores a maximum of 90 days of historical query and event data.
The text in filters run by users is accessible in System Activity and can be viewed by any user who has permission to view the System Activity model.
Take action: Modify who has view access to the System Activity model. Admins have access to this model by default. Non-admin users can be granted access to the System Activity model if they are given the
see_system_activitypermission.System Activity dashboards and Explores are restricted in the number of concurrent queries that can be run. This restriction may increase loading times for System Activity dashboards.
Chat Team Tip: Time-based data in System Activity is stored using the System time zone. See the Using time zone settings documentation page for more information.
System Activity dashboards
These are the System Activity dashboards:
- User Activity
- Content Activity
- Database Performance
- Instance Performance
- Performance Recommendations
- Errors and Broken Content
- Dashboard Diagnostics
- Query History
User Activity dashboard
The User Activity dashboard shows information about your users and their usage of your Looker instance.
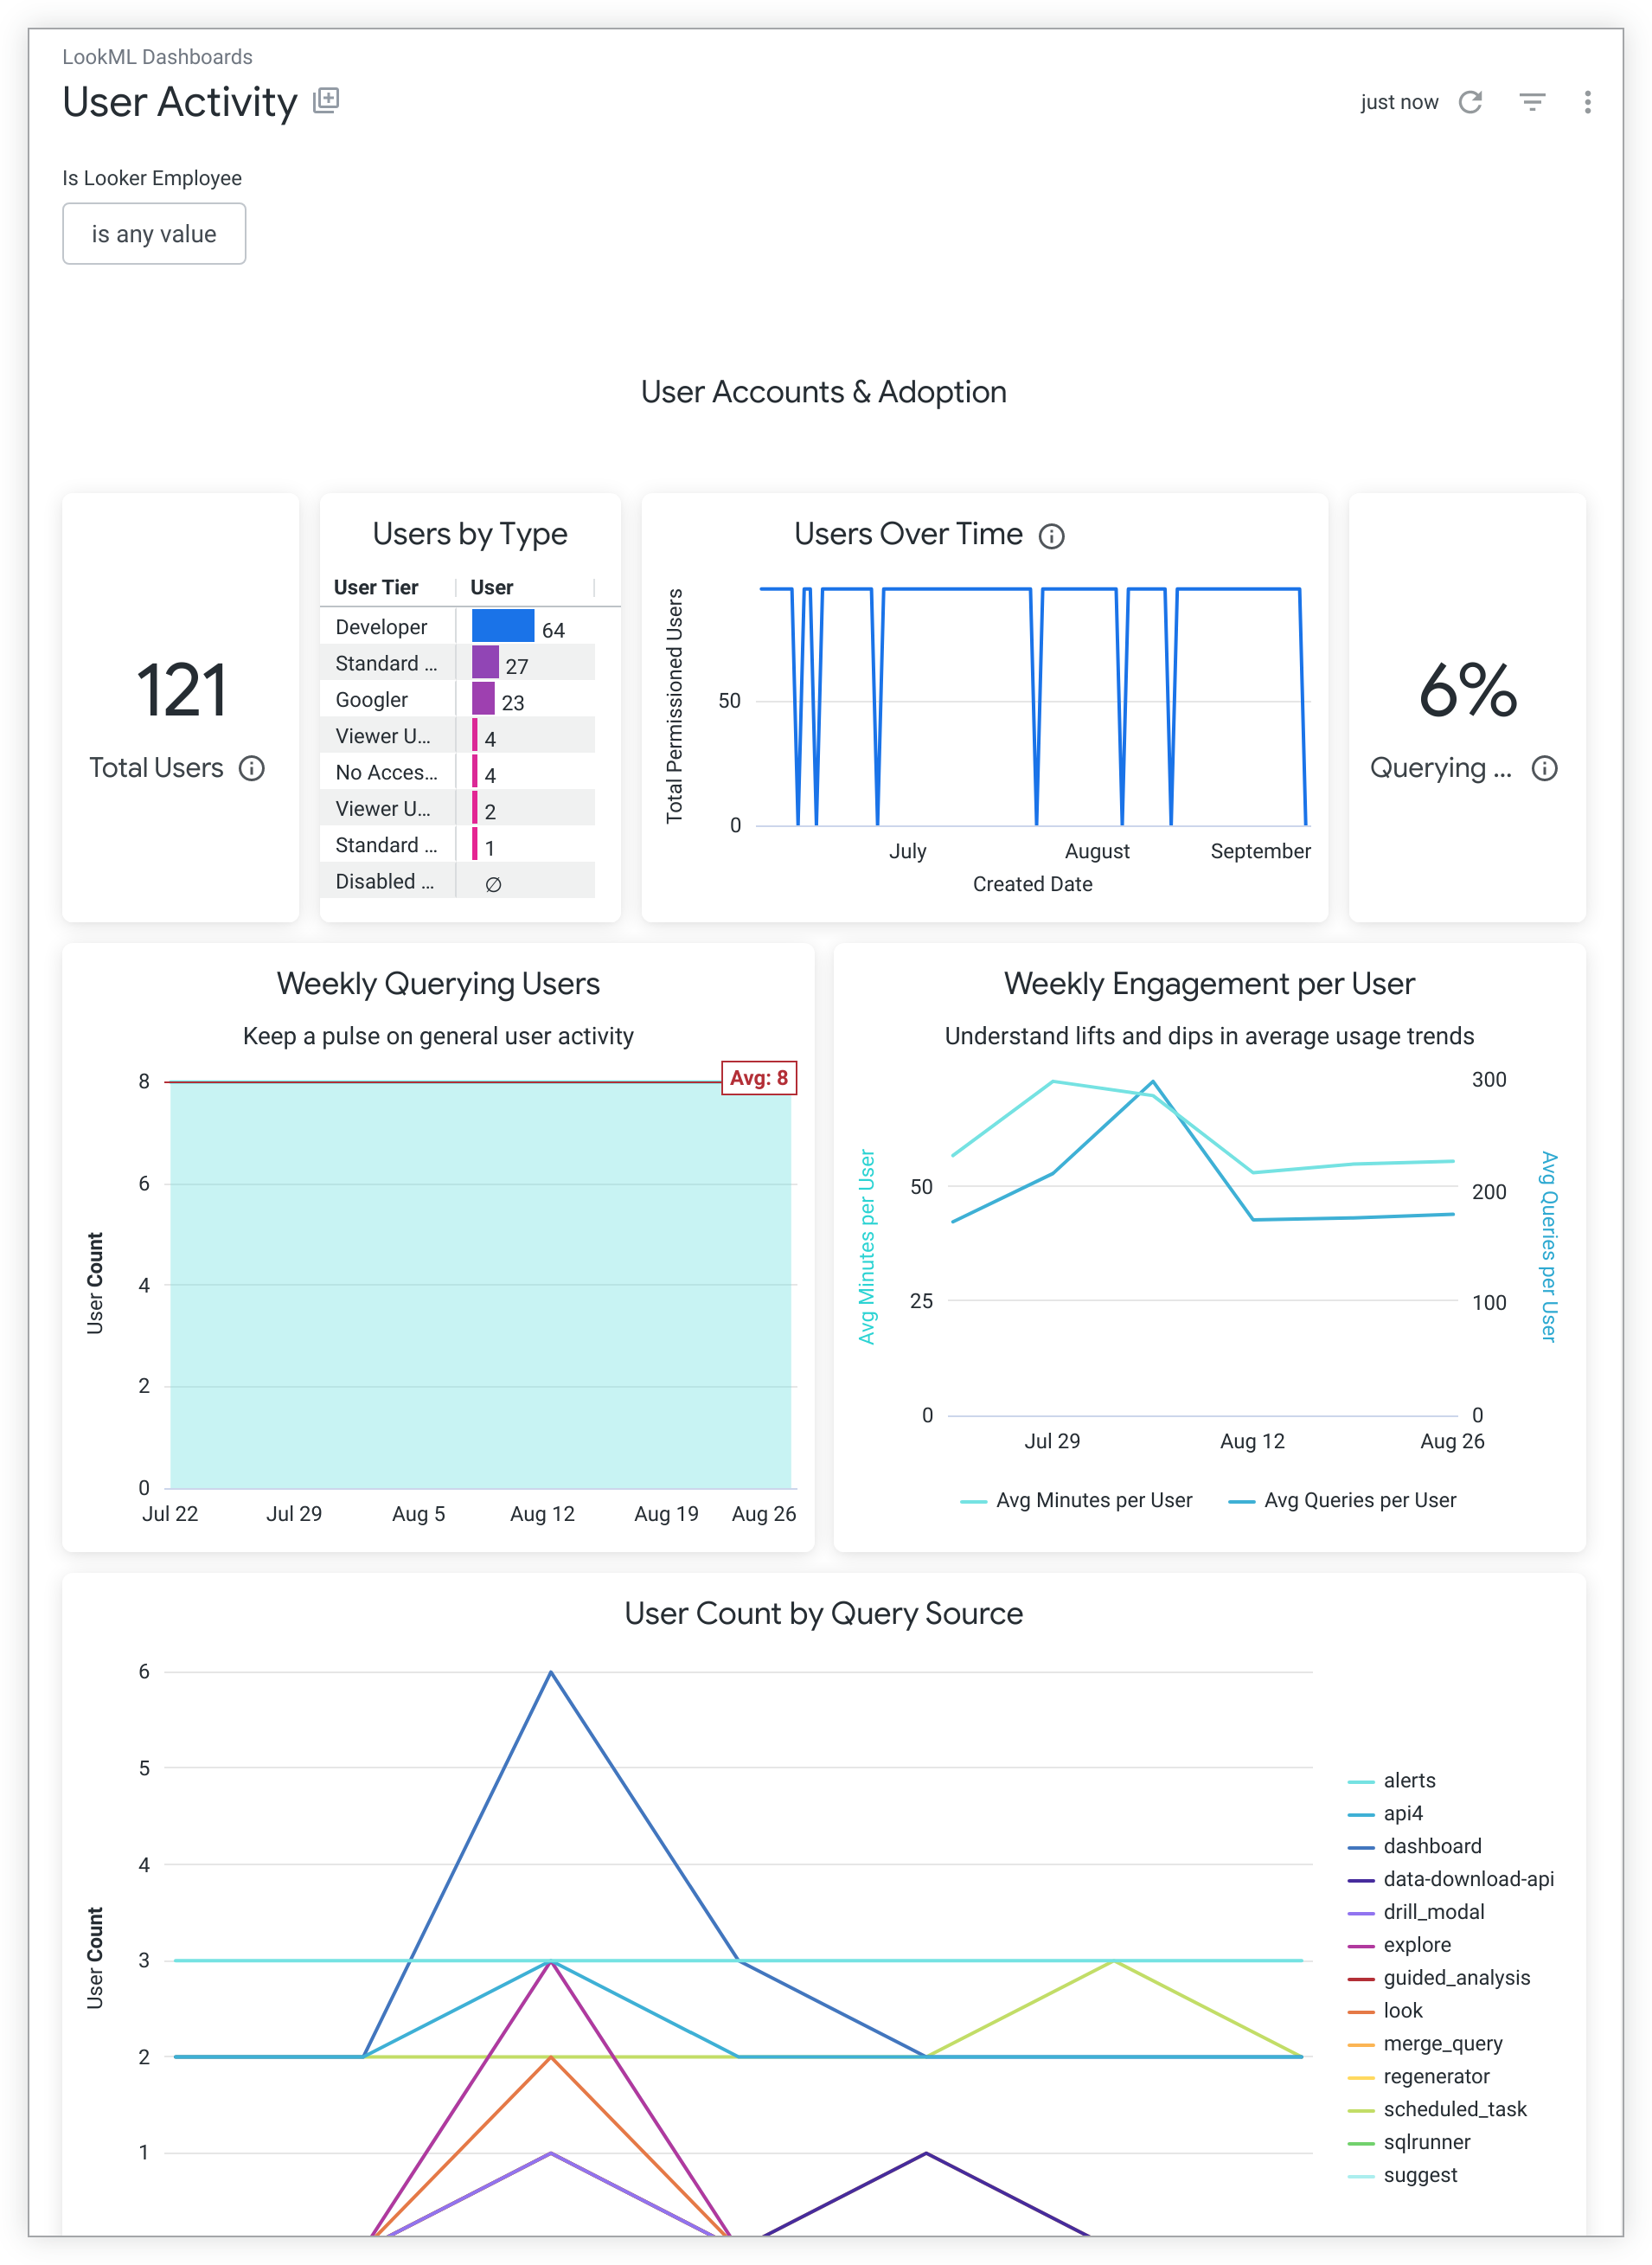
The User Activity dashboard includes tiles that show the following information:
- The total number of users on your Looker instance
The number of users of each type on your Looker instance, including:
The total number of users on your Looker instance over time
The percentage of users who have issued at least one query on your Looker instance in the last 7 days
A snapshot of user login activity over the past 90 days
The average minutes of activity and average number of queries per user each week for the previous 6 weeks
The number of users who have issued at least one query in the previous 7 days, grouped by query source
A list of users who have spent the most time using your Looker instance in the previous 7 days
A list of users who have created the most new dashboards on your Looker instance in the previous 7 days
A list of users who have triggered the most Git events from your Looker instance over all time
A list of users who have not logged in to your Looker instance in the last 90 days
A text tile with links to Looker education and training resources
Content Activity dashboard
The Content Activity dashboard shows information about which dashboards, Looks, and Explores are being viewed and scheduled on your Looker instance.
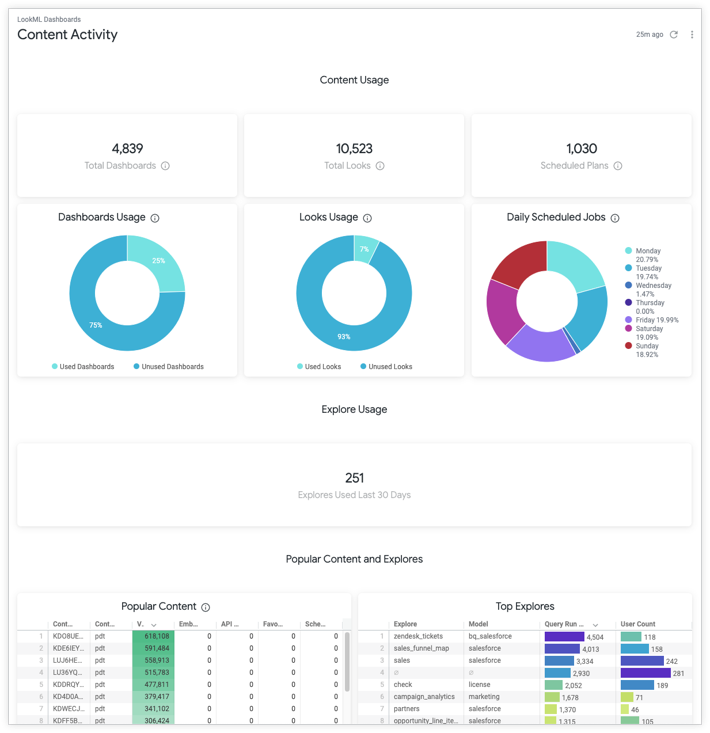
The Content Activity dashboard includes tiles that show the following data:
- The number of dashboards that have not been deleted
- The number of Looks that have not been deleted
- The number of scheduled plans
- The percentage of dashboards that were queried in the previous 30 days
- The percentage of Looks that were queried in the previous 30 days
- The number of scheduled jobs for each day in the previous 7 days
- The number of Explore queries that were issued in the previous 30 days
- A list of all dashboards and Looks that have been accessed in the last 30 days, sortable by the number of views in the Looker UI, number of times viewed in an embed, number of times viewed through the API, number of times the content was made a favorite, and number of times the content was delivered through a scheduled job
- A list of Explores created in the previous 30 days, showing the number of times the Explore was run and the number of users running the Explore
- A list of dashboards and Looks that have not been accessed in the last 30 days, showing the content's number of views in the last 90 days in the Looker UI, in an embed, and through the API; and in the last 90 days the number of times the content was made a favorite, and the number of times the content was delivered through a scheduled job
- A list of Explores created in the previous 90 days that have not been queried in the previous 30 days, showing the length of time since the Explore was last run, the number of times the Explore was run in the previous 90 days, the date the Explore was last run, and the date the Explore was first run
Database Performance dashboard
The Database Performance dashboard shows information about the performance of content and PDTs on your Looker instance. You can filter the entire dashboard by Connection Name. The dashboard includes insights into query runtimes, concurrency, and PDT builds, and lists the number of query errors and PDT build failures.
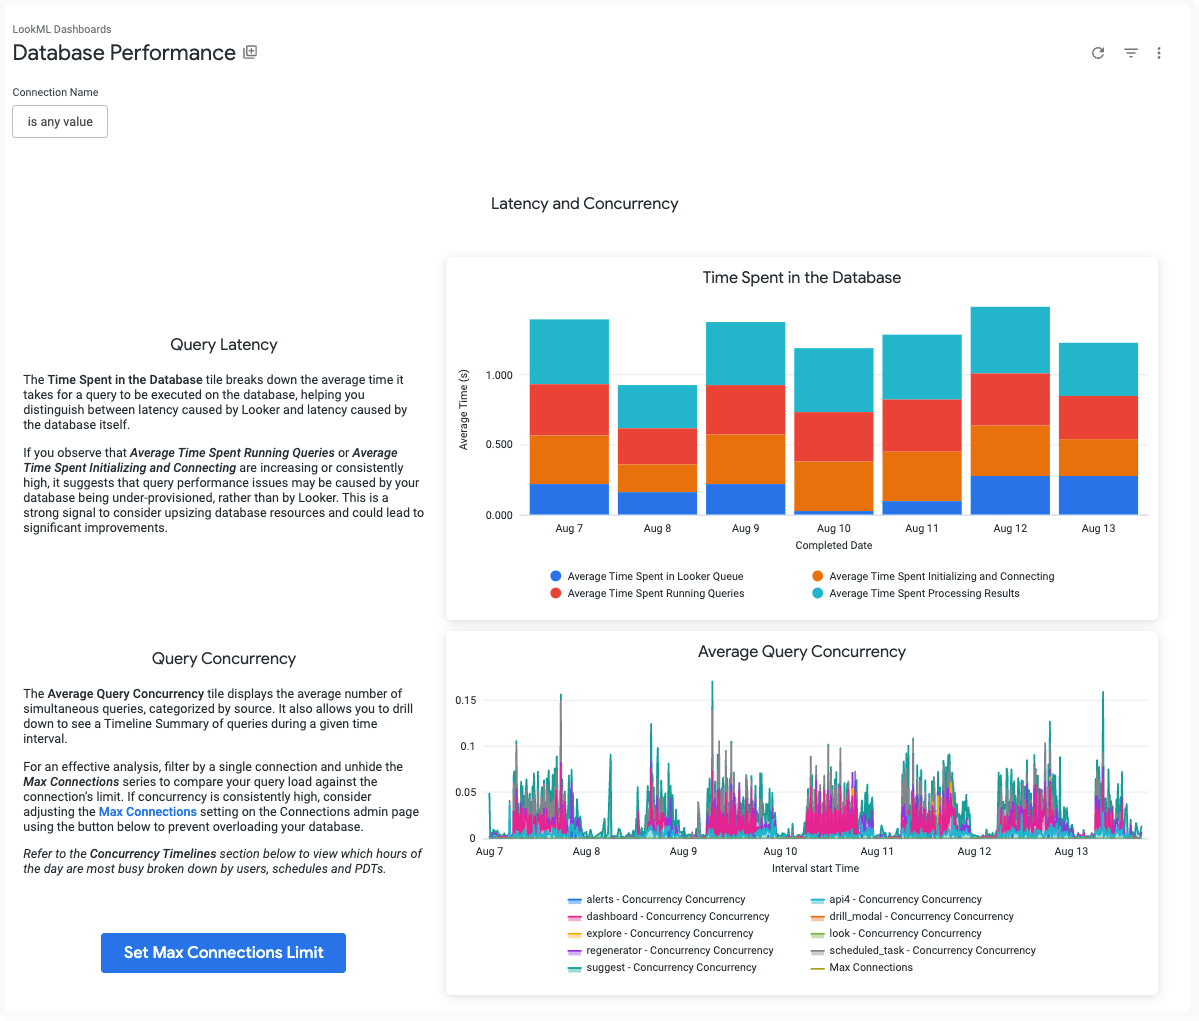
The Database Performance dashboard includes tiles that show the following data:
- Query Latency: A breakdown of the average time that it takes for a query to be executed on the database. This helps distinguish between latency caused by Looker and latency caused by the database itself. If you observe that "Average Time Spent Running Queries" or "Average Time Spent Initializing and Connecting" are consistently high, it may suggest that your database is under-provisioned and that upsizing its resources could lead to significant improvements.
- Query Concurrency: A view of the average number of simultaneous queries, categorized by source. For an effective analysis, you can filter by a single connection and unhide the Max Connections series to compare your query load against the connection's limit. If concurrency is consistently high, you can adjust the Max Connections setting on the Connections admin page to prevent overloading your database.
- The percentage of queries that were returned from the cache.
- All queries that were run over the previous 30 days, grouped by query source, with query runtimes aggregated into tiers, and with each runtime tier shown as a percentage of all queries.
- A table of the top 15 users that shows the number of queries that were run for the previous 7 days.
- A table of the top 10 query sources that shows the number of queries that were run for the previous 7 days.
- The number of queries that were run, the number of active users, and the percentage of queries that were returned from the cache for each hour of the day.
- The number of scheduled jobs and scheduled plans for each hour of the day.
- The number of PDT builds for each connection for each hour of the day.
- The average runtime for each Explore over the previous 7 days, sorted by the longest runtime.
- The average runtime for each Look over the previous 7 days, sorted by the longest runtime.
- The average runtime for each dashboard over the previous 7 days, sorted by the longest runtime.
- A list of all PDTs that were built in the previous 7 days, showing the number of trigger failures, create failures, and successful builds.
- The average build time for each PDT in the previous 7 days, sorted by the longest average build time.
Instance Performance dashboard
The Instance Performance dashboard shows information about the load and performance of the Scheduler and performance-intensive content.
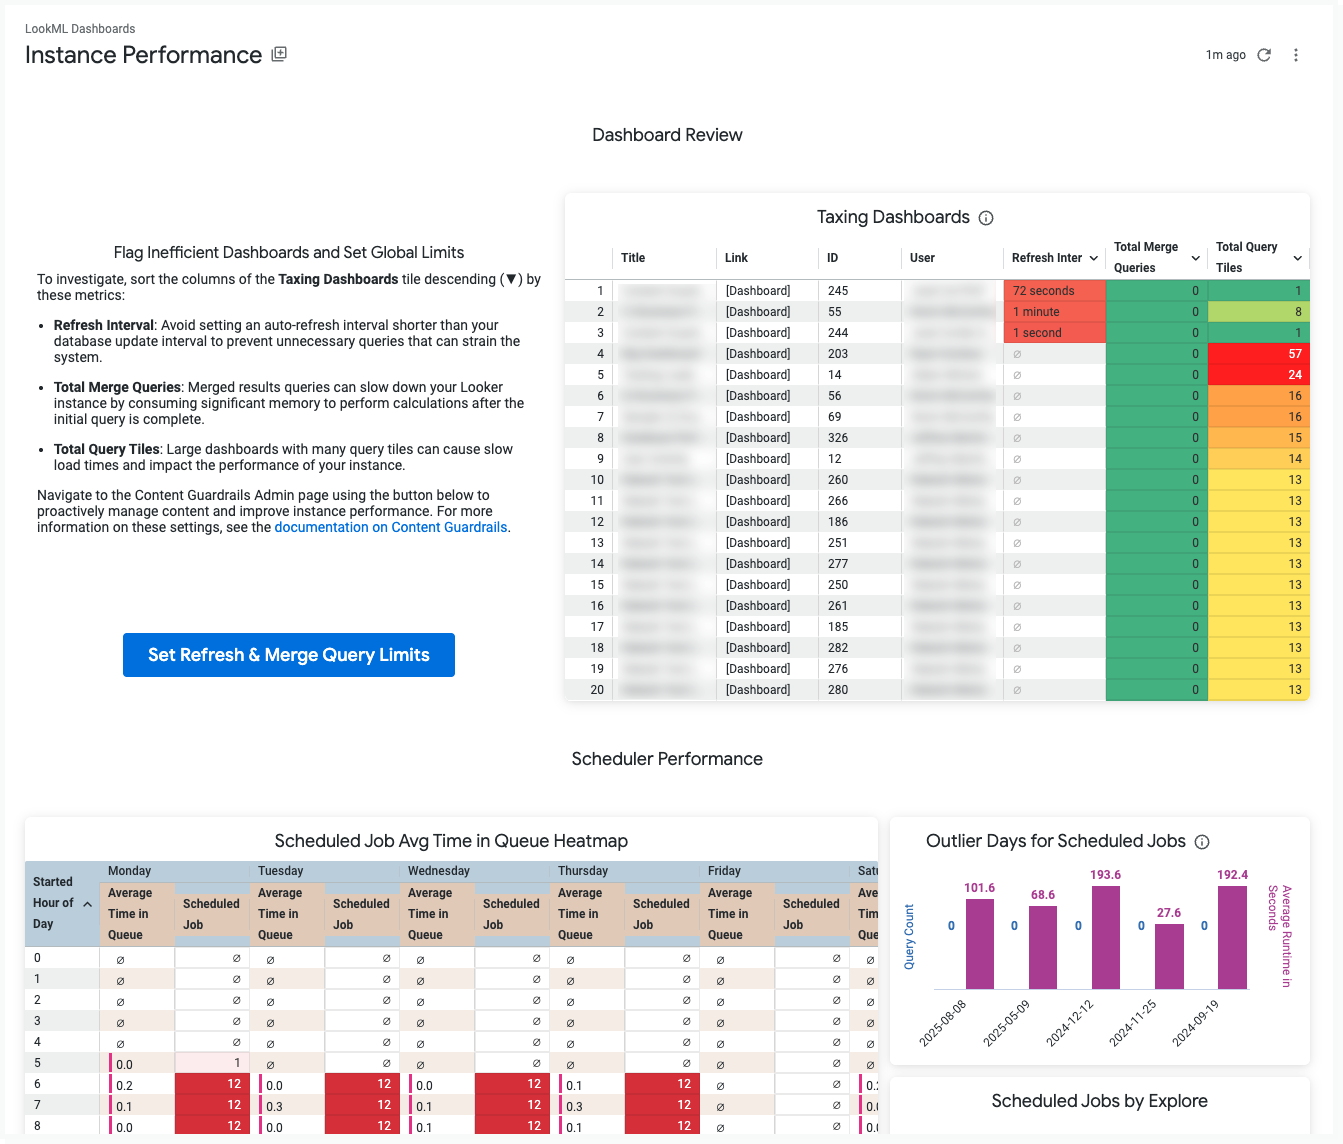
The Instance Performance dashboard includes tiles that show the following data:
- Dashboard Review: The Taxing Dashboards tile helps identify dashboards that may be straining your instance. You can sort the table to see which dashboards have the lowest refresh intervals, highest number of tiles, or a high count of merge queries. For more details on these settings, you can navigate to the Content Guardrails page to proactively manage content and improve instance performance.
- A heatmap that shows the number of scheduled jobs and their average time in the queue for each hour of each day of the week, showing you which hours or days have the heaviest impact on the Scheduler.
- The number of queries and query average runtime for days where the average runtime exceeds 1.5 times the standard deviation for all days, showing you which days have exceptionally heavy impact on the Scheduler.
- The number of scheduled jobs for each Explore.
- The most frequently scheduled content for the previous 14 days, showing the number of times that each content item was scheduled each day.
- A list of queries that were downloaded or scheduled with the All Results option.
- Optimization Resources: A set of buttons that link to Best Practices pages and documentation about optimizing your instance.
Performance Recommendations dashboard
The Performance Recommendations dashboard surfaces opportunities to improve performance on your Looker instance.
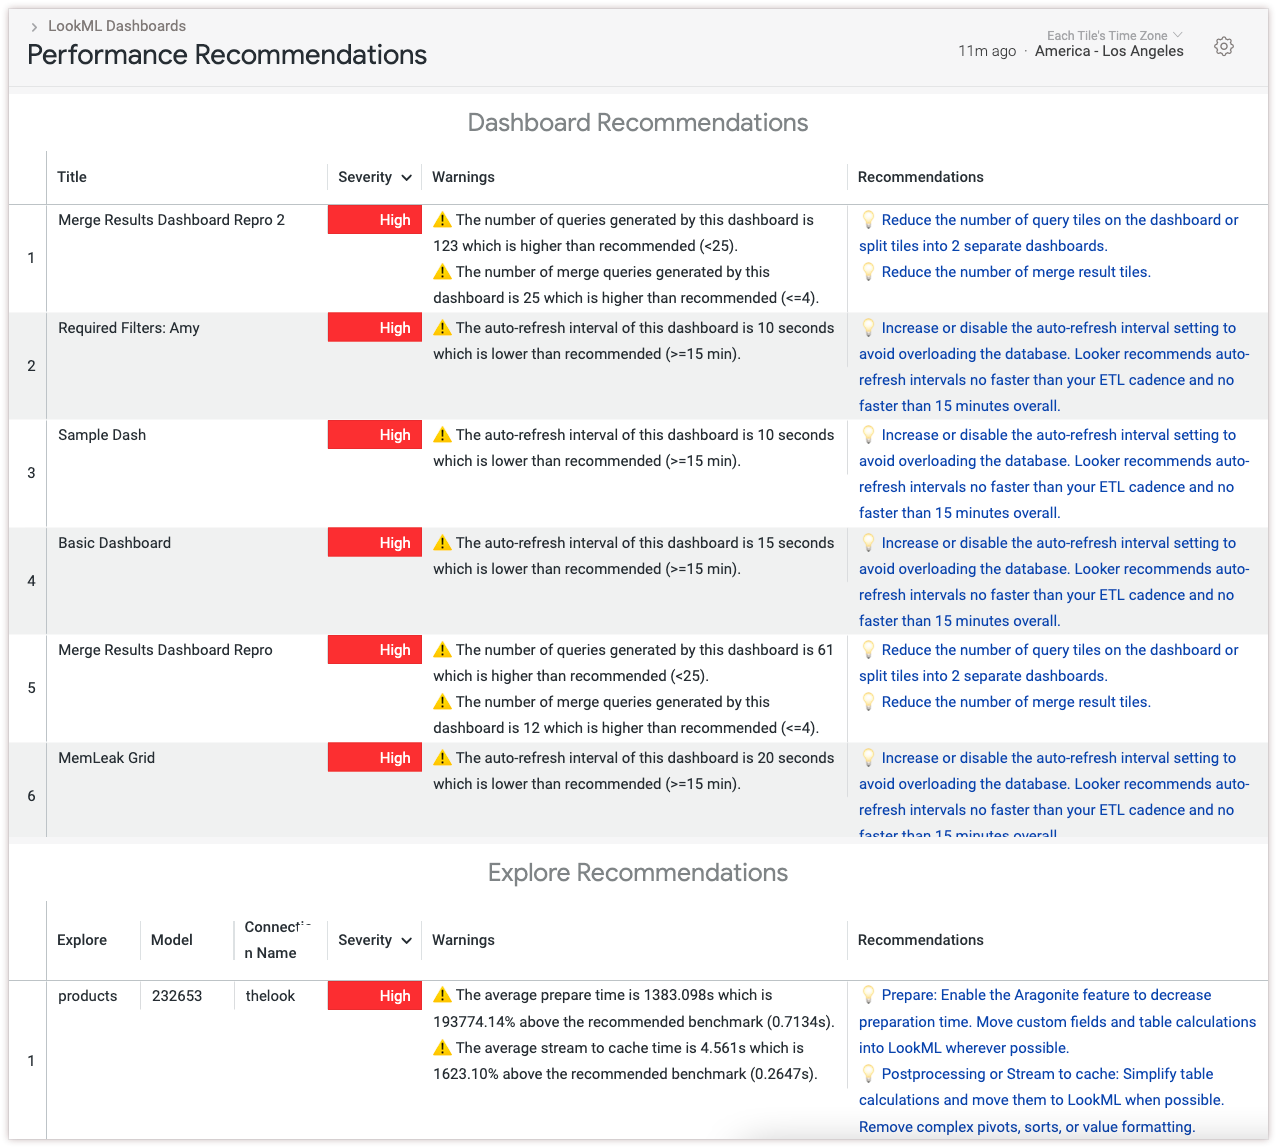
The Performance Recommendations dashboard includes tiles that show the following information:
- Dashboard Recommendations: A list of possibly non-performant dashboards and recommendations to improve performance
- Explore Recommendations: A list of possibly non-performant Explores and recommendations to improve performance
The following sections explain the tiles in more detail.
Dashboard Recommendations
The Dashboard Recommendations tile surfaces dashboards that may cause performance strains on either your Looker instance or your database. The tile provides recommendations from the Considerations when building performant Looker dashboards Best Practices page. You can apply these recommendations at the dashboard level to help improve performance. The following are possible warnings that you may see:
| Warning | Recommendation |
|---|---|
The number of queries generated by this dashboard is <X>, which is higher than recommended (<25). |
Reduce the number of query tiles or create a second dashboard. |
The number of merge queries generated by this dashboard is <X>, which is higher than recommended (<=4). |
Reduce the number of merge result tiles. |
The auto-refresh interval of this dashboard is <X>, which is lower than recommended (>=15 min). |
Increase or disable the auto-refresh interval setting to avoid overloading the database. |
Explore Recommendations
The Explore Recommendations tile surfaces Explores that may cause performance strains on either your Looker instance or your database.
The tile compares average values of each Explore's query performance metrics against benchmarks for healthy instance performance. The severity listed next to each Explore indicates how far the Explore's metrics exceed these benchmarks.
Based on which metrics exceed the benchmarks, the tile provides targeted troubleshooting strategies to help improve performance. The following are warnings and recommendations that you may see.
| Query Step | Warning | Recommendations |
|---|---|---|
Model Init: Computed |
The average model init: computed time is <X>, which is above the recommended benchmark. |
Remove unnecessary views from the include parameter of the LookML model. Ensure that LookML production code is changed infrequently, ideally at times when users aren't running many queries. |
Explore Init: From Cache |
The average explore init: from cache (marshalled cache load) time is <X>, which is above the recommended benchmark. |
Move custom fields and table calculations into LookML wherever possible. |
Explore Init: Computed |
The average explore init: computed time is <X>, which is above the recommended benchmark. |
Remove unnecessary joins from the LookML explore file. Use the fields LookML parameter to exclude unnecessary fields from the Explore. Ensure that LookML production code is changed infrequently, ideally at times when users aren't running many queries. |
Prepare |
The average prepare time is <X>, which is above the recommended benchmark. |
Enable the New LookML Runtime feature to decrease preparation time. Move custom fields and table calculations into LookML wherever possible. |
Acquire Connection |
The average connection acquisition time is <X>, which is above the recommended benchmark. |
Configure the max connection limit in the connection settings panel. Set a limit no less than the max number of queries needed to run concurrently at peak traffic. |
Execute Main Query |
The average main query execution time is <X>, which is above the recommended benchmark. |
Avoid complex SQL logic such as window functions, CTEs, join conditions on date fields, or large join chains. Put complex SQL logic into persistent derived tables (PDTs) to reduce query times. Use aggregate awareness when possible. |
Postprocessing |
The average postprocessing time is <X>, which is above the recommended benchmark. |
Simplify table calculations and move them to LookML when possible. Remove complex pivots, sorts, or value formatting. |
Stream to Cache |
The average stream to cache time is <X>, which is above the recommended benchmark. |
Simplify table calculations and move them to LookML when possible. Remove complex pivots, sorts, or value formatting. |
Errors and Broken Content dashboard
The Errors and Broken Content dashboard shows the dashboards, Looks, schedules, and PDTs that produce query errors, along with the number of errors for each query source.
This dashboard displays only errors that occur at query runtime. For example, if you remove a LookML field from a view, any Looks and dashboards that use that field will display warnings, but the Errors and Broken Content dashboard will not display these warnings. Use the Content Validator to check for LookML reference issues in your Looks and dashboards.
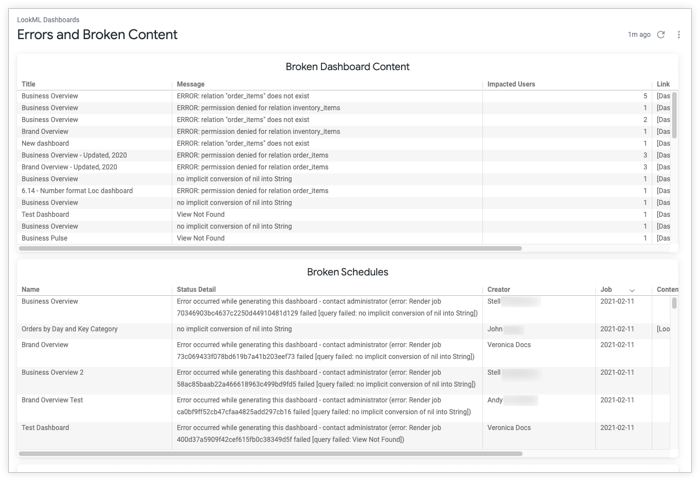
The Errors and Broken Content dashboard includes tiles that show the following data:
- A list of dashboards that are producing errors, including the errors given, the issuer of each dashboard query, and the number of users who have run queries using each dashboard
- A list of scheduled jobs that are producing errors, including the errors given and the creator of each schedule
- A list of Looks that are producing errors, including the errors given and the issuer of each Look query
- A list of PDTs that are producing errors, including the PDT actions that created the error log entry, any data related to the PDT action, number of times the PDT produced a "create cancelled error" action, and the number of times the PDT produced a "trigger value error"
- The number of errors from each query source for the previous 10 days
Dashboard Diagnostics
The Dashboard Diagnostics dashboard surfaces opportunities to improve performance on an individual dashboard.
You can access the Dashboard Diagnostics dashboard from any dashboard by clicking the Dashboard actions three-dot menu and selecting Dashboard Performance Summary.

Some tiles, such as Query Runtime by Hour and Query Runtime by Tile, break down the query runtime by query stage. The query stages are as follows:
- In Queue: This is the amount of time, in seconds, that the query spent in the Looker queue. Looker queues queries when the connection's Max connections per node limit has been reached, or when the per-user limit (which has a default value of 15 concurrent queries) has been reached.
- Query Initialization: This is the amount of time, in seconds, that Looker spent building the query from the source LookML, and connecting to the database. If this stage is taking a long time, this may indicate that LookML model complexity or database connectivity is impacting the query runtime.
- Running Query: This is the amount of time, in seconds, that Looker spent waiting for query results while the query runs on the database. This includes the main query and any needed additional queries including calculating totals and building PDTs. This is the most common cause of long dashboard runtime, and can be improved by optimizing query performance.
- Processing Results: This is the time, in seconds, that Looker spent formatting the results, calculating table calculations, and caching the result set.
The Dashboard Diagnostics dashboard includes tiles that show the following information:
- The title of the dashboard
- The numbers of users who have run this dashboard in the selected timeframe
- The number of times this dashboard has been run in the selected timeframe
- The percentage of queries from this dashboard that were run from cache
- If the cache percentage is low, use caching strategies to reduce database load.
- The average query time per tile
- The users who have most frequently run this dashboard
- The average query time per hour
- If there are spikes in this tile, ensure there are not several scheduled plans being sent at the same time.
- The number of tiles with at least one merged results query
- The number of merged results queries in the dashboard
- Dashboard Recommendations: A list of possible performance issues and recommendations to improve performance for this dashboard
Query History
The Query History dashboard is available from the Explore Performance panel, and shows current and historical performance data for both the query and the Explore that was used to create the query.
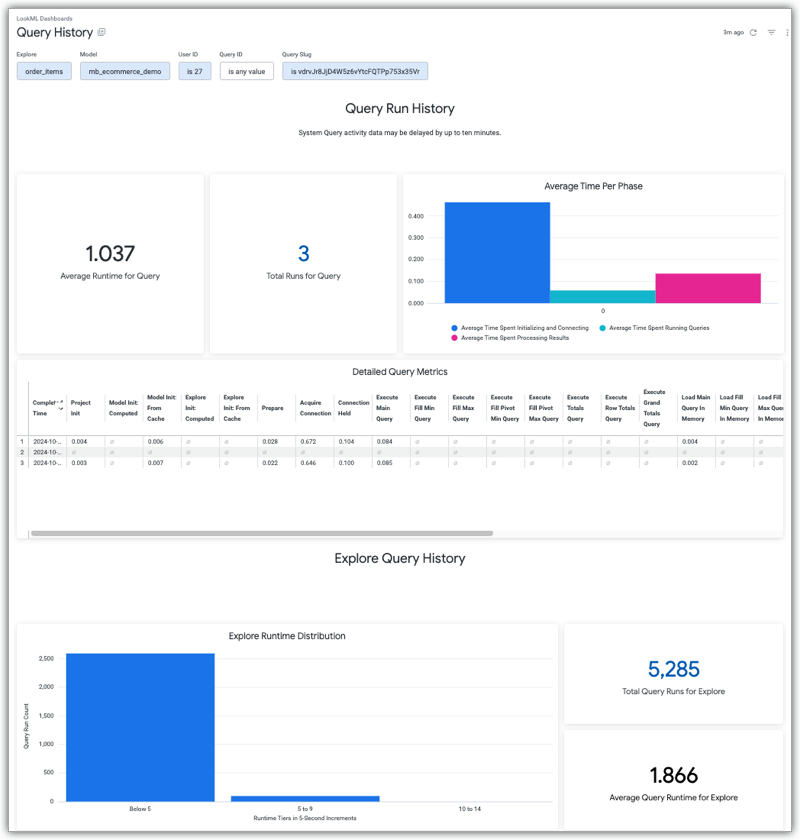
The Query History dashboard includes tiles that show the following data:
- The average time it took for the query to run and return results
- The total number of times that the query was run
- The average time that the query spent in each of the three query phases
- Detailed metrics about the query
- The number of queries that were run from the Explore that was used to create the initial query, broken down in five-second runtime increments
- The total number of queries run that are based on the Explore that was used to create the initial query
- The average time it took for queries based on the Explore that was used to create the initial query to run and return results