Connected Sheets for Looker lets users interactively explore data from LookML models through the familiar Google Sheets spreadsheet interface. Sheets users will have access to governed data from 50+ databases supported by Looker. Exploration is intuitive since Connected Sheets presents an organized view of the model with views, fields, and measures just as they were defined in Looker. Looker data through Connected Sheets can be used in standard Sheets constructs, like pivot tables, charts, and formulas, allowing for flexibility of analysis through familiar constructs.
Enabling Connected Sheets
To use Connected Sheets:
- In Looker (original), your Looker admin must enable either the All Looker BI Connectors or the Connected Sheets toggle on the BI Connectors panel in the Platform section of Looker's Admin menu. In Looker (Google Cloud core), these options are enabled by default.
- Your Looker instance must be Looker-hosted.
- Your Looker instance must be running Looker 22.20 or later if your instance is hosted on Google Cloud. If your Looker instance is not hosted on Google Cloud, your instance must be running Looker 23.4 or later.
- Each user who wants to connect to your Looker instance from Google Sheets must use the same email address in their Looker user account as they use for their Google Workspace account. If their Google Workspace and Looker account email addresses are different, they will receive an error when they try to connect to Looker from Sheets.
- Access to services that are not controlled individually must be turned on in your Google Workspace admin console. This is typically enabled by default. For more information, see the Manage access to services that aren't controlled individually help article.
Connecting to a Look from Google Sheets
In Looker, a Look is a single query that was previously saved. You can add the results of a Look to a sheet and then interact with the Look output in Sheets.
From the Google Sheets Data menu, select Data Connectors, and then select Connect to Looker.
In the Connect to Looker dialog, enter the name of your Looker instance, or select the name of an instance to which you recently connected and select Connect to Look.
In the following dialog, select the Look that you want to add to Google Sheets, and then select Connect. You can use the Search for a Look field to search for a saved Look by name or by Look ID, or you can filter the list of Looks that are displayed in the dialog by entering a substring that is contained in the Look name.
In the Connect to a Look dialog, select whether to create a new sheet for the Look output or to add the Look output to an existing sheet, and Select Create.
When Sheets connects to your Looker instance, Sheets will add the output of your selected Look.
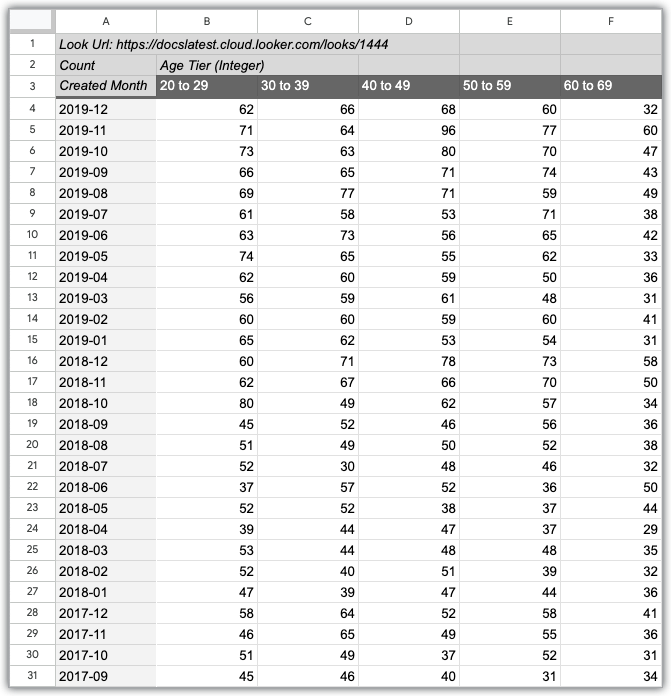
Looks are not editable in Sheets, but you can refresh Look data any time by clicking Refresh. You can click the Look URL to open the Look in Looker. You can also view the Look name, ID, and URL in the Look sidebar.
Connecting to Looker Explore from Google Sheets
An Explore is the starting point for queries. An Explore shows a specified set of fields from its associated view file, and these fields can be selected to construct a query in a sheet.
From the Google Sheets Data menu, select Data Connectors, and then select Connect to Looker.
In the Connect to Looker dialog, enter the name of your Looker instance, or select the name of an instance to which you recently connected, and select Connect to Explore.
In the following dialogs, select the Looker model and Explore that you want to use for your query, and select Connect.
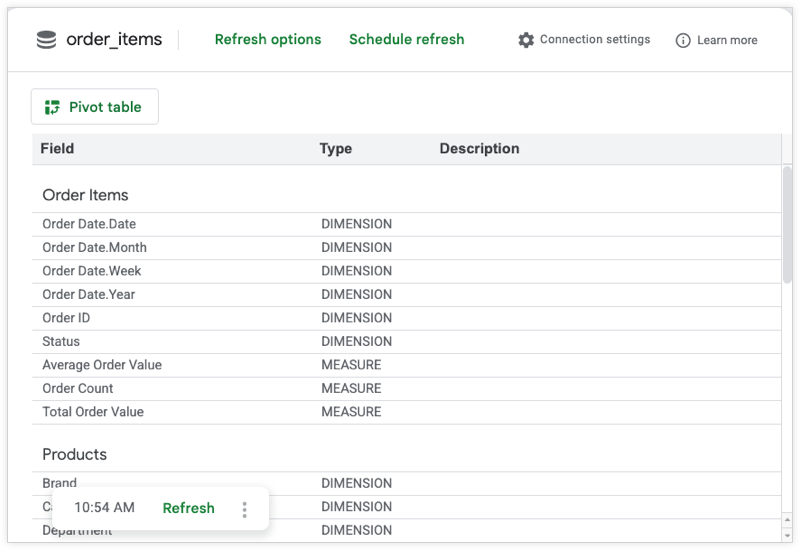
When Sheets connects to your Looker instance, Sheets will open a new sheet that shows the structure of the selected Explore, including views, dimensions, measures, and any field descriptions that was added by your Looker developer.
Building Looker queries using Google Sheets
Looker queries are built using a Sheets pivot table. To add Looker data to your sheet:
From the sheet that shows your Explore, select Pivot Table.
Select whether to insert a new pivot table in either a new sheet or an existing sheet, and select Create.
A new, empty pivot table is created, and the Pivot table editor window opens. You can add rows, columns, values, and filters to build your query based on the dimensions and measures in your Looker Explore.
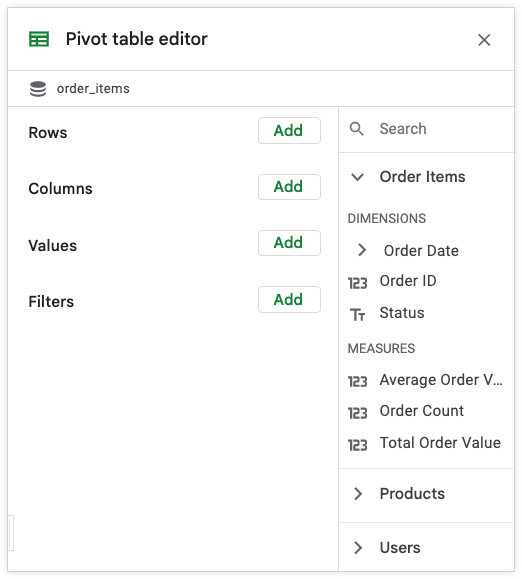
The rows, columns, values, and filters in the pivot editor are equivalent to your Looker dimensions and measures in the following ways:
- Rows are equivalent to Looker dimensions.
- Columns are equivalent to Looker pivoted dimensions.
- Values are equivalent to Looker measures. You can create a custom measure by selecting a Looker dimension and a Sheets Summarize by function.
- Filters are equivalent to Looker filters.
The pivot editor also displays a list of the views that are part of your Explore, which you can select to display the dimensions and measures that are included in that view.
Select Add to add a row, column, value, or filter. Connected Sheets displays a list of the views that are available in your Explore. Select a view name to show the list of the dimensions and measures in the view, and then select the field that supplies the data for your row, column, value, or filter.
Once you've added your Looker fields and filters to build your query, select Apply. This will populate your sheet with data from your Looker instance.
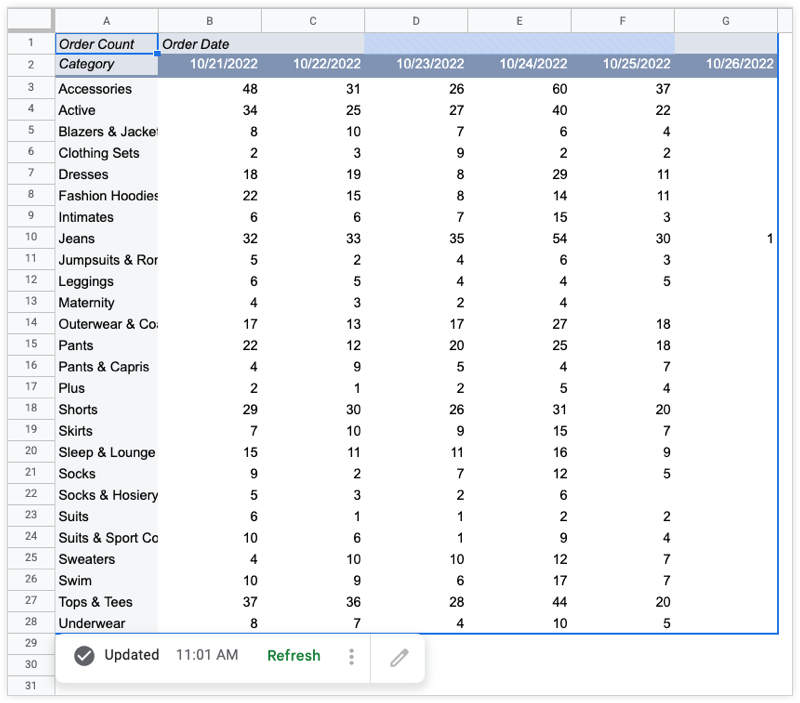
Once you have added your Looker data to a pivot table, you can use Google Sheets to format your data or build new sheets formulas based on your Looker data.
Filtering options
Since the initial release of Connected Sheets for Looker, new filtering options have been added.
Filter by value
It's possible to filter Looker dimensions in Connected Sheets for Looker pivot tables by seeing a list of values and selecting and deselecting the values of interest. Previously, you needed to type in the filter values manually when using filtering by a condition.
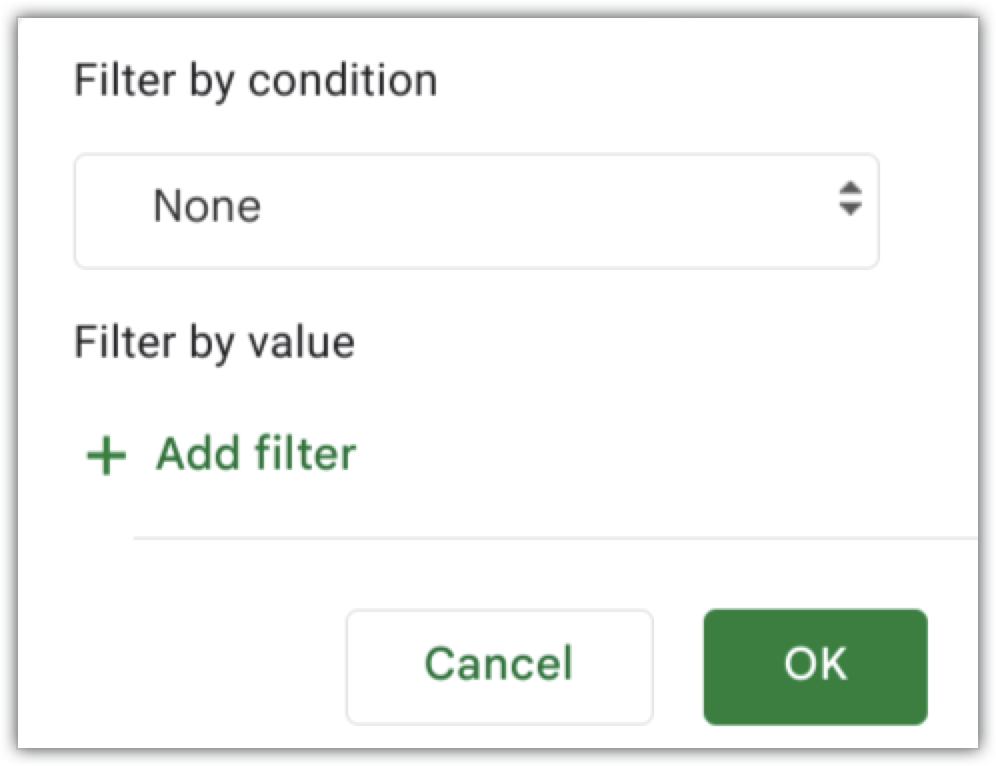
To use this feature, add a field to the Filters section of the pivot table and click the Status drop-down to open the filter options. Then, click Add Filter:
A sidebar will open, and Sheets will fetch the 500 most frequently occurring values from Looker.
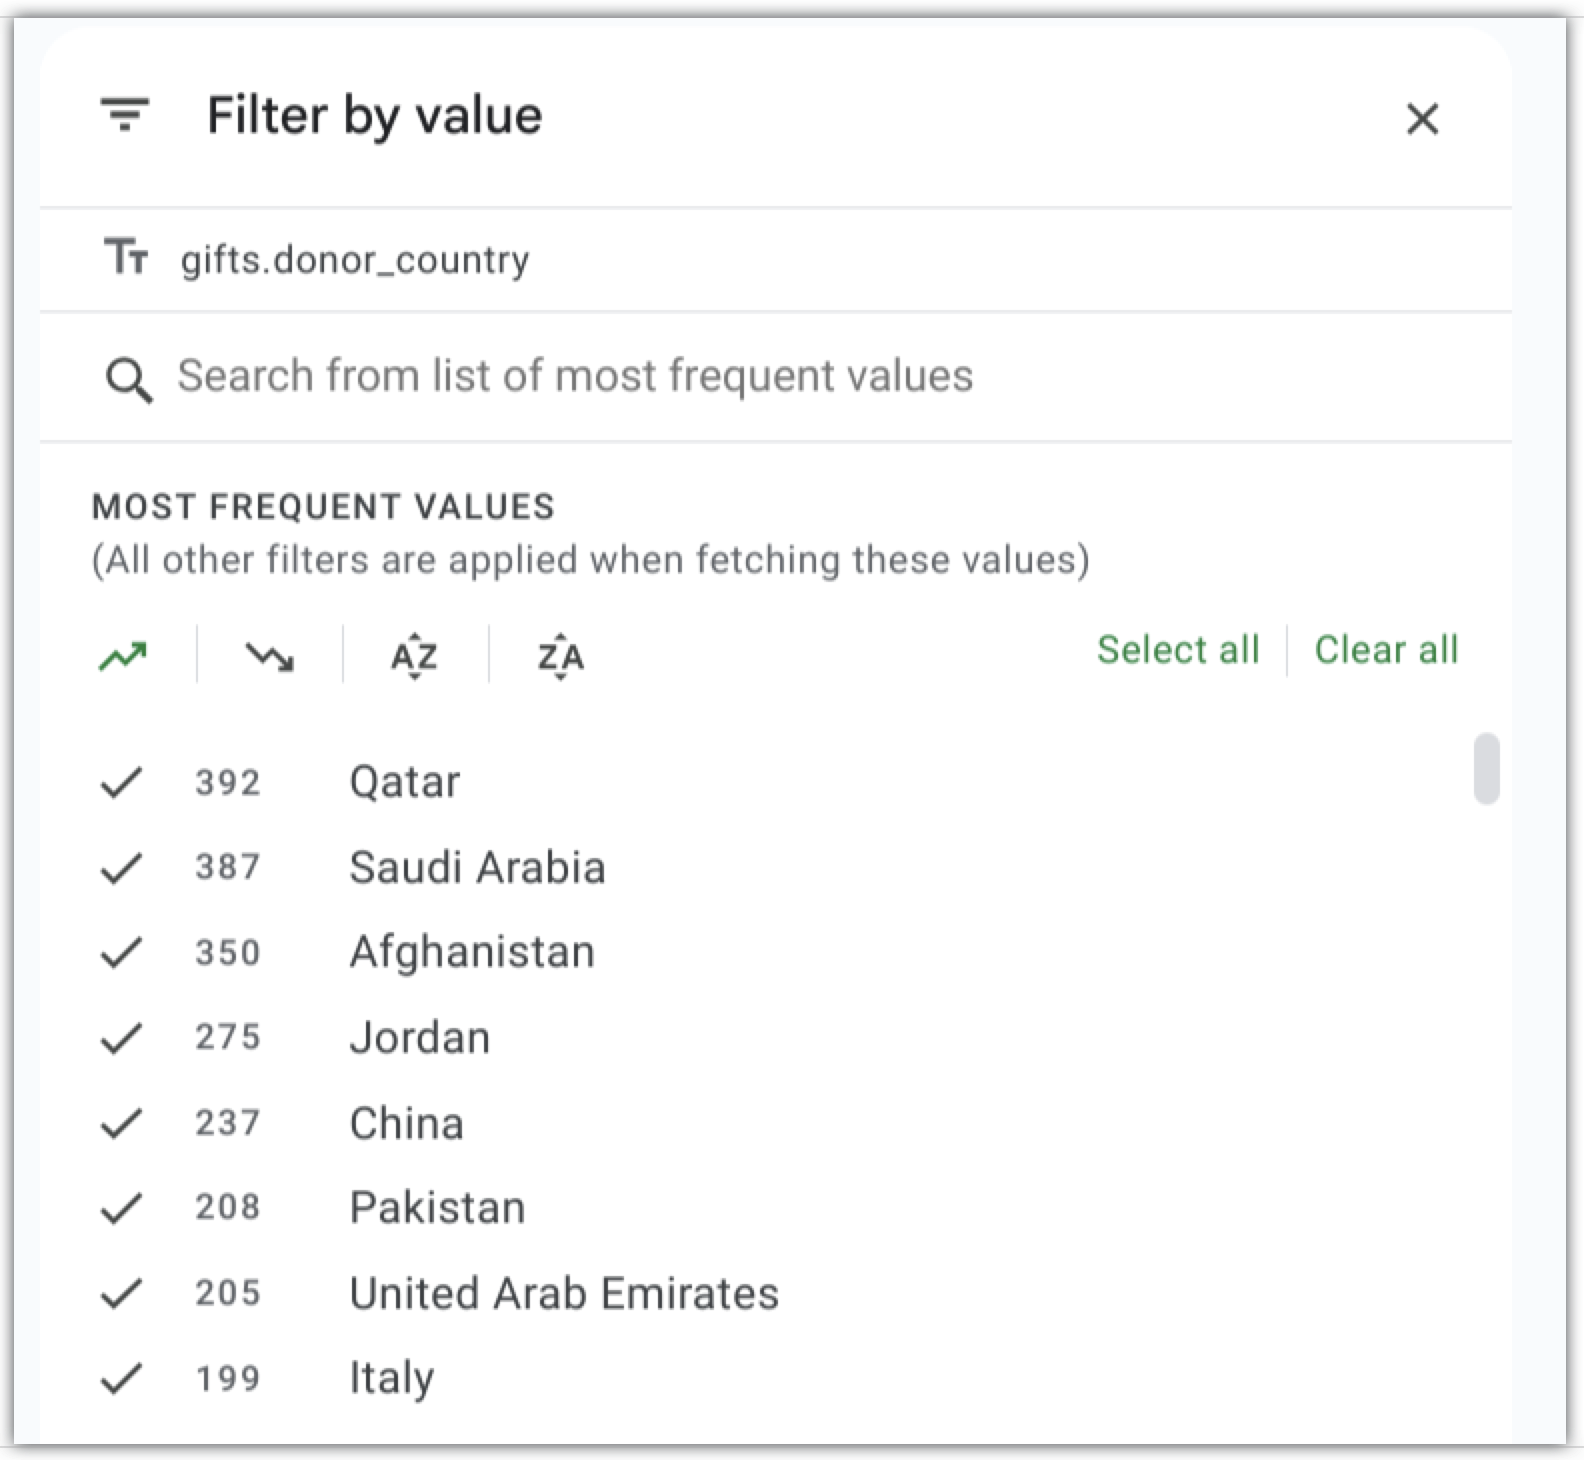
You can then search among the items, choose to select or clear all, or sort the items by frequency or alphabetically. When you click OK at the bottom, Sheets will store your choices. You can then click Apply to refresh the pivot table as usual, with your new filter applied.
Filters using Looker filter expressions
You can apply relative date filters, as well as many other advanced filters, in Connected Sheets by using Looker filter expressions. For example, you can apply filters like "is in the past 30 minutes" or "is in the past 10 days" in Connected Sheets.
To use Looker filter expressions:
Add a field to the filters section of the pivot table.
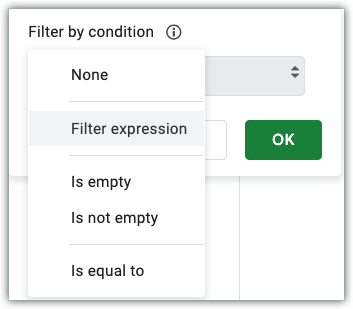
Click the Status drop-down to display filter options, and select Filter expression.
Enter any Looker filter expression into the Value field.
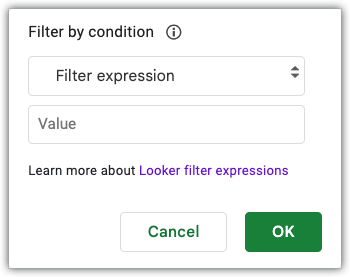
For example, to filter for the last 7 days, you can write either "7 days" or "last 7 days".
Click OK.
In addition to relative date filtering, other examples of filtering that are now possible include:
- A string that does not start with:
-FOO% - An inclusive and exclusive numeric range:
(12, 20]
To view all available filter expressions, see the Looker filter expressions documentation page.
Using Looker parameters and filter-only fields
You can now use parameters and filter-only fields in Connected Sheets.
Filter-only fields and parameters will appear in the FILTER-ONLY FIELDS section of the field picker in Sheets, much like they do in Looker. To use them, follow these steps:
- Add or drag the selected parameters and filter-only fields to the Filters section, just as you would to filter on a dimension or measure.
- For parameters with allowed values, these value will be displayed in a drop-down in the Filter by condition dialog.
- For filter-only fields, you can use the regular Filter by condition dialog. If the field has suggestions defined in the Looker model, you can use the filter by value feature as well.
Refreshing your data in Google Sheets
The data in your pivot table is static but can be refreshed any time. Refreshing your data will cause Looker to query your database and update your pivot table with your most current data.
Both your pivot table and the sheet showing your Look or Explore display the time they were most recently refreshed.
Select Refresh to update the data in your pivot table.
Scheduling regular refresh times
To schedule automated updates of your data, either select the three-dot menu in your pivot table and then select Refresh Options, or select Refresh Options in your Explore sheet. Looker displays the Scheduled Refresh dialog.
Editing your pivot table settings
To modify which rows, columns, values, or filters are included in your pivot table, select the pencil icon next to the three-dot menu to open the pivot table editor panel.
Monitoring Connected Sheets
A Looker admin can view Connected Sheets usage using the Query API Client Properties group of fields in the System Activity History Explore. An entry is created in the History Explore every time a new query is run.
In the Query API Client Properties group of fields, there are three new fields for Connected Sheets:
- API Client Name — This field will always show
Connected Sheetsto identify Connected Sheets entries. - Connected Sheets Spreadsheet ID — This field shows the sheet ID, which is included in the Google Sheets URL for that sheet.
- Connected Sheets Trigger — This field shows whether the query was triggered by a user selecting the Refresh button in Sheets or by a scheduled refresh.
Following is an example of a System Activity URL that shows Connected Sheets usage. Replace <instance_name.looker.com> with your instance URL.
https://<instance_name.looker.com>/explore/system__activity/history?fields=query_api_client_context.name,query_api_client_context.cs_spreadsheet_id,query_api_client_context.cs_trigger,user.name,history.created_date,history.created_time_of_day&f[query_api_client_context.cs_spreadsheet_id]=-NULL&sorts=history.created_time_of_day+desc&limit=5000
Connected Sheets API Support
API support for Connected Sheets for Looker is accessible through both AppsScript and Google Sheets APIs.
Some of the things you can do programmatically with API support include the following:
- Automated data refresh: You can schedule regular updates to your Looker-powered spreadsheets to ensure that you're using the latest information.
- Custom workflows: You can build complex processes that incorporate Looker data into your existing Google Sheets workflows.
- Integration with other applications: You can connect Looker data to external tools and services using AppsScript or Google Sheets APIs.
To specify Looker as a data source with the Google Sheets API, use the looker object with the DataSourceSpec REST resource.
Things to know
- Case-sensitivity for the data shown in the pivot table is determined by the case-sensitivity setting for the model. Filters on the pivot table, however, force case-insensitivity in situations where the filter is case-insensitive for native Sheets data.
- Anyone who has Viewer access to the sheet will be able to view the cached data in a pivot table.
- In addition to Editor access to the sheet, any users who need to edit or refresh the pivot table will need the correct permissions in Looker to access the data model. This includes access to the model on which the pivot table is based, permissions to view the data, and proper access to the data through any access filters or access grants.
- If the user is authenticating with OAuth to a BigQuery database, they may need permissions to be granted on the underlying database.
Connected Sheets row and data limits
Queries that are created with Connected Sheets have a maximum limit of 100,000 rows. If the result of the query contains more rows, Sheets will show an error to the user. If the user does not have the download_without_limit permission, the result will be truncated to a maximum of 5,000 rows regardless of the Sheets limit.
In addition, Connected Sheets queries are subject to a data size limit. Queries that return too much data also result in an error.
If you see either of these errors, consider adding filters or using fewer and/or less granular dimensions in your query.
Troubleshooting Connected Sheets
You may encounter some issues when you attempt to connect to Looker from Google Sheets. This section describes these issues and how to correct them.
Error: There was an error connecting to your Looker instance. Please try again. If the issue persists, please send feedback.
This error can occur for multiple reasons:
- The Looker instance name was entered incorrectly. In this case, verify your Looker instance name and try to connect again.
- Sheets cannot connect to the Looker API. This can occur if your Looker instance is not using the default API Host URL. To correct this, leave the API Host URL field in the API admin panel blank.
Error: The Looker instance is not configured to use this feature. Please contact your Looker admin to ensure it is eligible.
This error can occur for multiple reasons:
- You are trying to connect to a newly created Looker instance. It may take up to 24 hours for a new Looker instance to be available in Connected Sheets.
- You are trying to connect to a Looker instance that is not Looker-hosted. Connect to a different Looker instance that is Looker-hosted.
No models appear after connecting to a Looker instance
This indicates that you don't have the required permissions to view models on your instance.
A Looker user with the Viewer role does not have sufficient permissions to create connections in Sheets, just as they don't have sufficient permissions to use the Explore UI in Looker. If the user wants to use Connected Sheets for Looker, they need to have the explore permission. The Admin, Developer, and User roles include the explore permission. A Looker admin can grant the user the explore permission, and that should enable the user to see models on the instance.
Error: Your linked Looker account email address is different than your Google Account email address.
This indicates that your Looker account email address does not match the email address used with your Google Account. Ensure that you are signed in to a Google Account that has an email address that matches your Looker account. Alternatively, a Looker admin can create a new Looker user account that uses your current Google email address.
Error: Bad Request: no enable client found.
This error indicates that the Connected Sheets connector has not been enabled. A Looker admin must enable either the All Looker BI Connectors or the Connected Sheets toggle on the BI Connectors panel in the Platform section of Looker's Admin menu.
Error: 403 Forbidden
If your Looker instance has an IP allowlist configured, the allowlist can prevent Sheets from connecting to the Looker API. To determine if the allowlist is the cause, try navigating to the Looker instance URL to see if you receive an IP Address Not on Allowlist error.