The LookML Diagram is an extension — a web application built using Looker components — developed using the Looker extension framework and deployed through the Looker Marketplace.
The LookML Diagram is an entity-relationship diagram of a LookML model that visually depicts relationships between its LookML objects. Use this extension to:
- Assess the structure of the LookML model, identifying areas where LookML can be consolidated and determining how best to add to the model
- Identify incorrect logic, reducing the chances of incorrect calculations and poor query performance
- Learn how to do code-based (LookML) data modeling
This documentation page describes how to use the LookML Diagram version 2.0.0. and later. Looker admins should refer to the Configuring the LookML Diagram extension documentation page for instructions on how to enable this extension for Looker users.
This page discusses how to:
- Navigate to the LookML Diagram
- Observe LookML object relationships with the LookML Diagram
- Configure diagram settings
- Configure view options for an Explore
- Interpret the diagram canvas
- Observe object information with the Object Profiler
Navigating to the LookML Diagram
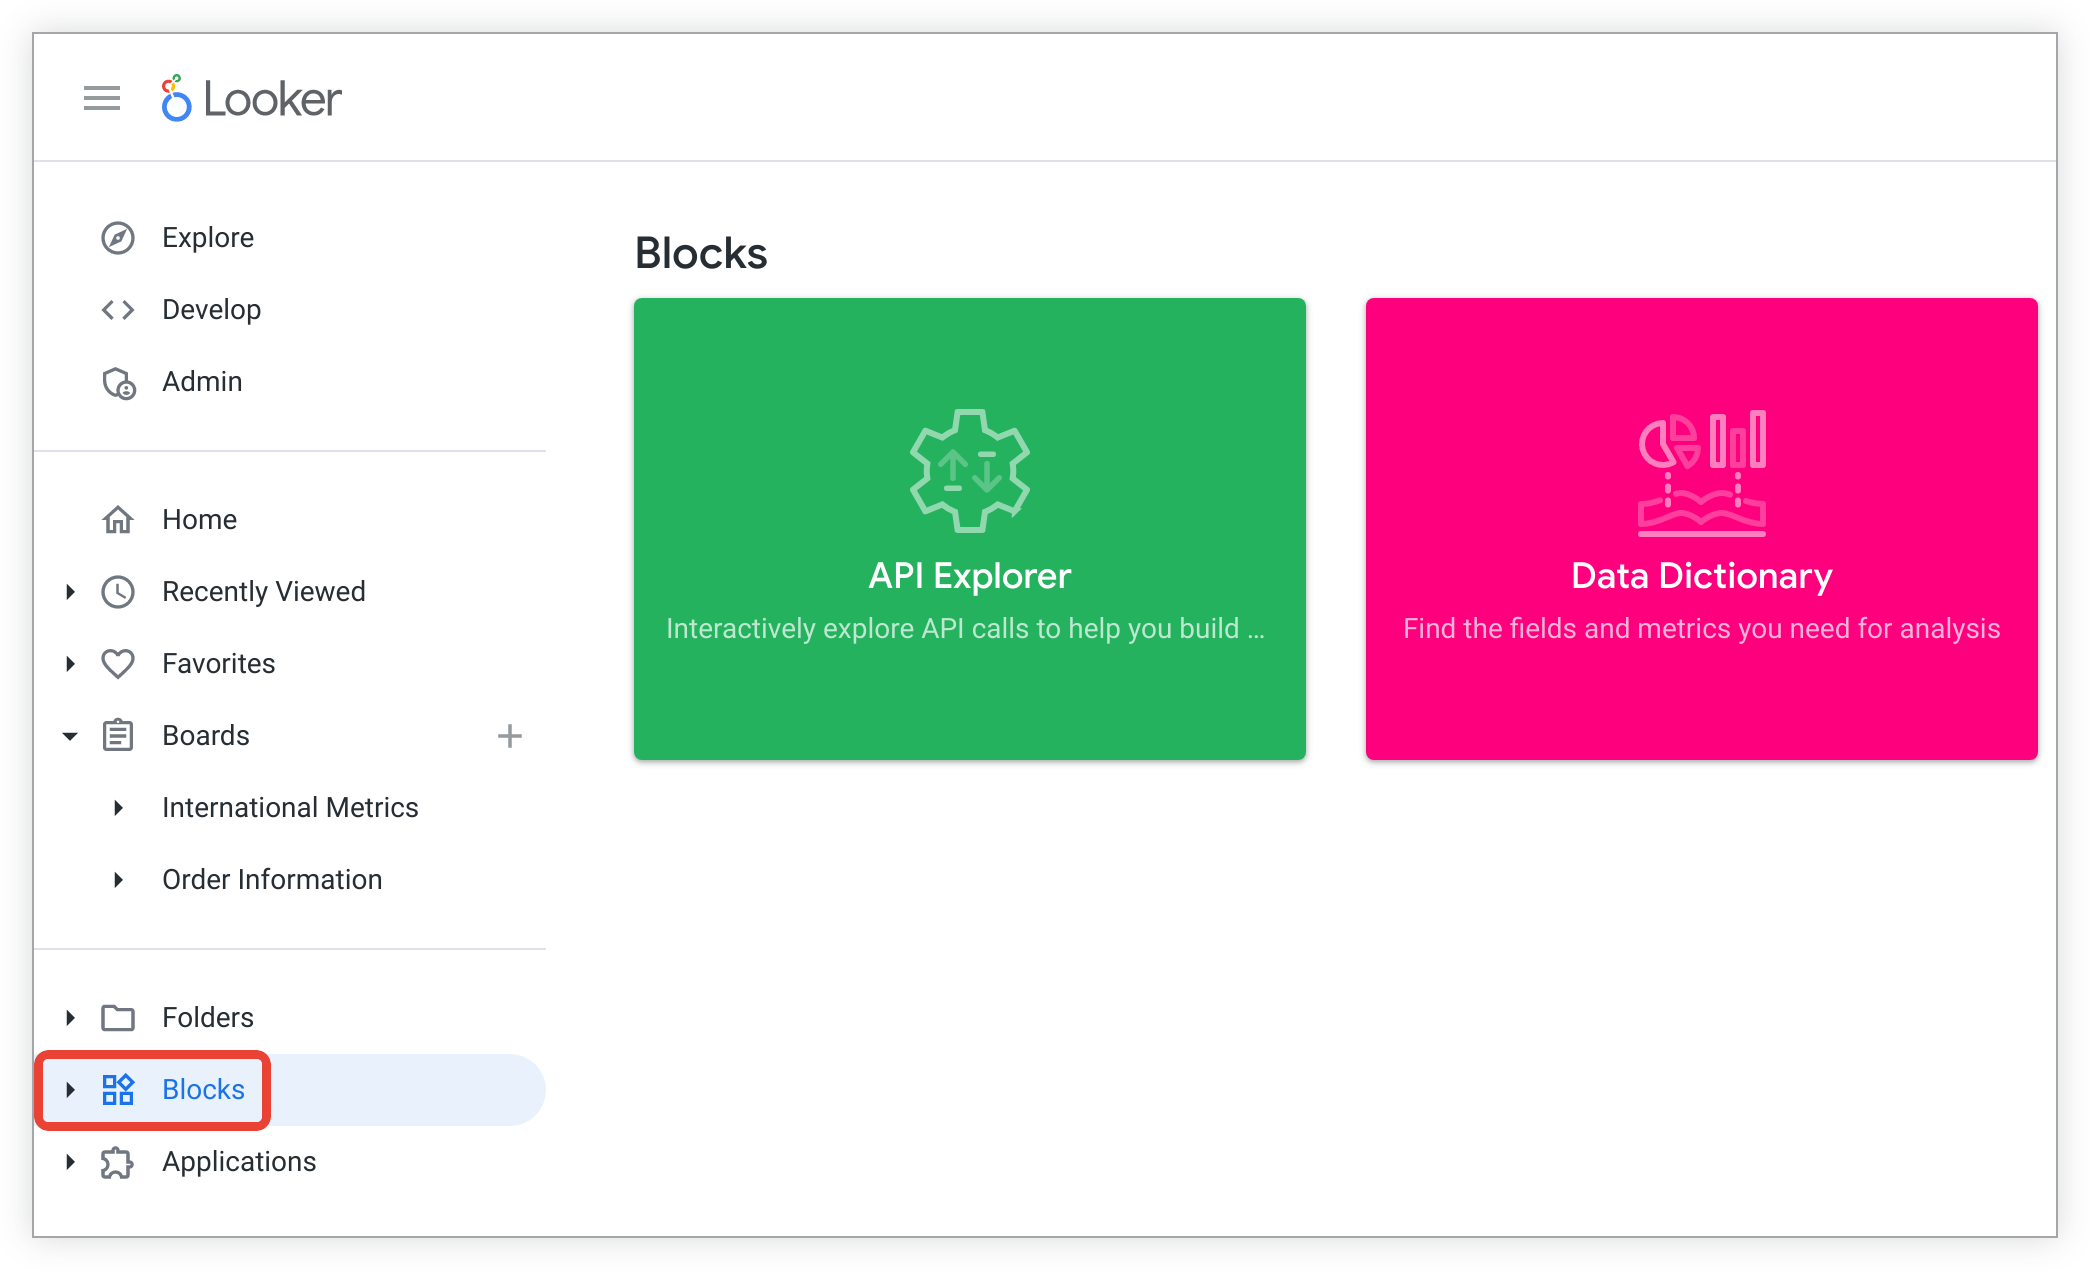
After the LookML Diagram has been installed, you can navigate to the LookML Diagram by clicking Blocks in the left navigation panel and then selecting the LookML Diagram tile.
Observing LookML object relationships with the LookML Diagram
Your Looker admin must grant you permissions to the lookml_diagram model and any model that you want to view in the extension.
The LookML Diagram extension consists of these elements:
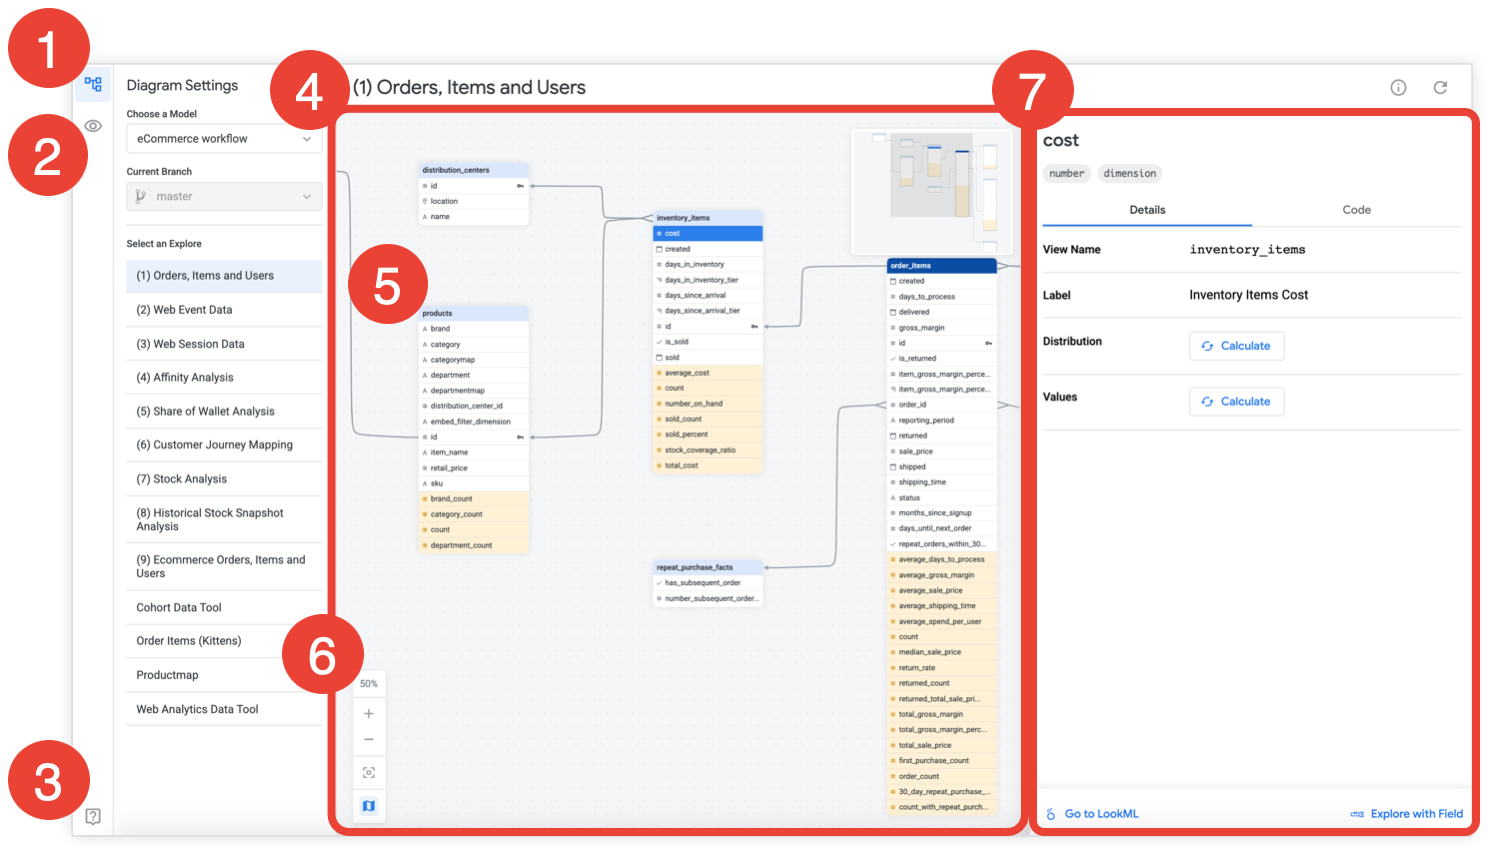
- A Diagram Settings panel to select a model, a Git branch, and an Explore
- A View Options panel to refine which fields you would like to view
- A Diagram Help section to provide additional explanation of the diagram elements
- A diagram canvas to interact with the LookML objects in the selected Explore
- A selected Explore's list of fields, grouped by view
- A toolbar with zoom and position options and an icon to show or hide the canvas minimap, which helps to orient yourself within a larger diagram
- A Object Profiler to view information about the LookML object and navigate to its associated LookML or Explore, if applicable
Double-click either the Diagram Settings icon or the View Options icon to collapse the left panel.
Configuring diagram settings
Click the diagram icon in the diagram navigation bar to display Diagram Settings.
The Choose a Model drop-down lists all the models for which you have permissions to view. Once you've selected a model, two additional options appear:
The Current Branch drop-down populates with a list of that model's Git branches. If the model has only one branch — usually the production branch — that branch is displayed. If you are in Production Mode or if you do not have permissions to change Git branches, the Current Branch drop-down menu is disabled.
If your admin has granted you permissions to change Git branches on the LookML Diagram, turn on Development Mode, ensure that both a model and an Explore are selected, and then select a branch to view the diagram according to how the model is set up on that branch.
The Select an Explore list populates with a list of that model's Explores. Click on the name of an Explore to see its fields, grouped by view, displayed on the page canvas.
Explore viewing options
With an Explore selected, you can use the View Options panel to restrict which fields and views are displayed on the canvas.
Limiting displayed fields
You can choose to display all fields in each view of the Explore by selecting All fields under Fields to Display; or, to show only the views that have fields joined to other fields, select Fields with joins.
If enabled, the Hide hidden fields toggle hides any field that contains hidden: yes in its underlying LookML. The Hide hidden fields toggle is enabled by default.
Limiting displayed views
The Views section of the View Options panel shows a list of the views present in the selected Explore. By default, all views are displayed on the diagram canvas. When you hide a view, the view object and any joins that connect that view object to any other objects in the Explore are hidden from the diagram canvas.
Click Hide all to hide all the views in the Explore from the diagram canvas. Click Show all to unhide all views in that Explore.
You can also selectively hide individual views from the canvas by de-selecting the eye icon to the right of the view name. When the view is hidden, the view name appears grayed out and the eye icon has a slash through it. To unhide an individual hidden view, click the slashed-eye icon.
Interpreting the diagram canvas
The LookML Diagram canvas is where all entities and relationships for a given Explore are depicted. In the Looker vernacular you can think of the LookML Diagram as depicting how LookML objects are joined together in an Explore for a given model.
The object title bar across the top of the canvas displays the name of the Explore whose views are displayed on the canvas. Click the Explore info icon — an encircled "i" — in the object title bar to open the Object Profiler and learn more about the selected Explore. Click the clockwise arrow to reload the extension.
Entities
Each view of the Explore is represented as its own entity set, with the view name appearing at the top of the set:
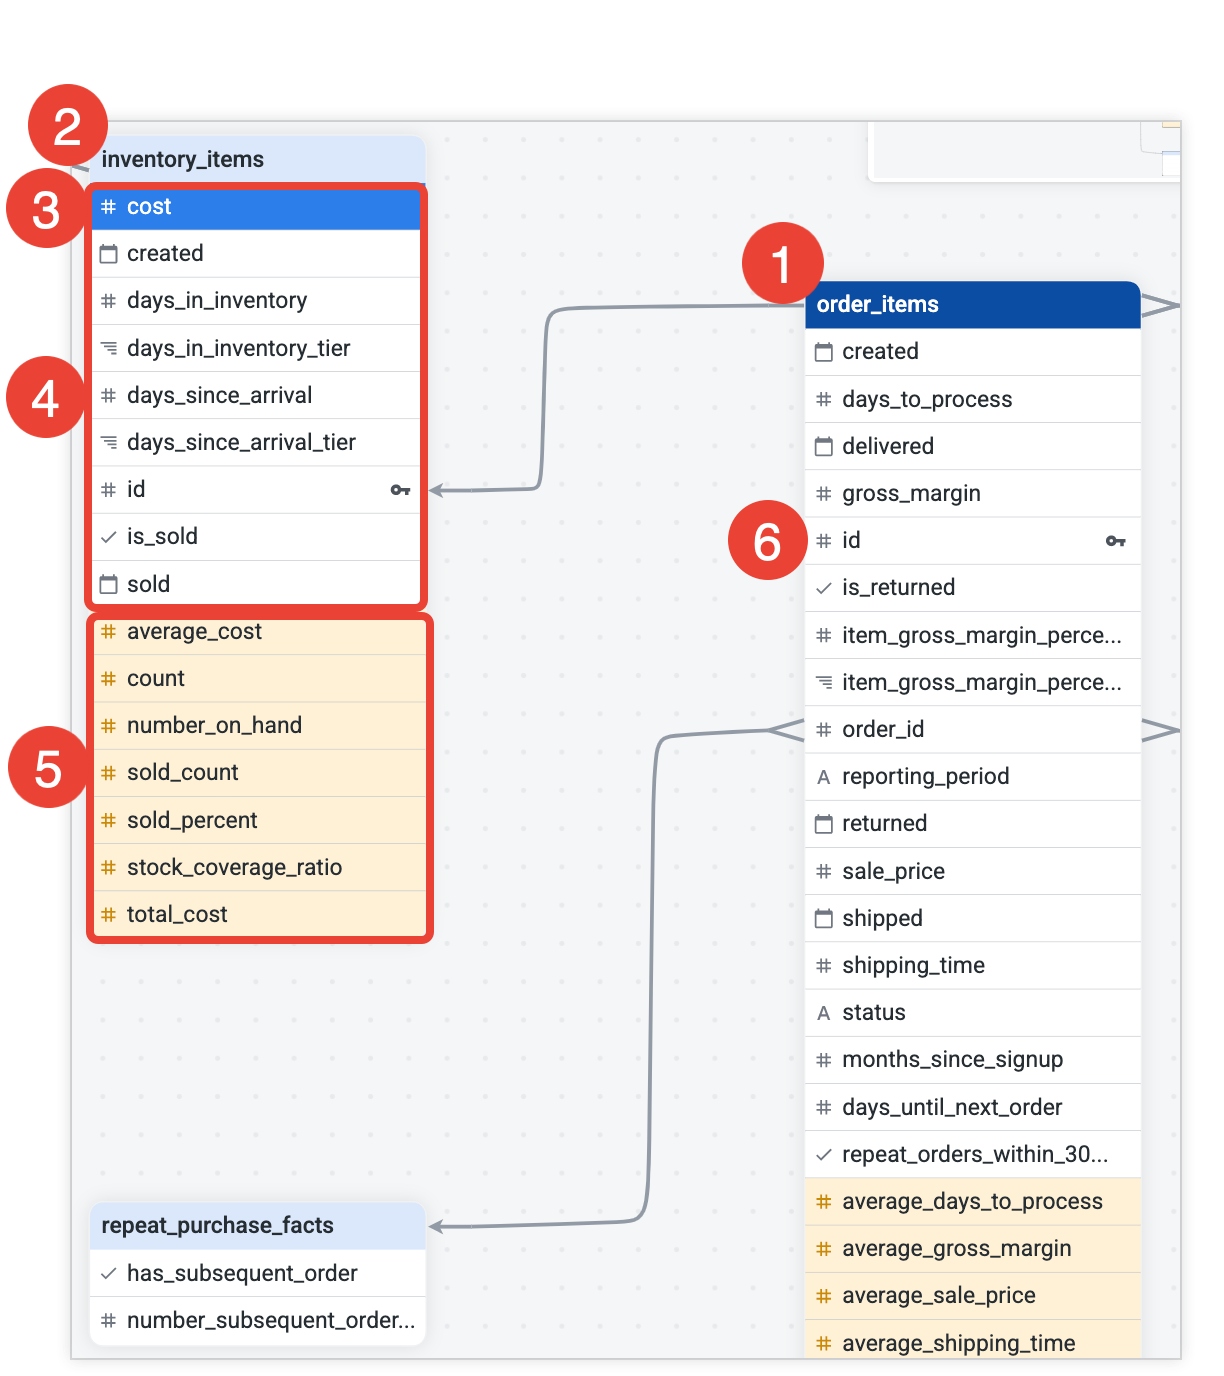
- The Explore's base view is indicated by a dark blue background.
- Joined views in the Explore have a light blue background.
When a join, view, or field is selected, it is highlighted in a bright blue.
Below each view is a list of fields belonging to that view:
Dimensions are listed at the top.
Measures are listed at the bottom and highlighted in light orange.
If the field is a primary key, a key icon appears to the right of the field name.
To the left of each field is an icon indicating its type:
- A: dimensions of
type: string - #: dimensions or measures of
type: number - Tiered bars: dimensions of
type: tier - Checkmark: dimensions of
type: yesno - Calendar: dimensions of
type: date,type: date_time,type: time - Map point: dimensions of
type: location,type: distance,type: zipcode
Click the field name to open the Object Profiler and learn more about the selected field.
Relationships
The diagram uses a line to depict how each object relates to other object in the selected model. The shape of the line, where it attaches to the view or field, conveys the cardinality of the relationship between the two objects; a forked line indicates a "many" cardinality, and a single line indicates a "one" cardinality. You would read the relationship as from the base view to the joined view. For example:
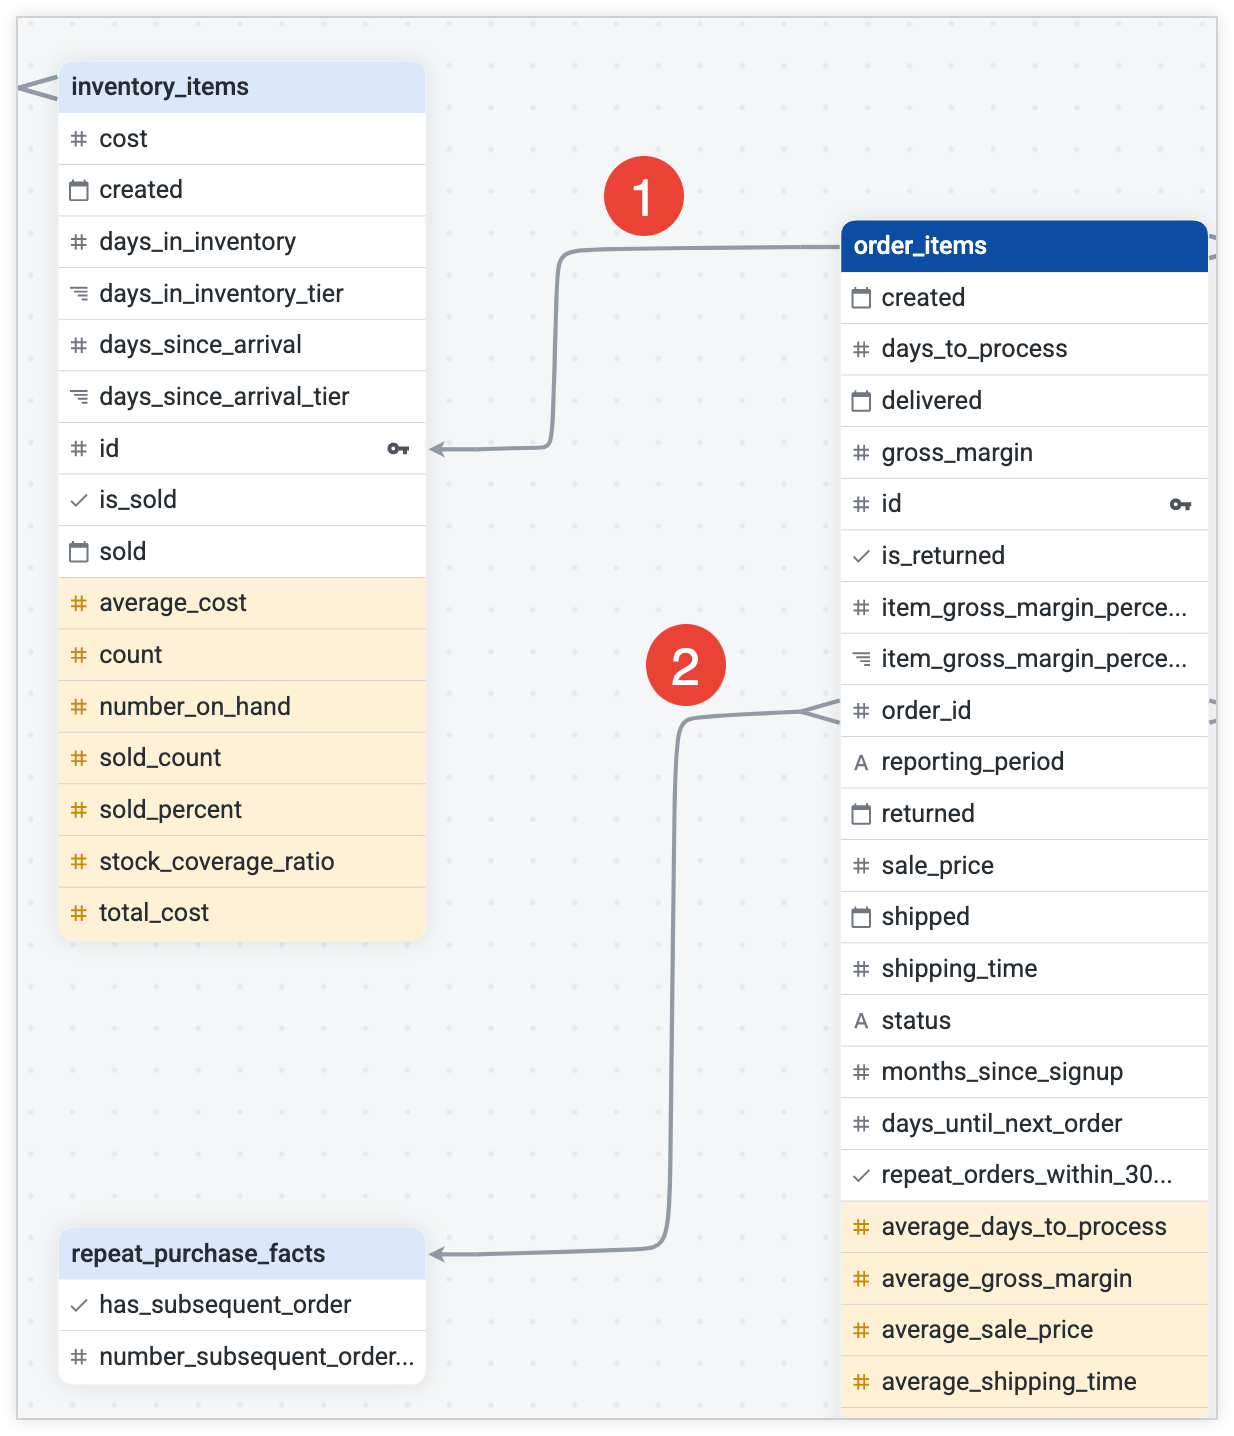
- A one-to-one join from
order_itemstoinventory_items, joining on theidfield - A many-to-one join from
order_itemstorepeat_purchase_facts
You can also hover over the line to see what type of join relationship connects the two objects.
Click the line to open the Object Profiler to view more information about the join.
Canvas viewing options
A minimap in the upper right of the canvas can help orient your placement within larger diagrams, with the grayed out portion of the map indicating what portion of the diagram is currently displayed on the canvas. Click and drag the empty space in the canvas to move to other parts of the diagram.
A vertical toolbar in the lower left of the canvas contains icons to control the diagram display:
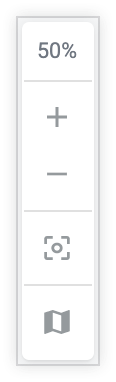
- Click the (+) to zoom in and the (-) to zoom out of the diagram.
- Click the square icon to return to the default starting position of the diagram.
- Click the map icon to enable or disable the minimap.
Viewing object information with the Object Profiler
The Object Profiler displays information about the selected object. Click on any Explore, view, field, or join on the diagram canvas to open the Object Profiler on the right side of the canvas. Click the canvas to collapse the Object Profiler.
Explores
Click on the Explore info icon — an encircled "i" — on the right side of the object title bar.
For the Explore selected in the Diagram Settings panel, the Object Profiler displays:
- Label: The value of the Explore
label. - Group Label: The value of the
group_labelparameter, which combines Explores into custom groups in the Explore menu of Looker. If a group label is not defined for the Explore, this defaults to the name of the model. - Project Name: The name of the LookML project, as defined in the project settings.
- Connection Name: The value of the
connectionparameter, which specifies the database connection from which a model will retrieve data.
If you have permissions to view LookML, you can click Go to LookML at the bottom left of the Object Profiler to open the file where the Explore is defined. The file opens in a new browser tab with the line for the explore highlighted.
Views
Click on a view from the diagram canvas.
The Object Profiler displays the SQL Table Name if defined in the view's LookML. If no sql_table_name is defined for the view, the SQL Table Name is shown as unknown.
If you have permissions to view LookML, you can click Go to LookML at the bottom left of the Object Profiler to open the file where the Explore to which the view is joined is defined. The file opens in a new browser tab with the line for the explore highlighted.
Fields
Click on a field from the diagram canvas.
The Object Profiler displays the field name, type, and type value, and whether the field is a primary key at the top of the panel. Two tabs in the profiler — Details and Code — show additional information about the field.
In the Details tab, you can view:
- View Name: The name of the view to which the field belongs.
- Label: How the field will appear in the Data section of an Explore, which is the name or label of the view followed by the name or label of the field.
- Distribution: For numeric dimensions on a view with a measure that has
type: count, click Calculate to show a preview of a column chart depicting the distribution of the count values. The Distribution section will also display the minimum, maximum, and average values of the numeric dimension series. - Values: For numeric dimensions on a view with a measure that has
type: count, click Calculate to show a preview of count values. Click Explore More to open the Explore to which this field belongs.
In the Code tab, you can view the field parameter and subparameters.
If you have permissions to view LookML, you can click Go to LookML at the bottom left of the Object Profiler to open the file where the join is defined. The file opens in a new browser tab at the line for the join's Explore.
If you have permissions to explore data, click Explore with Field at the bottom right of the Object Profiler to open an Explore with that field pre-selected in the Explore field picker.
Joins
Click on a join from the diagram canvas.
The Object Profiler displays the join statement that describes the join relationship and the type and cardinality of the join.
If you have permissions to view LookML, you can click Go to LookML at the bottom left of the Object Profiler to open the file where the join is defined. The file opens in a new browser tab at the line for the join's Explore.