BigQuery is designed to help you unify your data, connect it to AI and automate common data tasks, freeing up valuable time for exploration, model building, and strategic analysis, all with leading price-performance.
Use Gemini-powered agents to automate manual tasks or build your own custom agents
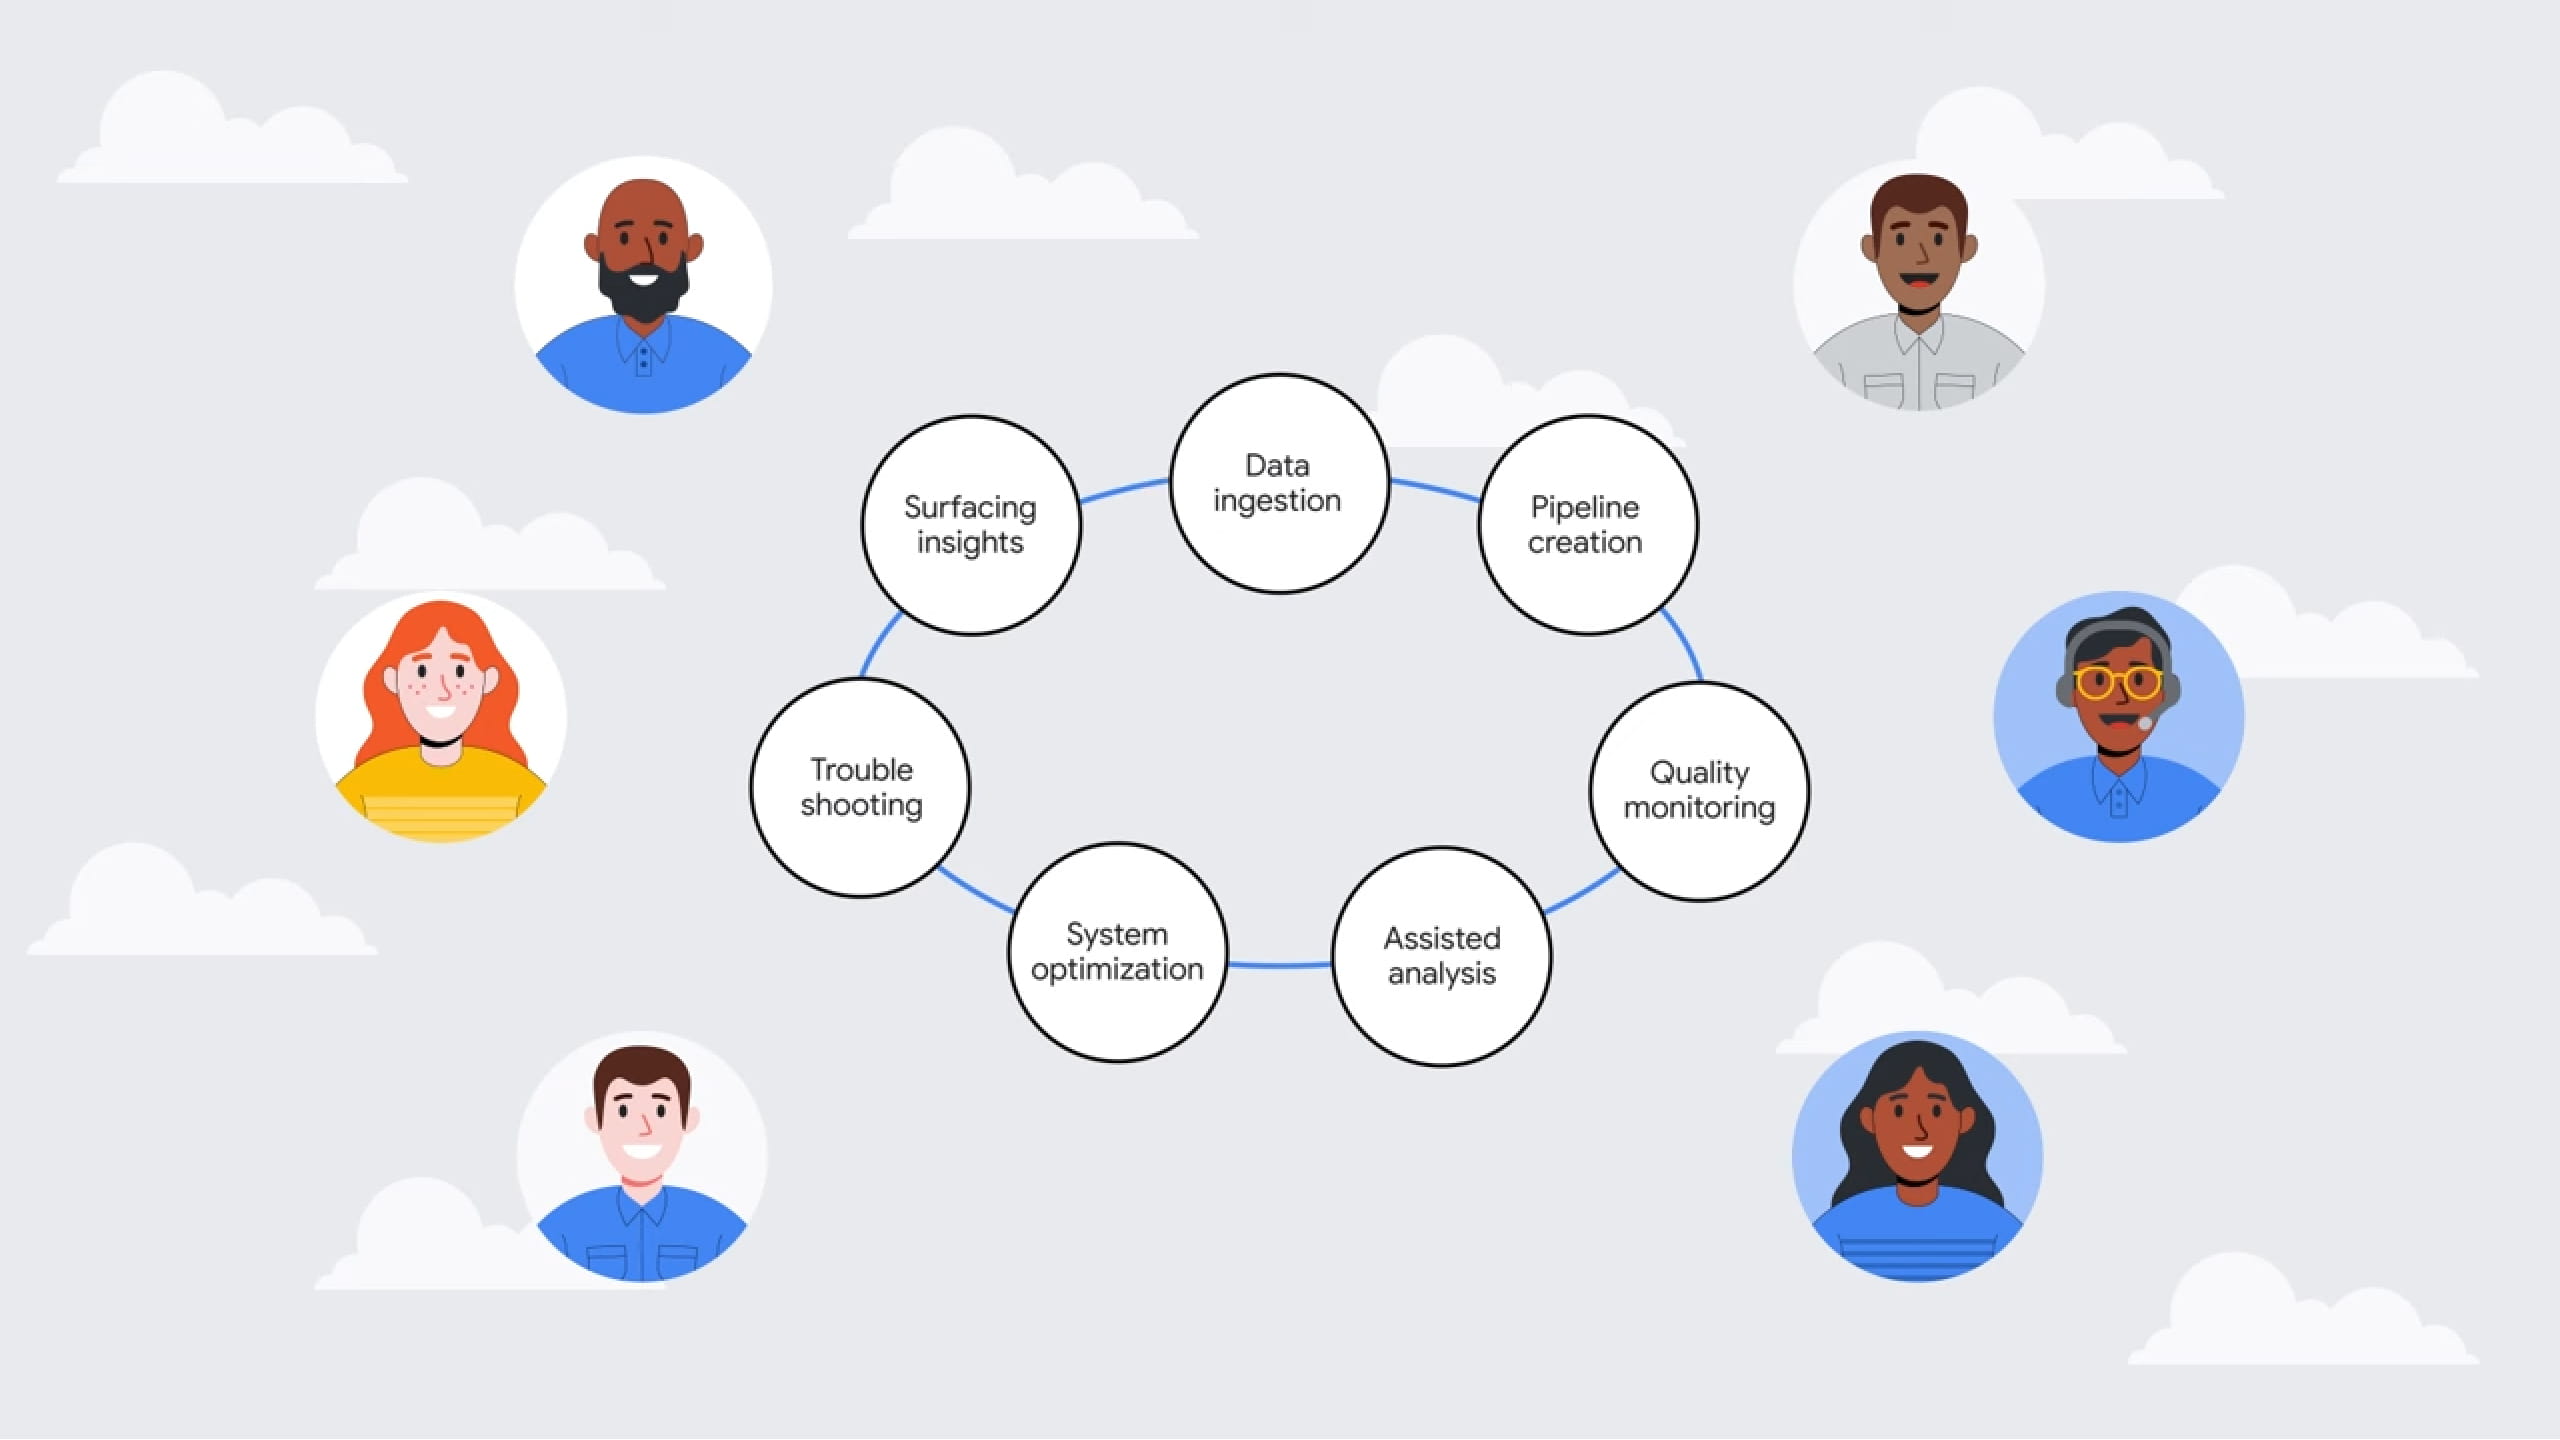
Drive AI-powered innovation with intelligent search and all-new agentic experiences, enriched with semantic layer for accuracy. BigQuery provides built-in assistive agents for all data users to streamline workflows across every stage of the data and AI lifecycle, freeing up your time to focus on solving bigger data challenges and opportunities.
“Gemini in BigQuery has transformed our query generation process. The integration into BigQuery makes it easy to generate SQL templates and has helped boost the efficiency of our label and feature engineering, including crucial machine learning model monitoring queries. Gemini’s ability to understand complex data structures and deliver accurate queries has made our workflow smoother and faster than ever.”
Martijn Wieriks, Chief Data Officer, Julo
Bring multiple engines to a single copy of governed, secured data
BigQuery brings multiple engines, including SQL, Spark and Python, together in a single platform that can run on a single copy of multimodal, governed data. A universal catalog and metastore for shared runtime metadata provides unified security and governance controls across all engines and storage types, including support for Apache Iceberg.
“BigQuery and Gemini Enterprise Agent Platform bring all our data and AI together into a single platform. This has transformed how we take action on customer feedback from a lengthy manual process, to a simple natural language query in seconds, allowing us to get to customer insights in minutes instead of months.”
TJ Allard, Lead Data Scientist at Mattel

Ensure your data and AI platform remains flexible, scalable, and adaptable to the ever-changing technological landscape
BigQuery's openness empowers organizations with flexibility and scalability. Google Cloud's commitment to open source, open standards, and AI lets you choose best-fit solutions. Leverage OSS engines like Apache Spark, open formats like Apache Iceberg, and your choice of AI models.
“We are building our unified data and AI foundation using Google Cloud's lakehouse stack, where BigQuery and Lakehouse for Apache Iceberg enable us to securely discover and manage all data types and formats in a single platform to build the best possible experiences for our patients, doctors, and nurses.”
Mangesh Patil, Chief Analytics Officer, HCA Healthcare

Connect all of your data to industry-leading AI
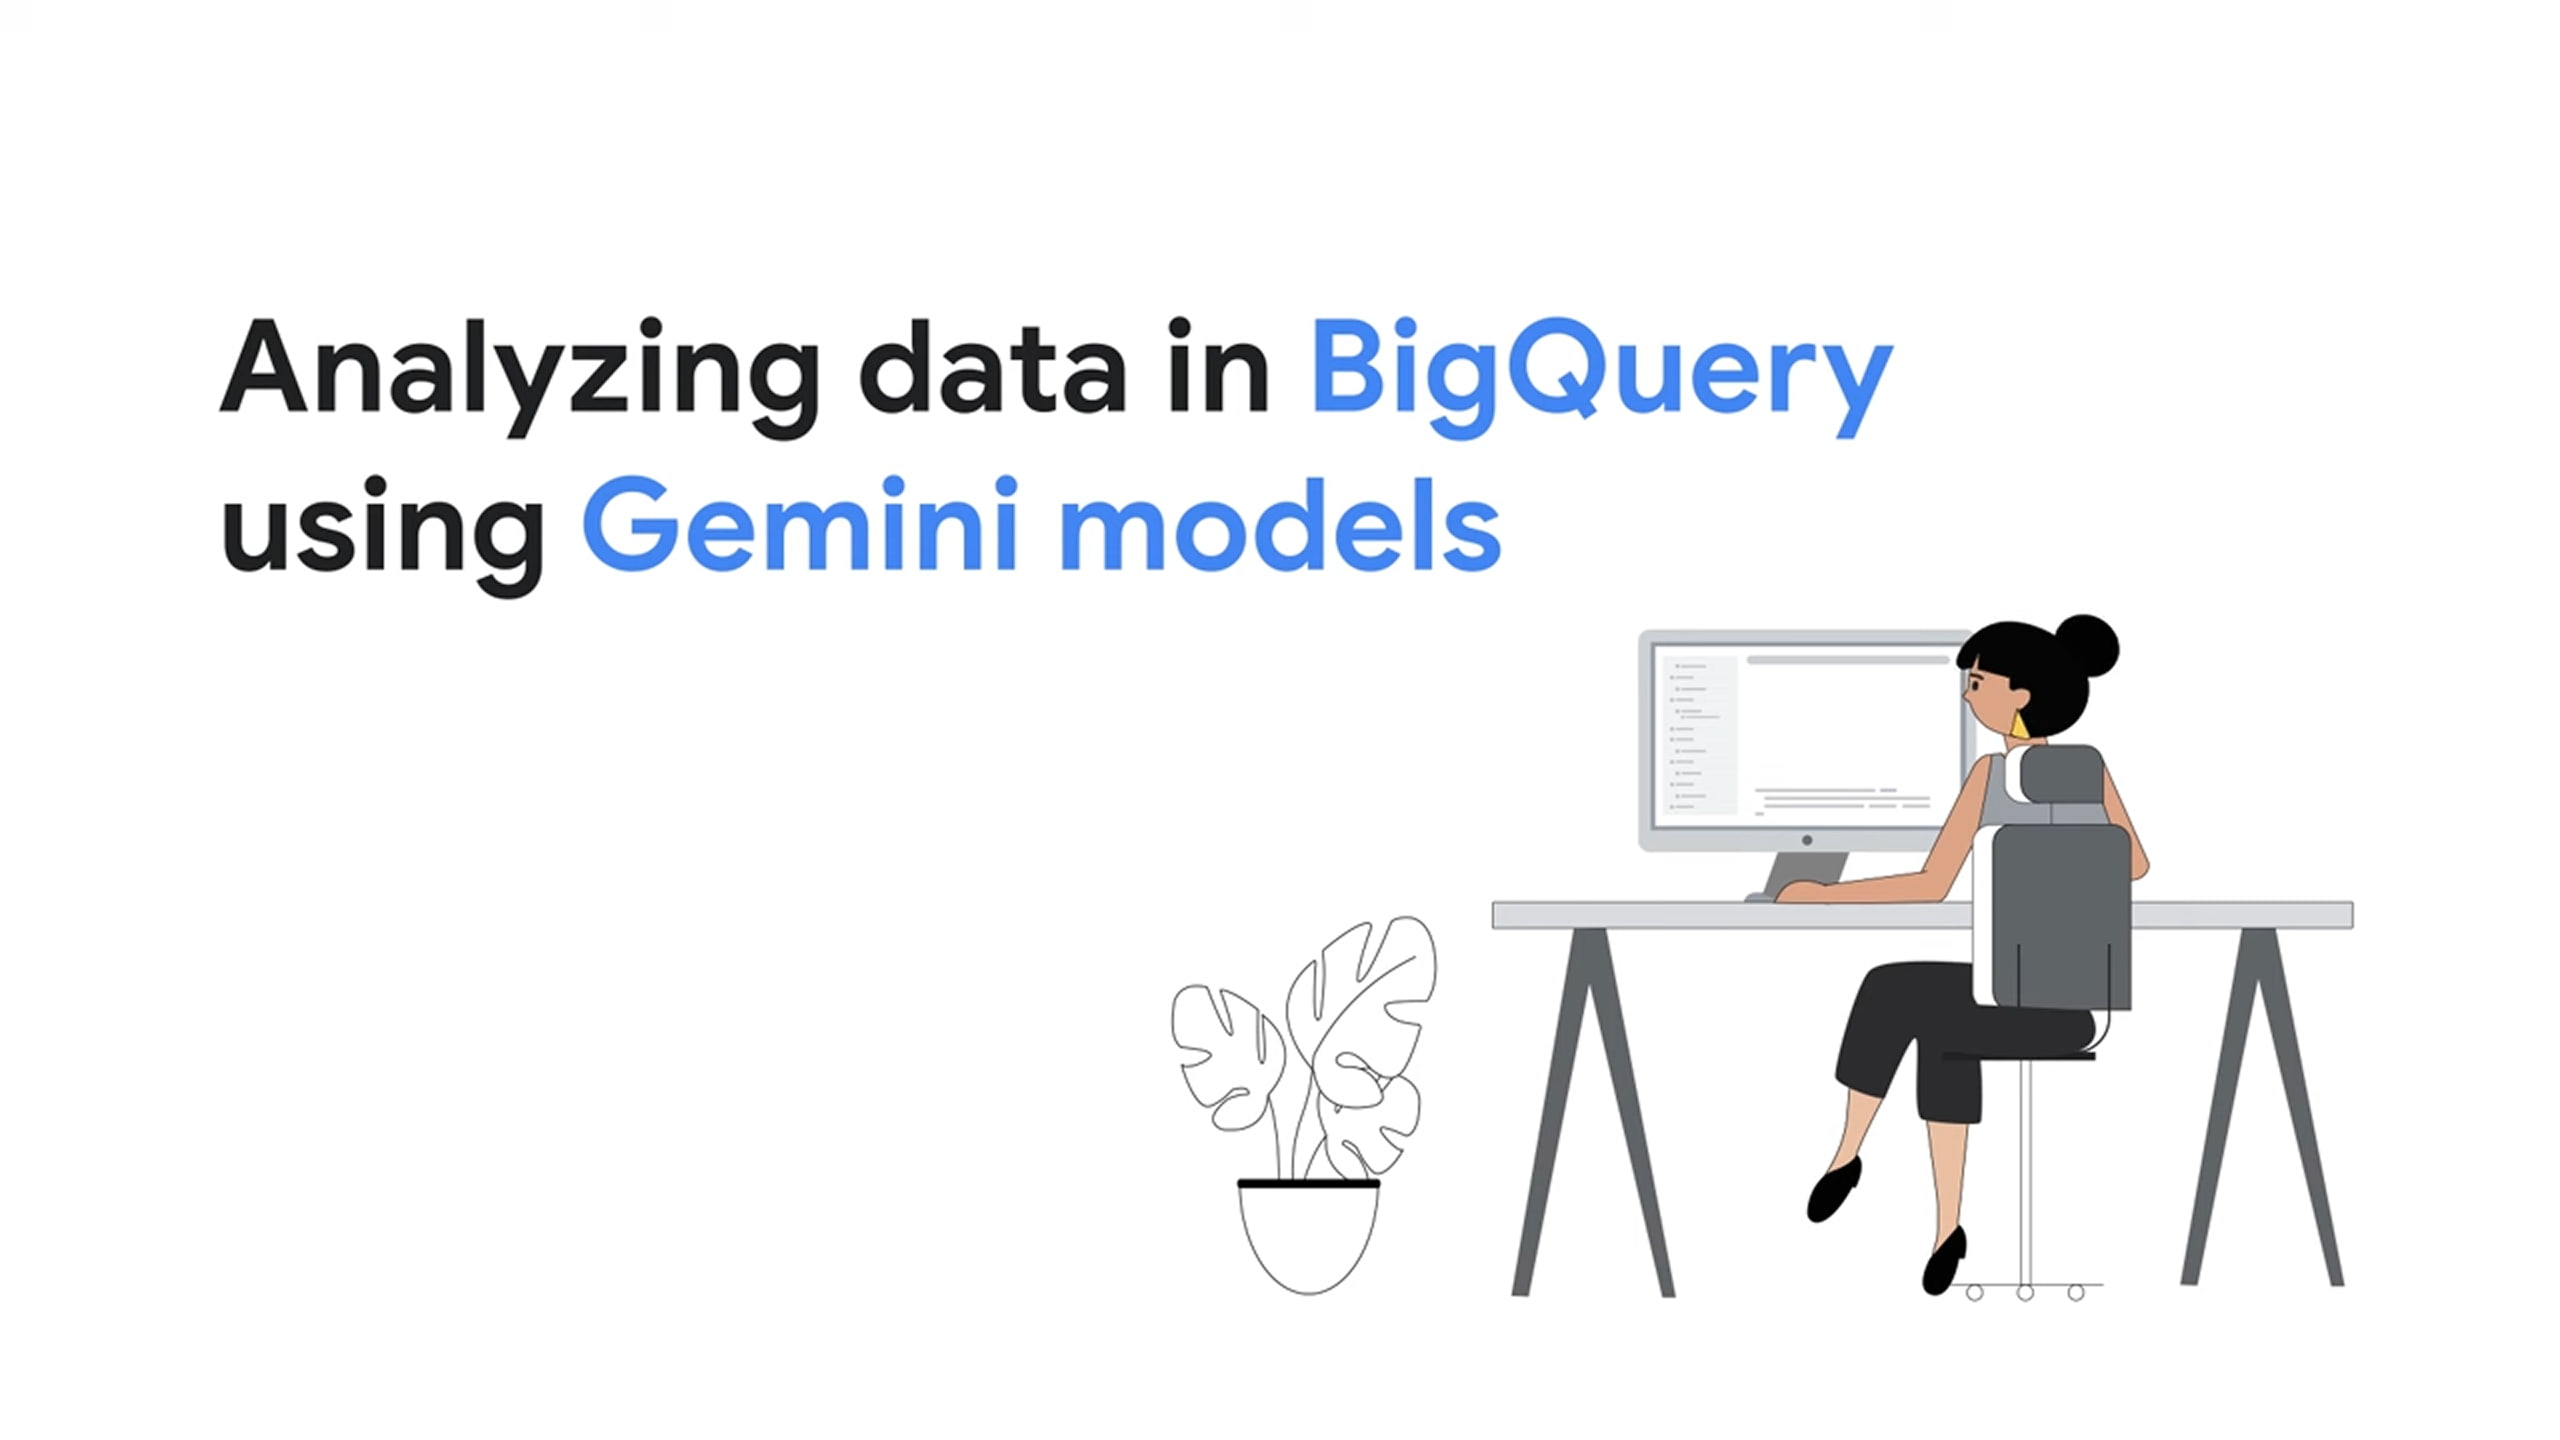
BigQuery simplifies data analytics by providing an integrated experience for data and AI. Use Google’s latest AI models to perform multimodal data analysis and more. BigQuery has the simplicity and scale to manage multimodal data with your choice of engines (SQL, Python, or Spark) at the best price and performance with data governance and security built-in.
“With the new imported model capability with object table, we are able to import state-of-the-art Pytorch vision models to process image data and improve in-orchard temperature prediction using BigQuery. And with the new remote model capability, we can greatly simplify our pipelines and improve maintainability.”
Sarah Overduin, Data Scientists, Semios

Maximize the potential of your real-time data
AI often requires real-time data, and BigQuery has these capabilities built-in. From SQL-based easy streaming with BigQuery continuous queries to a managed service for popular open-source Kafka platforms, and advanced multimodal data streaming with Dataflow with support for Iceberg, you can make real-time data and AI a reality.
“Implementing a high-throughput, low-latency streaming platform is critical to providing high cardinality analytics to business, developers and our command center teams. The Dataflow integration has now empowered our engineering teams with a strong platform to monitor paypal.com 24 x 7 thereby ensuring PayPal is highly available for our consumers and merchants.”
Varun Raju, Architect, Observability Platform, PayPal
Agentic
Use Gemini-powered agents to automate manual tasks or build your own custom agents
Drive AI-powered innovation with intelligent search and all-new agentic experiences, enriched with semantic layer for accuracy. BigQuery provides built-in assistive agents for all data users to streamline workflows across every stage of the data and AI lifecycle, freeing up your time to focus on solving bigger data challenges and opportunities.
“Gemini in BigQuery has transformed our query generation process. The integration into BigQuery makes it easy to generate SQL templates and has helped boost the efficiency of our label and feature engineering, including crucial machine learning model monitoring queries. Gemini’s ability to understand complex data structures and deliver accurate queries has made our workflow smoother and faster than ever.”
Martijn Wieriks, Chief Data Officer, Julo
Unified
Bring multiple engines to a single copy of governed, secured data
BigQuery brings multiple engines, including SQL, Spark and Python, together in a single platform that can run on a single copy of multimodal, governed data. A universal catalog and metastore for shared runtime metadata provides unified security and governance controls across all engines and storage types, including support for Apache Iceberg.
“BigQuery and Gemini Enterprise Agent Platform bring all our data and AI together into a single platform. This has transformed how we take action on customer feedback from a lengthy manual process, to a simple natural language query in seconds, allowing us to get to customer insights in minutes instead of months.”
TJ Allard, Lead Data Scientist at Mattel
Flexible
Ensure your data and AI platform remains flexible, scalable, and adaptable to the ever-changing technological landscape
BigQuery's openness empowers organizations with flexibility and scalability. Google Cloud's commitment to open source, open standards, and AI lets you choose best-fit solutions. Leverage OSS engines like Apache Spark, open formats like Apache Iceberg, and your choice of AI models.
“We are building our unified data and AI foundation using Google Cloud's lakehouse stack, where BigQuery and Lakehouse for Apache Iceberg enable us to securely discover and manage all data types and formats in a single platform to build the best possible experiences for our patients, doctors, and nurses.”
Mangesh Patil, Chief Analytics Officer, HCA Healthcare
Intelligent
Connect all of your data to industry-leading AI
BigQuery simplifies data analytics by providing an integrated experience for data and AI. Use Google’s latest AI models to perform multimodal data analysis and more. BigQuery has the simplicity and scale to manage multimodal data with your choice of engines (SQL, Python, or Spark) at the best price and performance with data governance and security built-in.
“With the new imported model capability with object table, we are able to import state-of-the-art Pytorch vision models to process image data and improve in-orchard temperature prediction using BigQuery. And with the new remote model capability, we can greatly simplify our pipelines and improve maintainability.”
Sarah Overduin, Data Scientists, Semios
Real-time
Maximize the potential of your real-time data
AI often requires real-time data, and BigQuery has these capabilities built-in. From SQL-based easy streaming with BigQuery continuous queries to a managed service for popular open-source Kafka platforms, and advanced multimodal data streaming with Dataflow with support for Iceberg, you can make real-time data and AI a reality.
“Implementing a high-throughput, low-latency streaming platform is critical to providing high cardinality analytics to business, developers and our command center teams. The Dataflow integration has now empowered our engineering teams with a strong platform to monitor paypal.com 24 x 7 thereby ensuring PayPal is highly available for our consumers and merchants.”
Varun Raju, Architect, Observability Platform, PayPal
BigQuery customer success stories
Executive resources
 Google is a leader, positioned furthest in vision, in the 2025 Gartner Magic Quadrant for Cloud DBMSDownload the complimentary report
10-min read
 BigQuery is named a Leader in The Forrester Wave™: Data Lakehouses, Q2 2024Download the report
10-min read
 An executive's guide to delivering value from data and AIGet the guide
10-min read