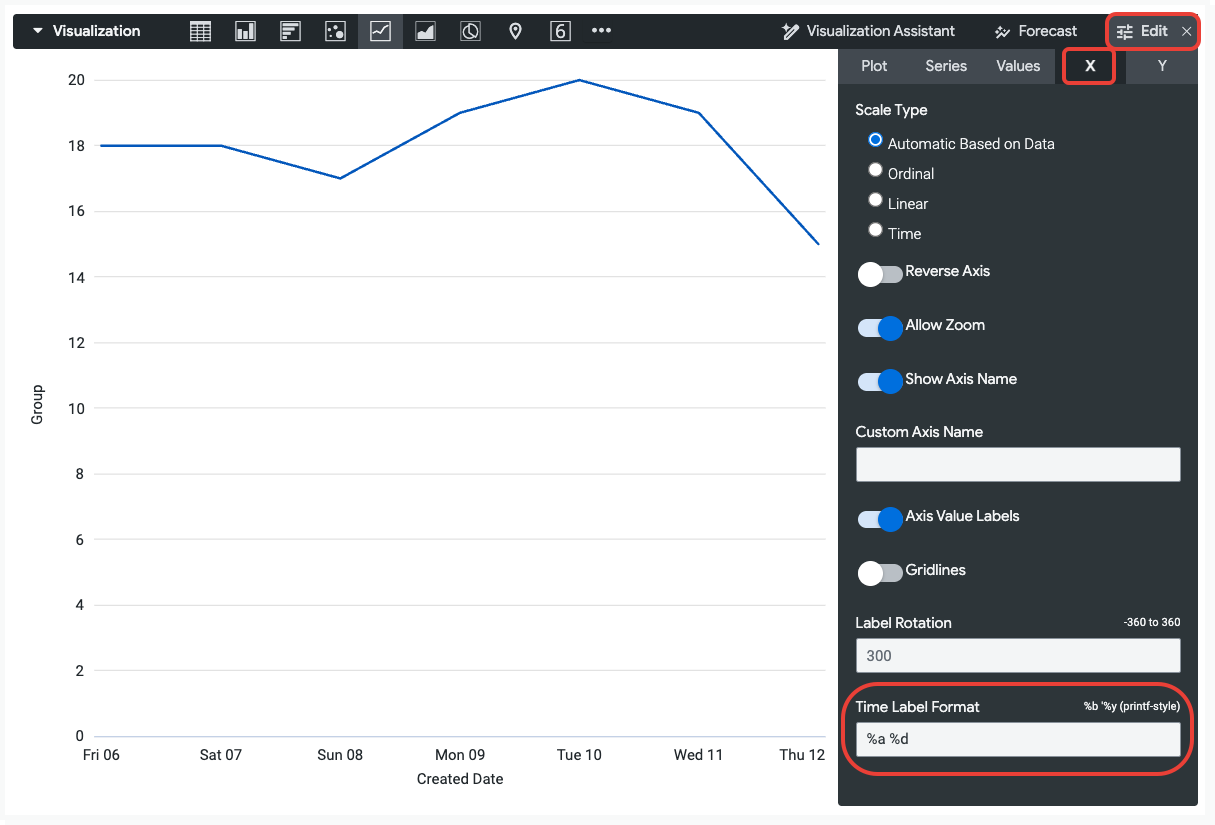
如果圖表的 x 軸有時間維度,您可以使用視覺化選項「X」分頁中的「時間標籤格式」設定,變更 x 軸標籤的格式。
時間標籤運算式
您可以使用下表中的語法,在 Looker 圖表中設定時間值的格式。
| 格式類型 | 說明 | 運算式 |
|---|---|---|
| 時間 | ||
| 時間 | 以十進位數字表示的毫秒:000 到 999 | %L |
| 時間 | 以兩位數表示的秒數:00 到 59 | %S |
| 時間 | 以兩位數表示的分鐘:00 到 59 | %M |
| 時間 | 以十進位數字表示的小時 (24 小時制):00 到 23 | %H |
| 時間 | 以十進位數字表示的小時 (12 小時制):01 到 12 | %I |
| 時間 | AM 或 PM | %p |
| 日期 | ||
| 日期 | 以十進位數字表示的每年日期:001 到 366 | %j |
| 日期 | 以零填補的每月日期:01 至 31 | %d |
| 日期 | 以空格填補的當月第幾天 (相當於 %_d):1 到 31 |
%e |
| 日期 | 完整星期幾名稱:星期一、星期二、星期三 | %A |
| 日期 | 縮寫的星期幾名稱 (3 個字母):週一、週二、週三 | %a |
| 日期 | 以十進位數字表示的星期幾 (星期日是每週的第一天):0 到 6 | %w |
| 週 | ||
| 週 | 以兩位數表示的每年週數 (星期日是每週的第一天):00 到 53
注意: |
%U |
| 週 | 以兩位數表示的每年週數 (星期一是每週的第一天):00 到 53
注意: |
%W |
| 月 | ||
| 月 | 兩位數月份:01 到 12 (不支援 1 到 12 格式) | %m |
| 月 | 縮寫的月份名稱:1 月、2 月、3 月 | %b |
| 月 | 完整月份名稱:一月、二月、三月 | %B |
| 年 | ||
| 年 | 兩位數年份:00 到 99 | %y |
| 年 | 四位數年份:2000、2001、2002 | %Y |
| 組合 | ||
| 組合 | 完整時間,格式為「%H:%M:%S」:23:56:12 | %X |
| 組合 | 完整日期,格式為「%m/%d/%Y」:01/27/2014 | %x |
| 組合 | 日期時間格式:「%a %b %e %H:%M:%S %Y」:Mon Jan 1 23:56:04 2014 | %c |
範例
您可以合併運算式來建立自訂時間格式,如下表範例所示。
| 輸入 | 時間標籤格式 | 輸出 |
|---|---|---|
| 2014 年 8 月 14 日下午 10:31 | %b '%y, %H:%M |
2014 年 8 月 22:31 |
| 2014 年 8 月 14 日下午 10:31 | %B %Y, %I:%M %p |
2014 年 8 月,晚上 10:31 |
| 2014 年 8 月 14 日下午 10:31 | %x %X |
08/14/2014 22:31:00 |
| 2014 年 8 月 14 日下午 10:31 | %I:%M:%S %p |
10:31:00 PM |