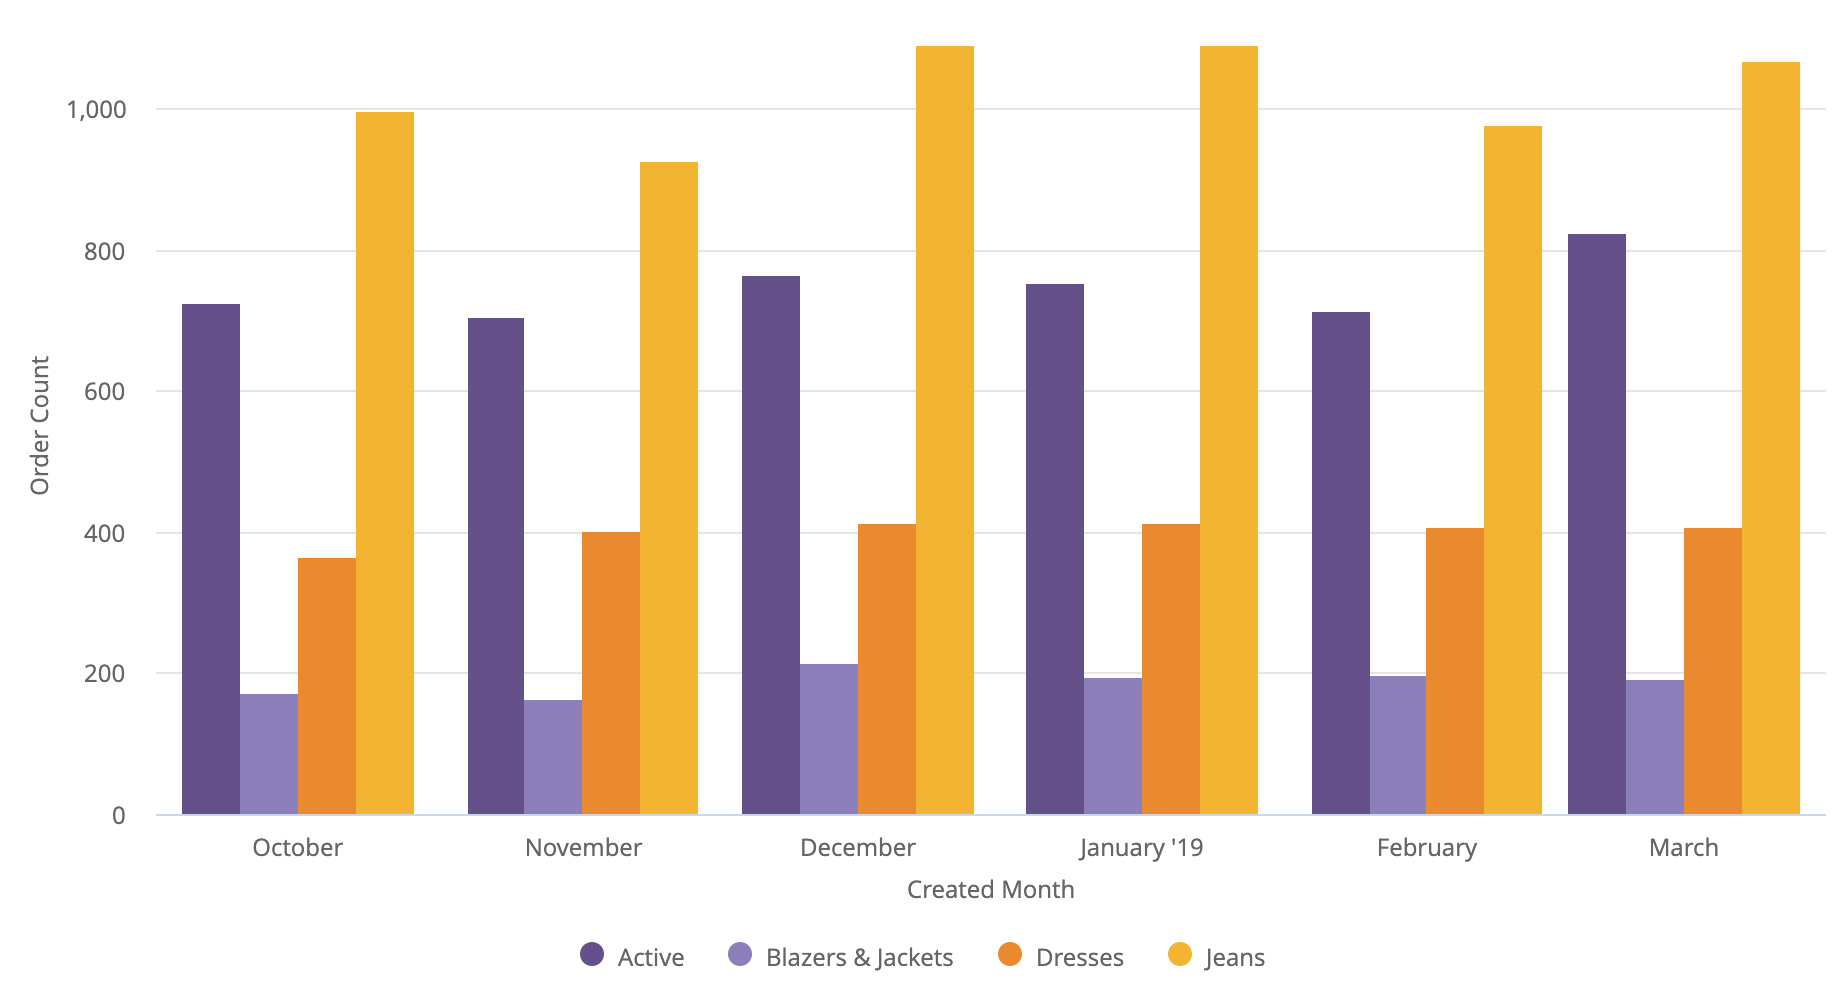
 If multiple measures are specified, each measure becomes a y-axis series. If pivots are present, each pivot and measure combination becomes a y-axis series. If no measures are specified, two dimensions can be plotted.
|
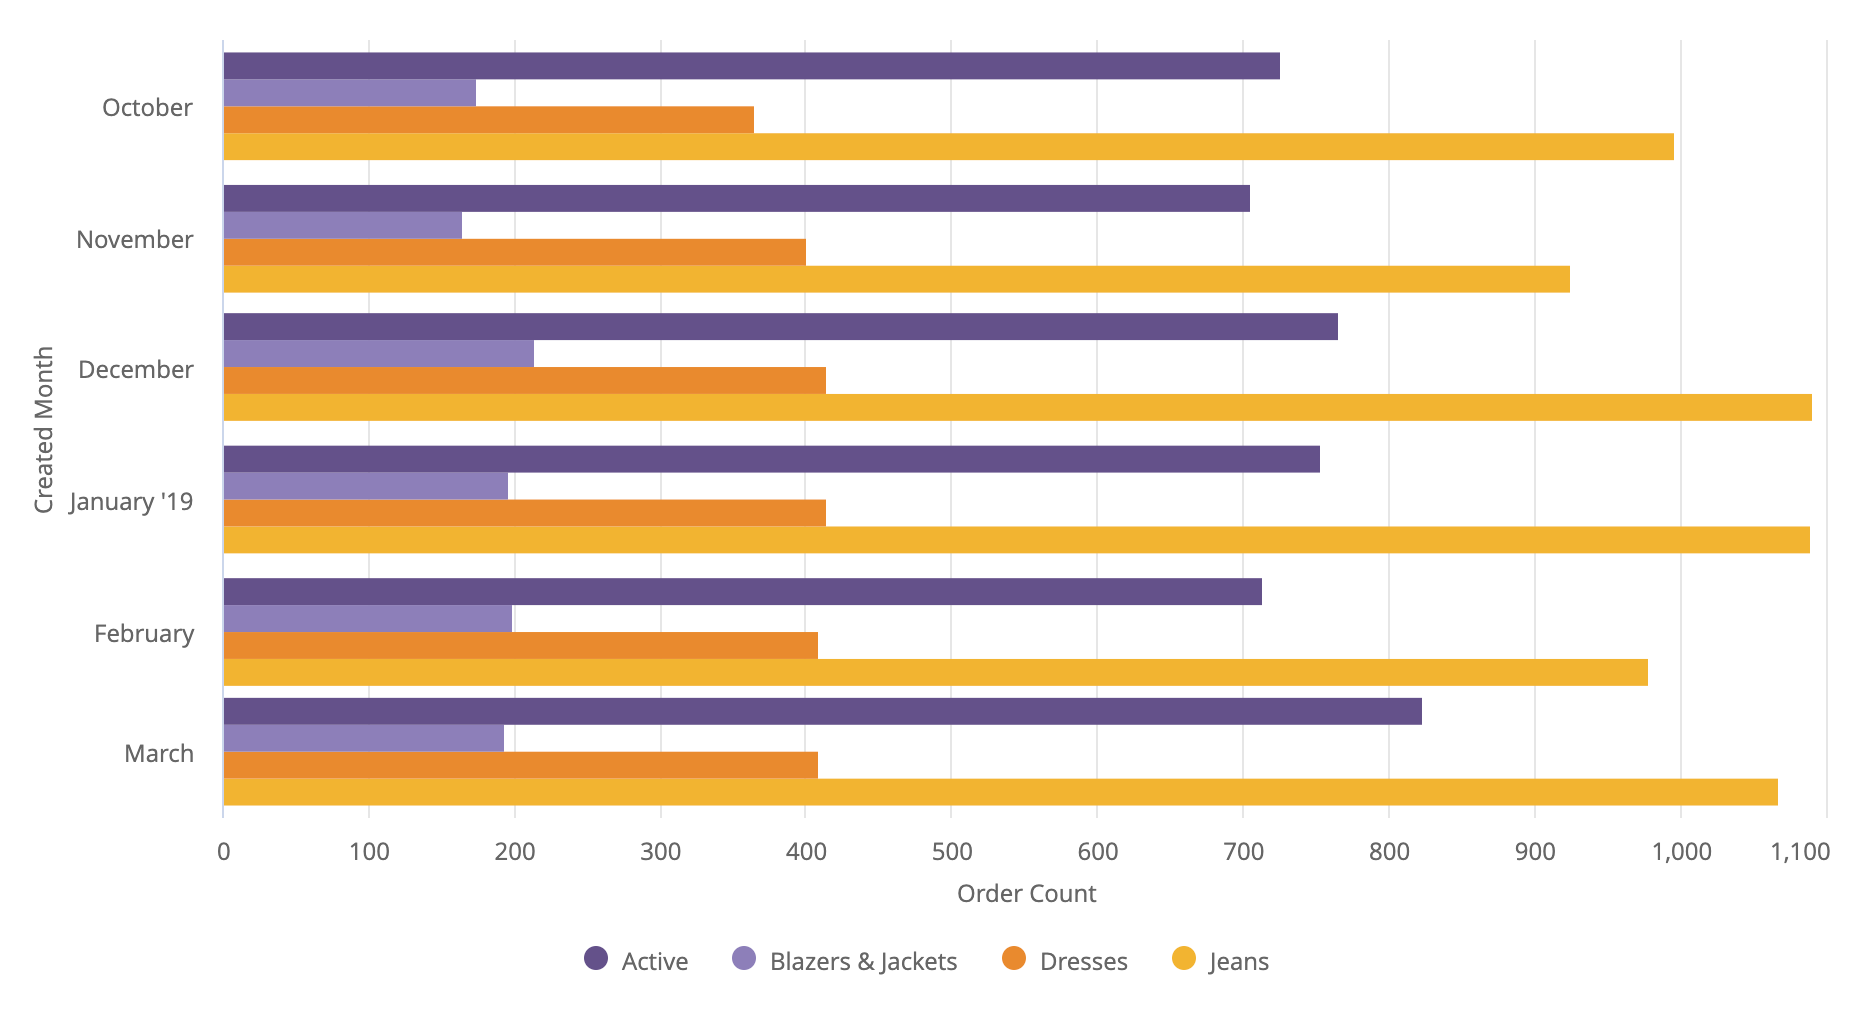 If multiple measures are specified, each measure becomes an x-axis series. If pivots are present, each pivot and measure combination becomes an x-axis series. If no measures are specified, two dimensions can be plotted.
|
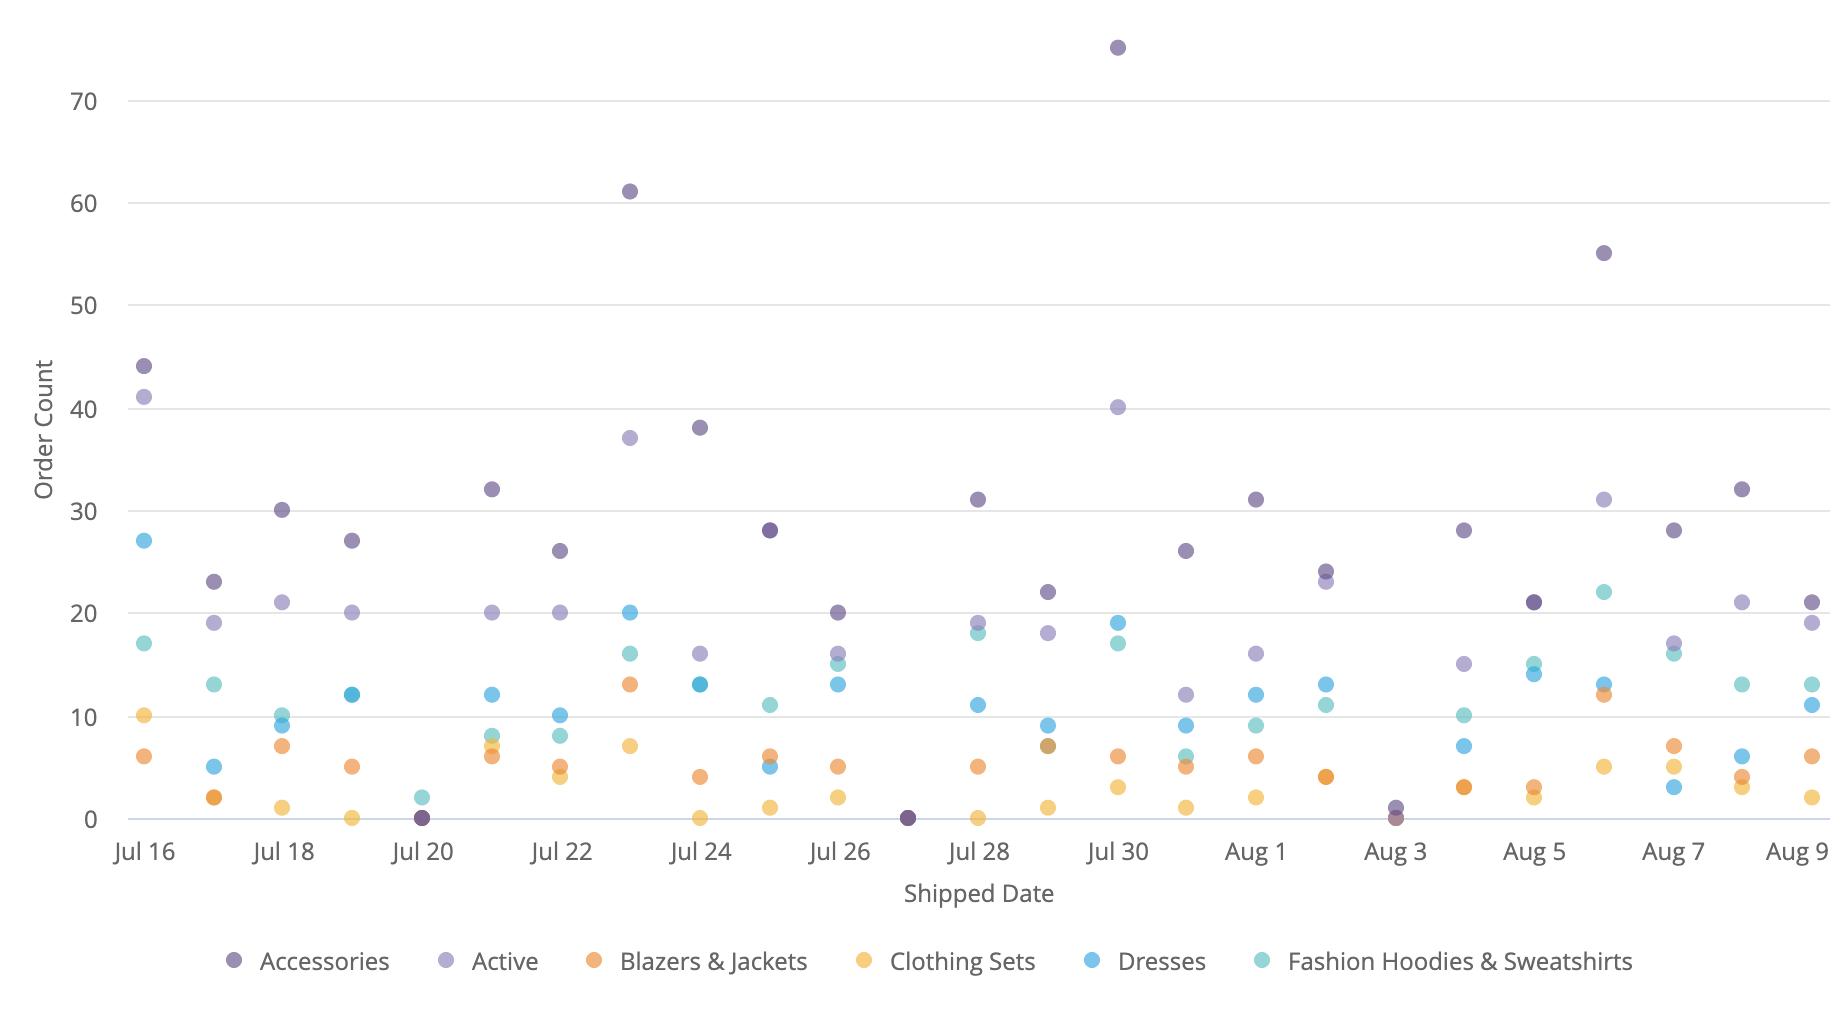 If two dimensions are specified, the first dimension is placed on the y-axis and the second dimension is placed on the x-axis. If multiple measures are specified, each measure becomes a y-axis series. If pivots are present, each pivot and measure combination becomes a y-axis series. If no measures are specified, two dimensions can be plotted.
|
 If multiple measures are specified, each measure becomes a y-axis series. If pivots are present, each pivot and measure combination becomes a y-axis series. If no measures are specified, two dimensions can be plotted.
|
 If multiple measures are specified, each measure becomes a y-axis series. If pivots are present, each pivot and measure combination becomes a y-axis series. If no measures are specified, two dimensions can be plotted.
|
 Elements of
 type: looker_pie require one dimension and one measure.
|
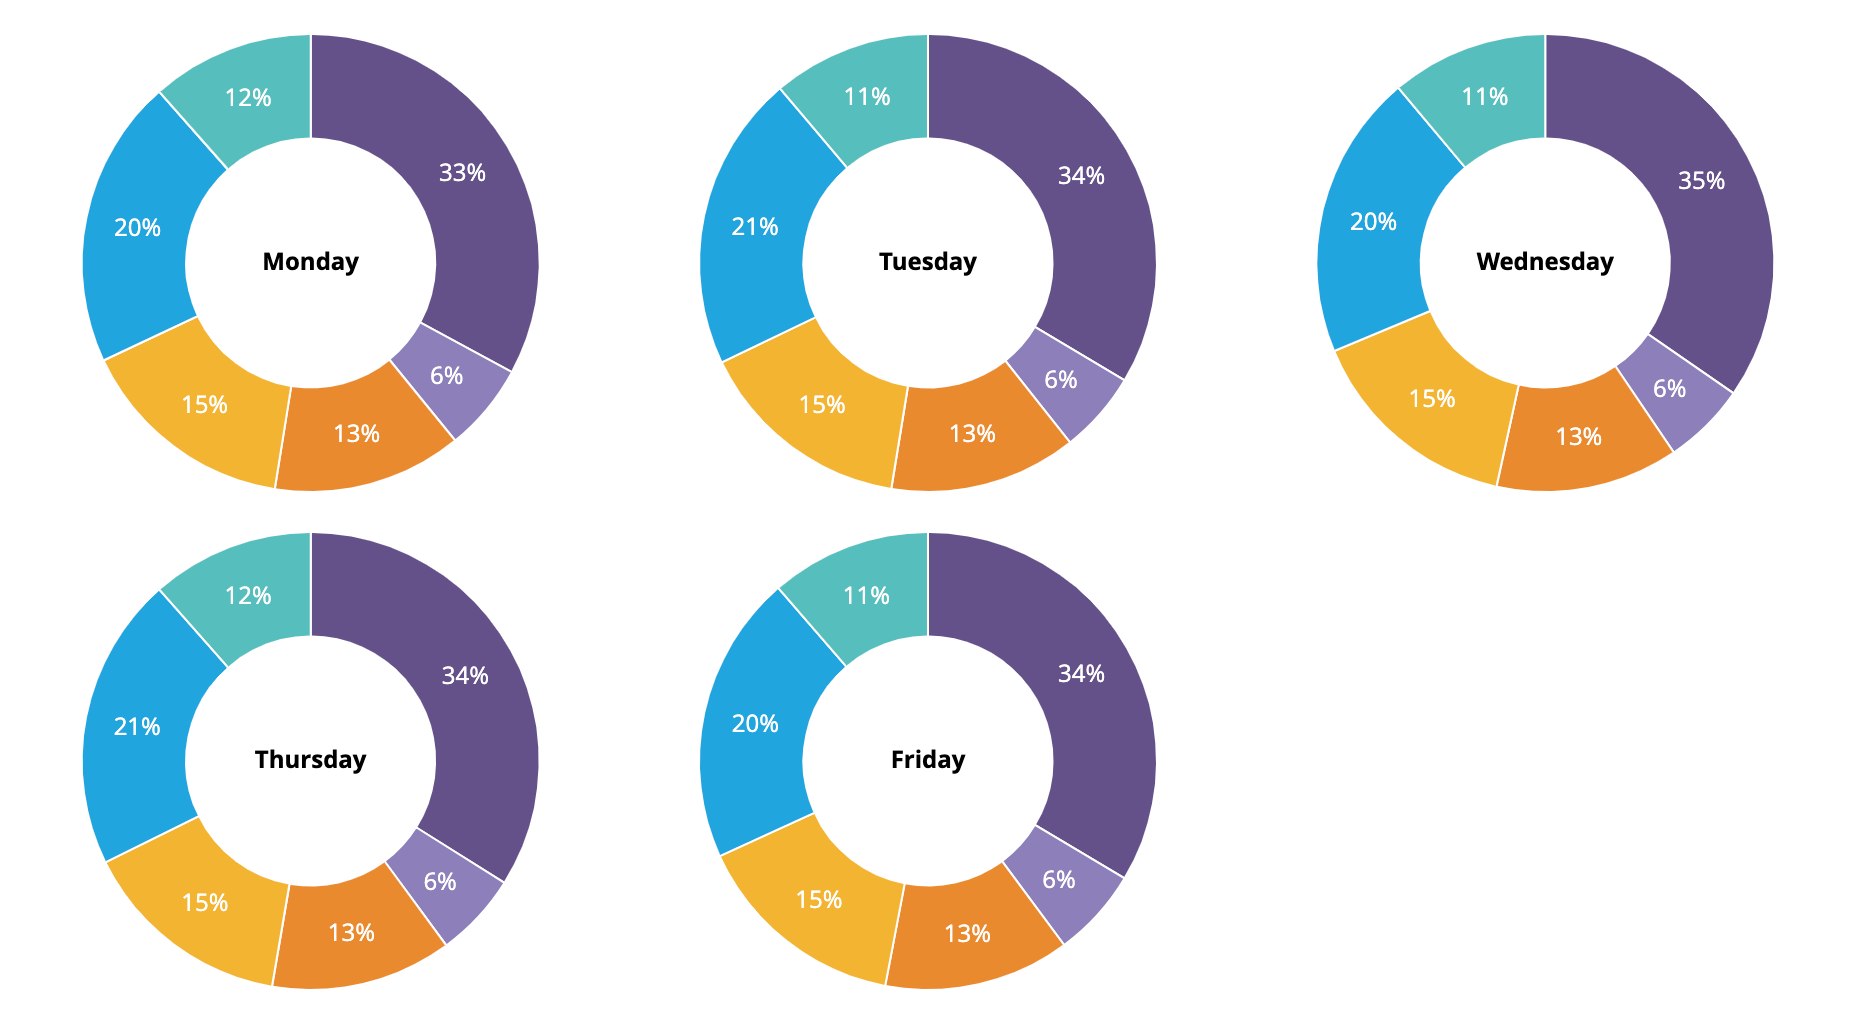 Elements of
 type: looker_donut_multiples require one regular dimension, one pivoted dimension, and one measure. Each value of the regular dimension defines the donuts, and each value of the pivoted dimension defines the slices.
|
 Elements of
 type: looker_funnel are composed from a single set of numbers and a single set of labels, defined using the dimensions and measures parameters.
|
 To create an element of
 type: looker_timeline, your query must include values for the dimensions and measures parameters, including at least one dimension representing the label field, such as a name, as well as a start field and an end field, which can be a date or number. See the Timeline chart options documentation page for more information about the minimum requirements for creating timeline charts in Looker.
|
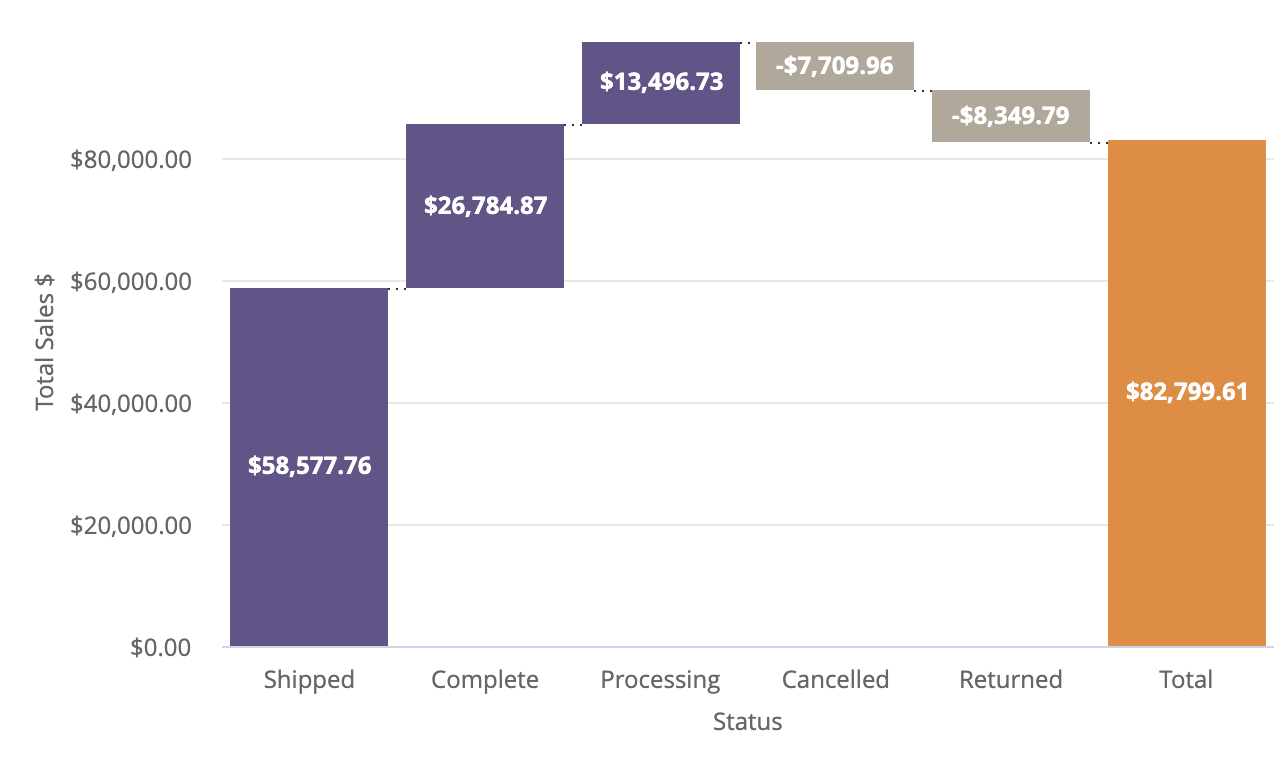 Elements of
 type: looker_waterfall require either one dimension and one measure or no dimensions and one or more measures.
|
 Elements of
 type: text display static text elements with various text sizes.
|
 Elements of
 type: single_value display a single measure or dimension. If the query returns more than one cell, the first measure displays; if there are no measures, the first dimension displays.
|
 Elements of
 type: looker_single_record accept any number of dimensions and measures. Pivots are not supported. If the query returns multiple rows, only the first one is shown.
|
 Elements of
 type: table accept any number of dimensions, pivots, and measures.
|
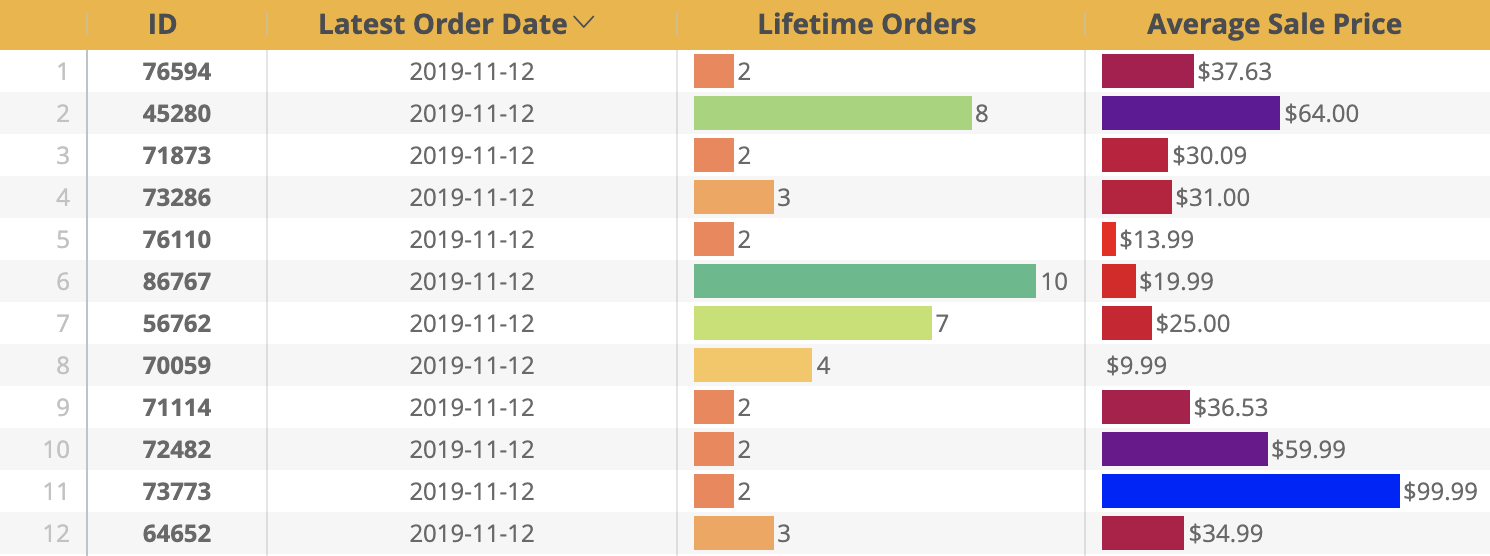 Elements of
 type: looker_grid accept any number of dimensions, pivots, and measures.
|
 Elements of
 type: looker_map are useful for visualizing geographic data on responsive and interactive maps. A looker_map element requires at least one dimension that is of type: location or type: zipcode, or that has a map layer associated with it.
|
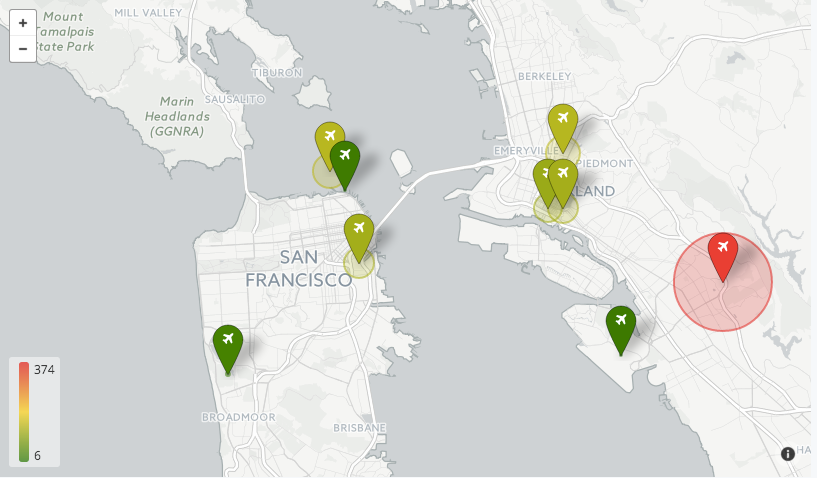
 Elements of
 type: looker_geo_coordinates are useful for plotting data that is represented by points. To plot regions, use looker_geo_choropleth. Coordinates maps plot a single measure and a single dimension of type: location or type: zipcode. Additional dimensions will show in the tooltip when you hold the pointer over the data point.
|
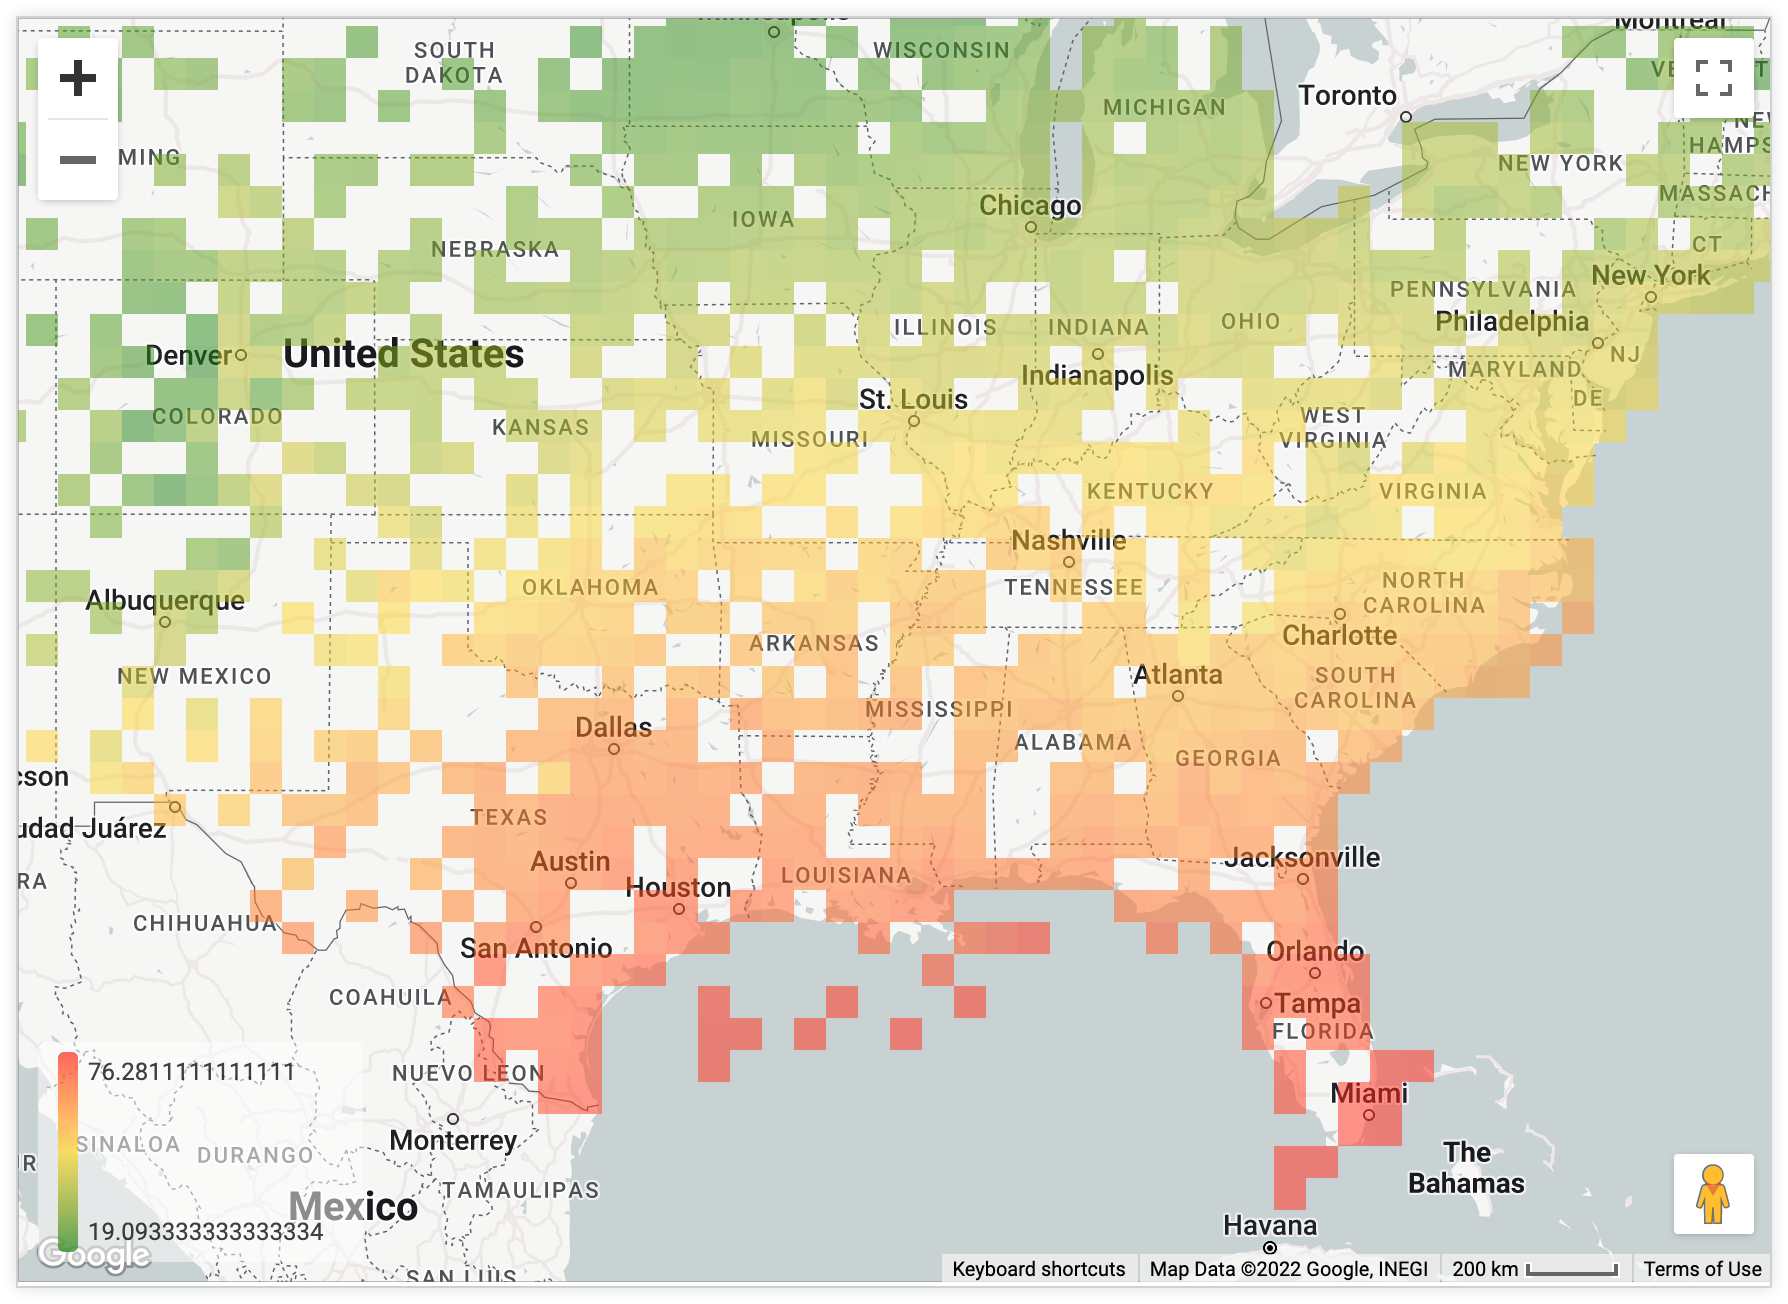
 Elements of
 type: looker_geo_choropleth are useful for plotting data that is represented by regions. To plot individual points, use looker_geo_coordinates. Choropleth maps plot a single measure and a single dimension of type: string, which contains either a US state (map: usa) or an ISO 3166-1 alpha-3 country code (map: world). Additional dimensions will show in the tooltip when you hold the pointer over the data point.
|
 Elements of
 type: looker_google_map are useful for plotting geographic data on responsive and interactive maps. A looker_google_map element requires at least one dimension that is of type: location or type: zipcode, or that has a map layer associated with it. Google Map charts are supported only by LookML dashboards with preferred_viewer set to dashboards-next.
|
 Elements of
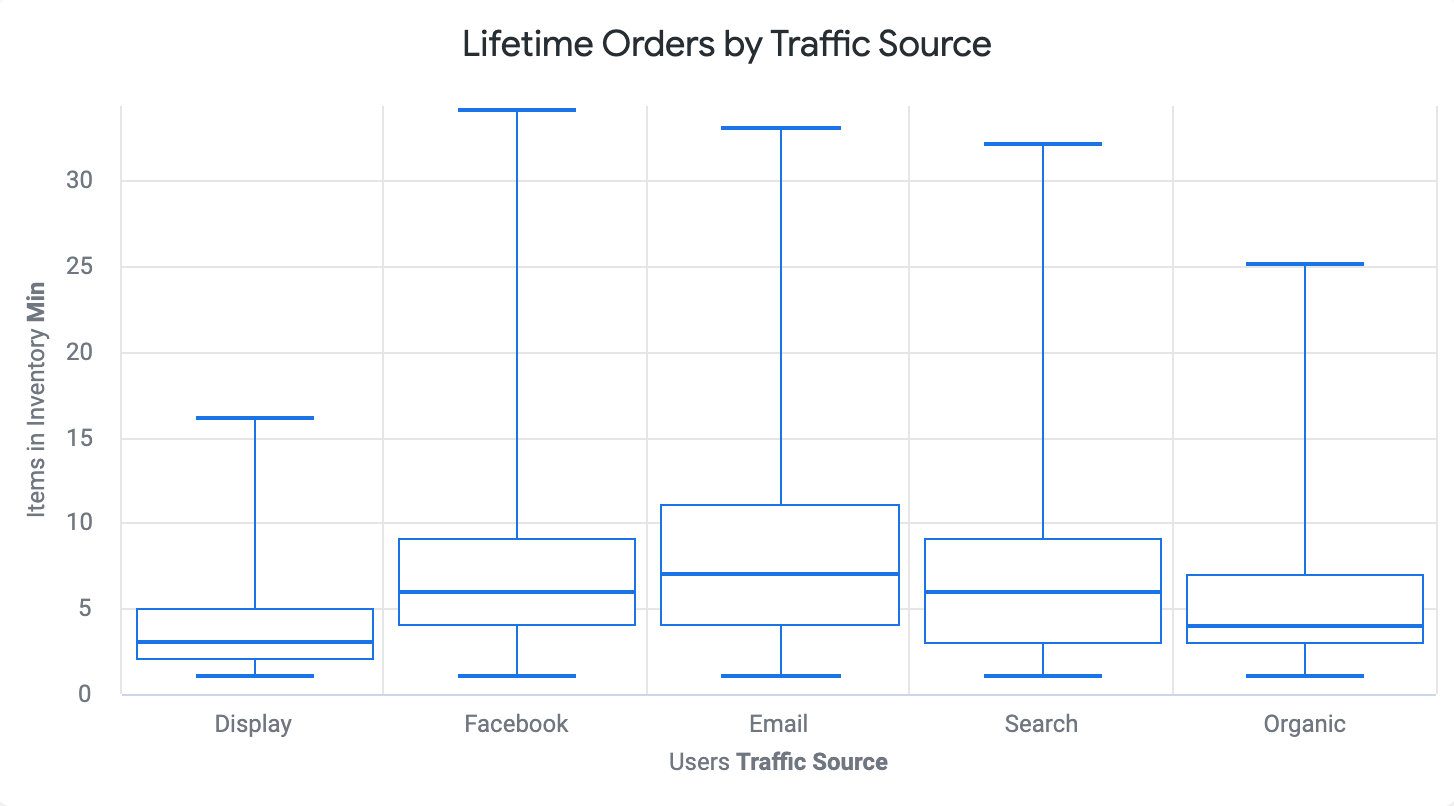
 type: looker_boxplot are useful for visualizing the distribution and spread of values in your dataset. They can be especially useful for comparing values across categories. Boxplot elements require at least one dimension, along with either two, three, or five measures.
|
 Elements of
 type: button are useful for placing links within your dashboards. You can link to Looker content, such as Looks and dashboards, or to other websites. Buttons are supported only by LookML dashboards with preferred_viewer set to dashboards-next.
|