這個範例會轉譯應用程式開發作業的本機自訂圖表,而不是 Looker Marketplace 提供的自訂圖表。
Looker 視覺化元件具有轉接器系統,可讓開發人員覆寫現有圖表類型,或新增完全不同的圖表類型選項。
在下列情況中,這個選項會相當實用:
- 您已建構自訂 React 視覺化效果,並想搭配 Looker 元件使用。
- 您想將現有的預設 Looker 視覺化效果,換成以其他程式庫建構的視覺化效果。
如果您要建構的應用程式允許使用者在工作階段期間變更圖表視覺化類型,覆寫或新增圖表的功能就特別實用。
背景
在 Looker 的「探索」介面中算繪查詢,並將其 Query.client_id 傳遞至 Looker 的視覺化元件後,您就可以更新 config 屬性的 type 屬性,修改圖表類型。
type 屬性接受的每個值都會對應至特定 React 元件。因此,當 type 設為 line 時,系統會算繪 Line 元件;當 type 設為 area 時,系統會算繪 Area 元件,依此類推。
Visualization 元件的 chartTypeMap 屬性可讓您在類型/元件對應中新增項目,或取代現有項目,將每個 type 值與特定元件建立關聯。
需求條件
您必須先匯入 DataProvider 元件,並提供已驗證的 SDK 執行個體。以下範例是在 Looker 的擴充功能架構中建構,而 SDK 來自 ExtensionContext。
在 DataProvider 中,您可以算繪 Query 和 Visualization 元件,向 Looker SDK 要求資料,並在應用程式中算繪預期視覺化效果。
設定如下 (在 query 屬性中,將值替換為查詢中的 Query.client_id):
import React, { useContext } from 'react'
import { ExtensionContext } from '@looker/extension-sdk-react'
import { DataProvider } from '@looker/components-data'
import { Query, Visualization } from '@looker/visualizations'

const App = () => {
    const { core40SDK } = useContext(ExtensionContext)
    return (
        <DataProvider sdk={core40SDK}>
            <Query query="z8klgi4PJKAl7TXgTw1opS">
                <Visualization />
            </Query>
        </DataProvider>
    )
}
新增圖表類型
您可以將設定覆寫傳遞至 Query 元件,藉此修改算繪的圖表類型。
<Query query="z8klgi4PJKAl7TXgTw1opS" config={{ type: 'pie' }}>
    <Visualization />
</Query>
在本例中,type 已設為 pie,這是 Looker 元件預設提供的圖表。不過,如果想使用預設未提供的圖表,該怎麼做?在這種情況下,您可以使用 Visualization 的 chartTypeMap 屬性,在轉接器系統的型別/元件對應中新增或取代圖表元件。
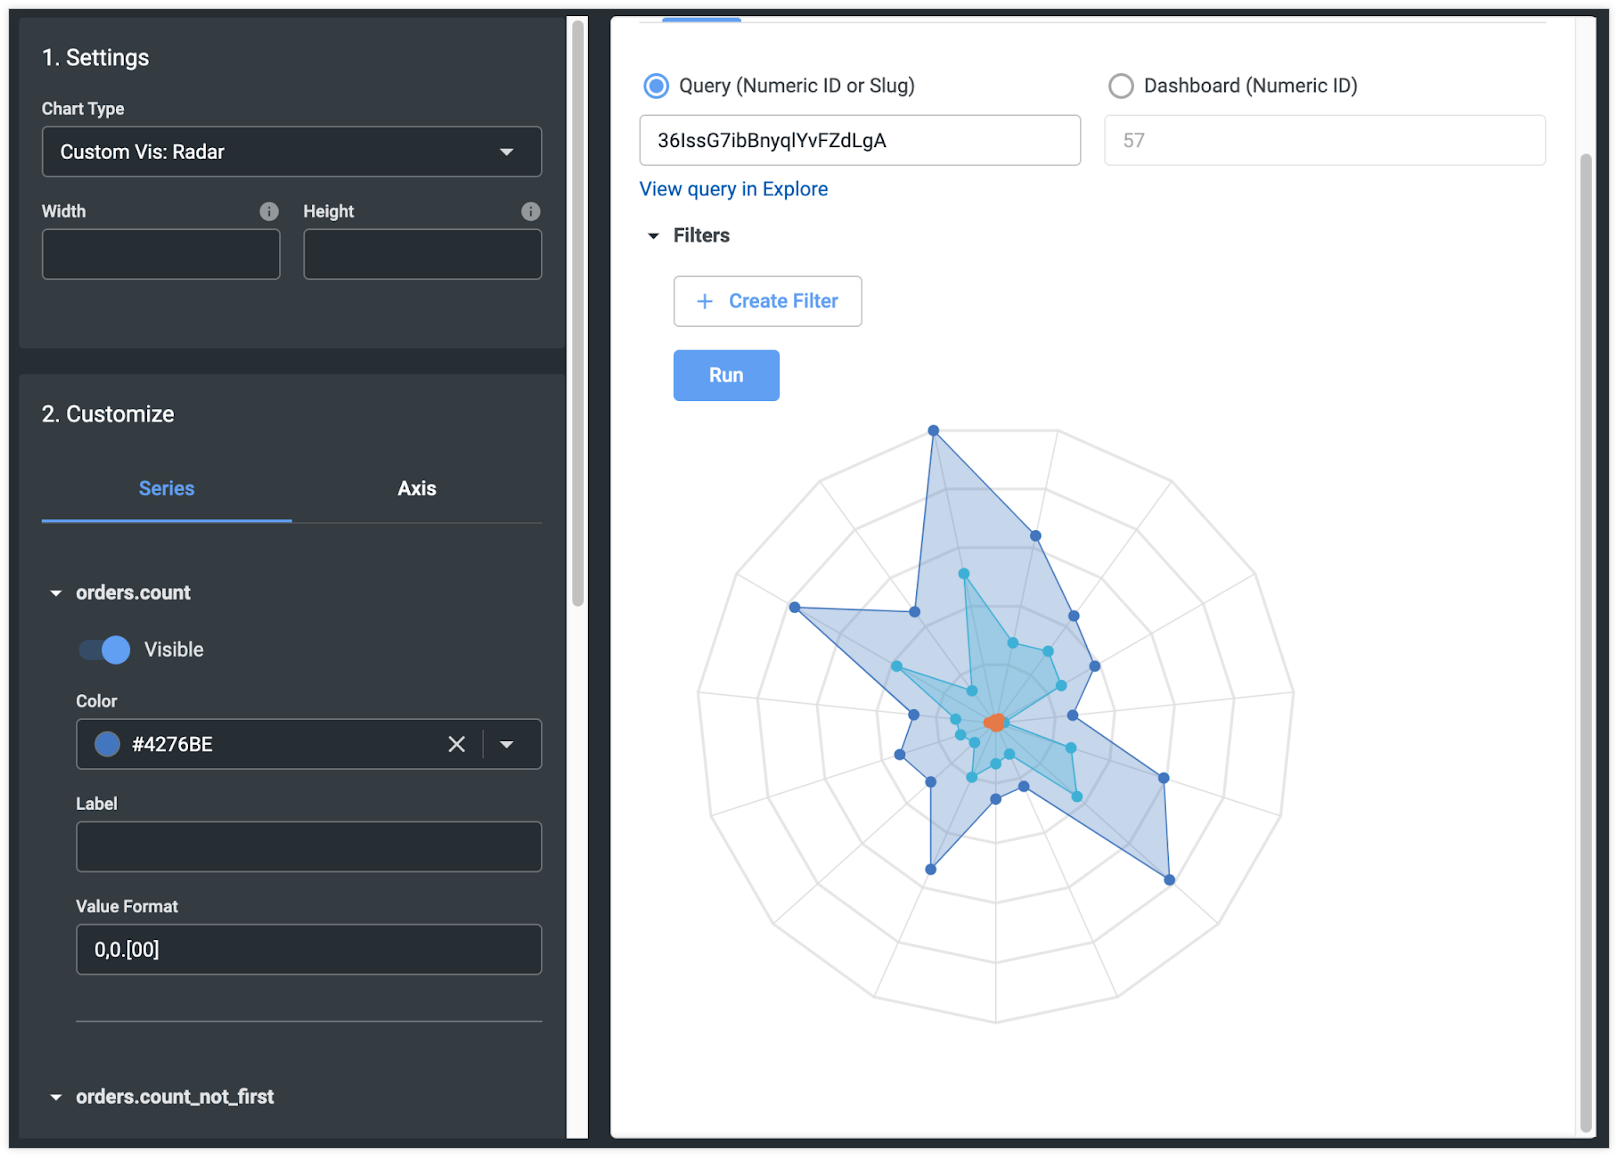
舉例來說,如要在型別/元件對應中新增雷達圖,請將其新增至 chartTypeMap,如下所示:
import React, { useContext } from 'react'
import { ExtensionContext } from '@looker/extension-sdk-react'
import { DataProvider } from '@looker/components-data'
import { Query, Visualization } from '@looker/visualizations'
import { MyCustomRadar } from '../MyCustomRadar'

const App = () => {
    const { core40SDK } = useContext(ExtensionContext)
    return (
        <DataProvider sdk={core40SDK}>
            <Query query="z8klgi4PJKAl7TXgTw1opS" config={{ type: 'radar'}}>
                <Visualization chartTypeMap={{ radar: MyCustomRadar }} />
            </Query>
        </DataProvider>
    )
}
這段程式碼會執行下列動作:
- 匯入
MyCustomRadarReact 元件 - 將
radar鍵指派給config.type屬性 - 更新
chartTypeMap屬性,讓型別對應系統知道要為radar的type算繪內容
在 Looker 視覺化遊樂場中,系統會這樣算繪:
同樣地,如要自行算繪圖表,可以取代現有圖表。在下列範例中,預設 Looker 元件的折線圖會遭到自訂折線圖元件覆寫:
import React, { useContext } from 'react'
import { ExtensionContext } from '@looker/extension-sdk-react'
import { DataProvider } from '@looker/components-data'
import { Query, Visualization } from '@looker/visualizations'
import { MyCustomLine } from '../MyCustomLine'

const App = () => {
    const { core40SDK } = useContext(ExtensionContext)
    return (
        <DataProvider sdk={core40SDK}>
            <Query query="z8klgi4PJKAl7TXgTw1opS">
                <Visualization chartTypeMap={{ line: MyCustomLine }} />
            </Query>
        </DataProvider>
    )
}
現在,每當 Query 元件遇到視覺化類型設為 line 的查詢時,就會轉譯自訂實作項目,取代 Looker 預設值。