With Looker embedded analytics, Looker developers can display Looks, Explores, query visualizations, and dashboards in any HTML-formatted web page, portal, or application. You might encounter this embedded content on a public website or behind a login.
Depending on the permissions that your Looker admin has assigned and the type of content that you are viewing, an embedded Look or dashboard may have options that let you interact with your data in various ways.
Viewing embedded Looks or Explores
The following options may appear at the top right of an embedded Look or Explore, depending on the permissions and content access that you have been given:

- The Time Zone drop-down lets you change the time zone in which you view time-based data.
- The Run button lets you run or re-run the query. This is often useful after you make a change to the Look or Explore, such as selecting a different time zone. In those circumstances, the icon turns blue.
- The Explore actions gear menu shows options that let you do things such as:
- Send or schedule a delivery of your data.
- Download your data.
- Edit the Look.
- Further explore your data.
- Save the Explore to a dashboard or as a Look.
- Merge results from a different Explore with your current Look to create results that include both data sources.
- Force new results to be retrieved from the database and reload the Look or Explore results.
- The folder icon lets you view the folders that you have access to, along with the Looks and dashboards that they contain.
Viewing embedded dashboards
If your Looker administrator has enabled Dashboard Embed Content Navigation, the following icons may appear at the top right of an embedded dashboard, depending on the permissions and content access that you have been given:
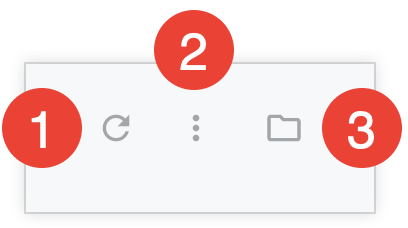
- Clicking the circular Reload icon updates the data on the dashboard. Clicking this icon is often useful after filters have been changed, added, or removed. In those circumstances, the icon is encircled by a blue halo.
- The three-dot Dashboard actions menu shows availableoptions such as editing the dashboard, downloading your data, sending or scheduling a delivery of your data, temporarily changing the dashboard time zone, or moving the dashboard to the Trash folder.
- The Open Folders icon lets you view the folders and the Looks and dashboards that they contain and that you have permission to view.
Looker may also display icons at the top right of each dashboard tile.
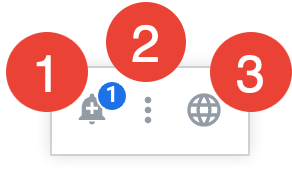
- The bell-shaped Alerts icon lets you create or follow an alert on the tile. A numeric indicator will show how many alerts you are permitted to view on that tile.
- The three-dot Tile actions icon lets you interact with the data specific to that tile, so you can further explore the tile's data, download the tile's data, or, in some cases, view the Look that was the source of the tile.
- A globe Results are in <time zone> time zone icon appears if the tile has a different time zone than the default dashboard time zone and your default time zone. This can only happen when your Looker admin has enabled User Specific Time Zones and the dashboard time zone is set to Each tile's timezone. Hover over the globe icon to see the time zone the tile is using.
If the embedded dashboard is in edit mode see the Editing user-defined dashboards documentation page for options. However, some editing options may not be available in the embed environment.
Viewing embedded query visualizations
When viewing an embedded query visualization, Looker only displays the visualization.
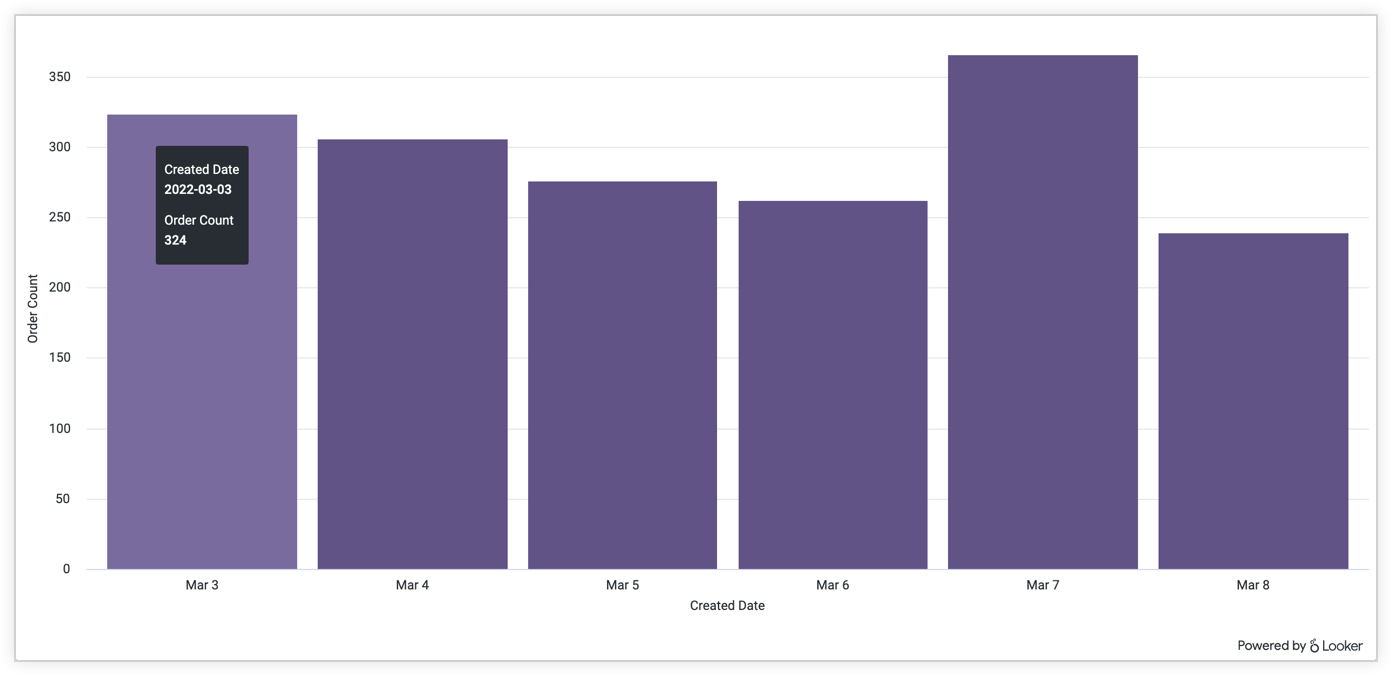
You may be able to hover over elements in the visualization to view details, but you won't be able to interact in other ways with your data, such as further exploring or downloading your data.
Using embedded folders to find Looks and dashboards
In Looker, folders are used to store and organize your Looks and dashboards.
Viewing folders on embedded Looks, Explores and dashboards
Depending on your permissions and, in the case of embedded dashboards, whether your Looker admin has enabled Dashboard Embed Content Navigation, you may see the folders icon (  ). Click the icon to view any folders, along with the Looks and dashboards they contain, that you have permission to view:

- The Favorites folder shows a list of Looks or dashboards that you've marked as favorites.
- The My Folder folder shows your personal folder, where you can store Looks or dashboards that only you can access.
- If your Looker admin has added you to an external group of users, you will see the Group folder. Here you can view and store content that your entire group can access.
- The Shared folder shows Looks and dashboards that are available to anyone who has access to the Shared folder on your Looker instance.
To view any content, click the name of the Look or dashboard.
In addition to Looks and dashboards, Looker may display subfolders in your folders.
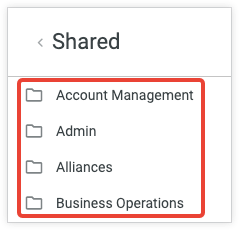
Click a subfolder to navigate to it and view any content or additional subfolders stored there.
Copying, moving, and deleting content on embedded dashboards
If your Looker administrator has enabled Embed Content Management and you have been granted the necessary permissions, you can copy or move dashboards and Looks into different folders, or you can delete a dashboard or Look by moving it into the Trash folder.
Navigate to the folder that contains the dashboard or Look you want to copy, and then click the three-dot menu next to the content and select Make a copy.
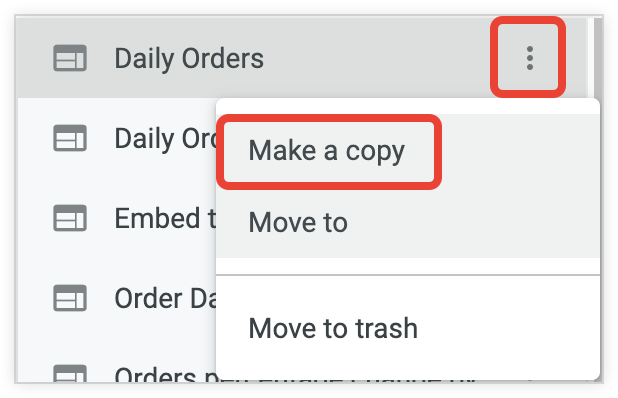
Looker displays a message indicating that you are copying the selected content and the option to Copy Here.
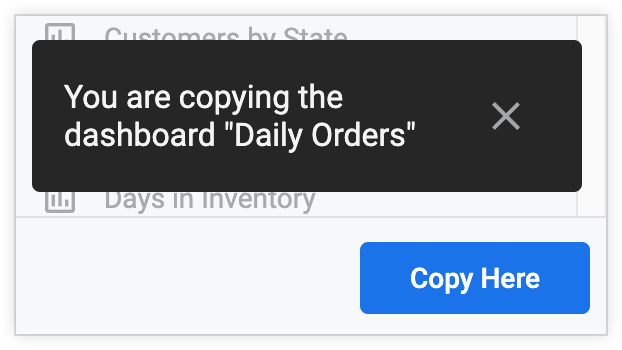
If you want to store the copy of the selected content in the same folder as the original, click Copy Here.
If you want to create a copy of the content in a different folder, navigate to the folder where you want to store the copy of the content you selected, and then click Copy Here.
You'll see a copy of the selected content appear, using the name of the original content and the text
(copy)appended to the content name. There is not an option to rename the copied content from within an embedded dashboard.
Navigate to the folder that contains the dashboard or Look that you want to copy, and then click the three-dot menu next to the content and select Move to.
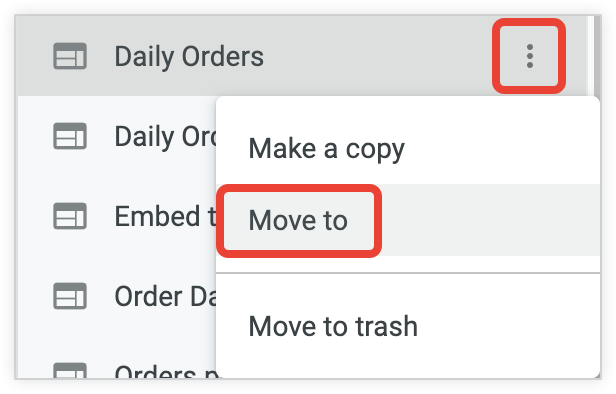
Looker displays a message indicating that you are moving the selected content.

Navigate to the new folder where you want to store the content you selected, and then click Move to.
You'll see the selected content appear in the new folder.
Navigate to the folder that contains the dashboard or Look that you want to delete, and then click the three-dot menu next to the content and select Move to trash.
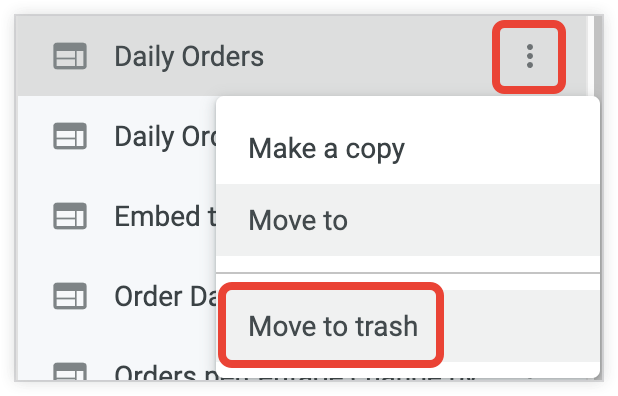
You will be asked to confirm whether you want to move this content to the trash.
On the confirmation screen, click Move to trash.
Interacting with an embedded Look, Explore, or dashboard
The Look, Explore, or dashboard menu and the three-dot icon on dashboard tiles give you a number of options for modifying and interacting with your Look, Explore, or dashboard. You might see all, some, or none of these options, depending on the permissions your Looker admin has assigned and your access to the content you are viewing. These options include the following:
- Explore from Here: Use the Look (using the Look's gear menu) or a dashboard tile (using the tile's three-dot icon) as a starting point to further explore your data. See the Viewing and interacting with Explores in Looker and Editing user-defined dashboards documentation pages for more information.
- Edit: Change the field selections, filters, visualization options, and other attributes of a Look. For more information about editing a Look, see the Saving and editing Looks documentation page.
- Save > Save As: Save a copy of a Look to your personal folder or any other folder to which you have access. For more information, see the Saving and editing Looks documentation page.
- Save > As a Look: Save an Explore as a Look to your personal folder, or, if you are a member of an external group, to the Group folder or any other shared folder to which you have access.
- Save > To existing dashboard: Save a Look as a dashboard tile, either on an existing dashboard or on a new dashboard that contains the Look as its initial tile. For more information, see the Creating user-defined dashboards documentation page.
- Download: In the case of a Look, an Explore, or a dashboard tile, download your data in one of a variety of formats. When viewing a dashboard, you are given the option to Download as PDF, which downloads the entire dashboard in PDF format, or Download as CSVs, which downloads the data in each tile as a separate CSV file. For more information, see the Downloading content and Viewing dashboards documentation pages.
- Send or Schedule: Deliver immediate or recurring deliveries of your content to an email address or one of several other destinations in one of several formats. For more information, see the Using the Looker Scheduler to deliver content documentation page.
- Merge Results: Combine data from a different Explore with your current Look to create results that include both data sources. For more information, see the Merging results from different Explores documentation page.
- Clear Cache and Refresh: Refresh the data in your Look, Explore, dashboard, or dashboard tile to ensure that you are viewing the most current results.
- Move to Trash: Delete the Look or dashboard from your folder. For more information, see the Organizing and managing access to content documentation page.
- Dashboard Time Zone: View and edit the dashboard time zone. For more information, see the Viewing dashboards documentation page.
