Studio in Looker lets you create, view, and edit Looker Studio reports in your Looker instance, including both governed and ad hoc data. You can share and manage your reports in Looker folders and see your recent reports and the reports that you have marked as favorites from the Looker Home page.
Before you begin
To use Studio in Looker, your Looker instance must meet all requirements for Studio in Looker, and your Looker admin must enable Studio in Looker.
Accessing Studio in Looker
There are three different ways to access Looker Studio:
- From the Looker main navigation panel
- From an Explore page
- From a previously created or shared report
From the Looker main navigation panel
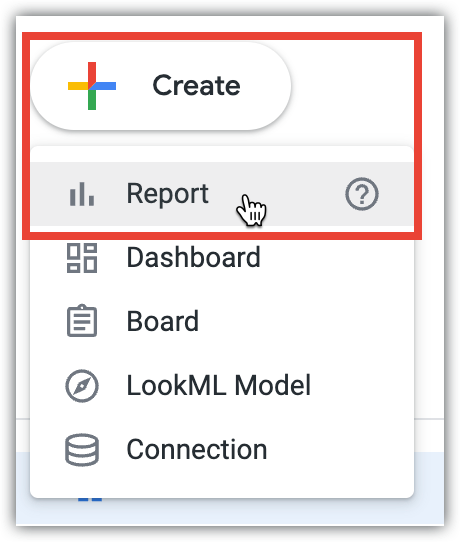
In the Looker main navigation panel, click the Create button, and then select the Report menu item to open the Looker Studio report editor tool, where you can create a new Looker Studio report.
From an Explore page
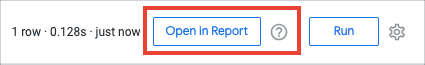
From a Looker Explore page, click the Open in Report button to open the Looker Studio report editor tool, using the model, view, and fields selected in the Looker Explore.
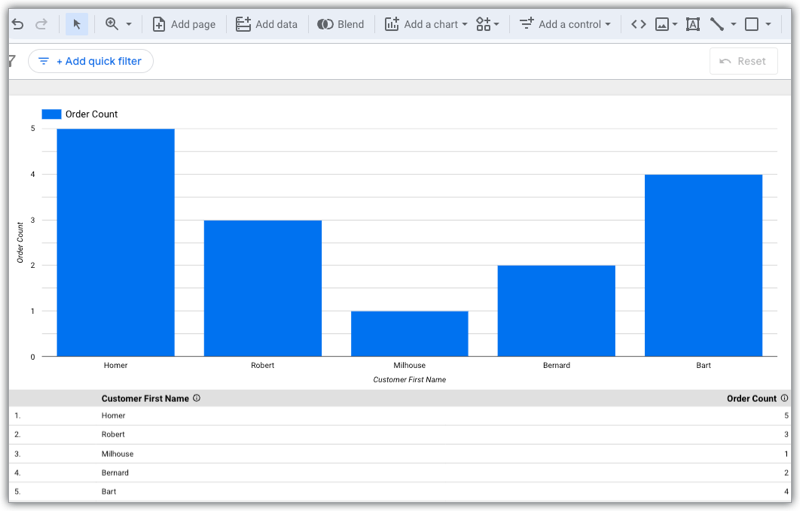
Looker visualization types that are supported in a Looker Studio report include table charts, column charts, bar charts, scatterplot charts, line charts, area charts, pie charts, and funnel charts
A report that was created from a Looker Explore will have the following limitations:
Visualizations that include hidden values will not include the hidden values in the report.
Hidden fields will not appear in the report.
Values that were created by using dimension fill will not appear in the report.
Custom expressions will not appear in the report.
Looker Explores that contain only dimensions will be displayed as a table chart in the report.
Explores will not be sorted as expected in reports if the following apply:
- Explores are sorted by fields that do not appear in the visualization.
- Explores are sorted by multiple columns.
Explores that are pivoted on more than one dimension will display only one pivoted dimension in the report.
Looker scatterplot charts will be displayed as a line chart in the report.
Filters that are created in the Explore UI won't carry over into the report.
From a previously created or shared report
If you have previously created any Studio in Looker reports, or if another user has shared a report with you, you will see the report in the folder where it was saved, under the Reports section.
For more information about saving, moving, copying, and sharing Studio in Looker reports, see the Move, share, and copy reports documentation page.
Using Studio in Looker
Studio in Looker has most of the features of Looker Studio. This section presents a list of links for common tasks that will take you to the Looker Studio documentation for those tasks.
Before you can get started creating or editing reports, you may need to use the Looker Connector to connect to a Looker Explore.
The following is a list of Looker Studio Help pages for common tasks.
- View the Looker Studio Quick start guide
- View a typical Looker Studio workflow
- Create a report
- Edit a report
- Add data to a report
- Add charts and controls to a report
- Rename reports, data sources, explorations, and blends