LookML dashboards are created by LookML developers and stored as version-controlled files. By default, they appear in the LookML dashboards folder of your Looker instance.
To compare and contrast LookML dashboards and user-defined dashboards, see the Comparing user-defined and LookML dashboards documentation page.
To create a LookML dashboard, you must have the following Looker permissions:
Additionally, you must have access to the LookML models for any data you want to use in the dashboard.
Creating a LookML dashboard file
To build a LookML dashboard, begin by creating a dashboard file, which has the extension .dashboard.lookml (although the .lookml portion of the extension is silent within the IDE). The steps to do so are as follows:
- Turn on Development Mode.
- In the Develop menu, navigate to your project.
- Select the Add file or folder plus icon at the top of the file browser panel in the Looker IDE to create a LookML dashboard file outside of existing project folders. Or, click a folder's three-dot Folder Options menu to create the file inside the folder. Click Create Dashboard to create the dashboard file.

- A Create File window will appear. Within the window, name the dashboard file in the write-in field and select the Create button.
Editing LookML dashboard files
When you create a LookML dashboard file, Looker pre-populates the file with several basic dashboard parameters, which implement settings for the entire dashboard. It also pre-populates the file with several sample dashboard element parameters, which are grouped under the elements dashboard parameter, and which define the function and appearance of dashboard tiles, text, and buttons. A newly created .dashboard.lookml file contains dashboard LookML similar to this:
- dashboard: order_analysis
  title: Order Analysis
  layout: newspaper
  preferred_viewer: dashboards-next
  tile_size: 100

  filters:

  elements:
    - name: hello_world
      type: looker_column
You can edit the dashboard file within the IDE as long as you are in Development Mode.
You have several options for building your dashboard:
- Manual creation: You can manually build a dashboard by using dashboard parameters and dashboard element parameters.
- Copy a user-defined dashboard: You can create a copy of a user-defined dashboard by deleting the pre-populated dashboard LookML from the file, copying the dashboard LookML from a user-defined dashboard, and pasting it into your dashboard file.
- Copy dashboard LookML of elements: You can copy the dashboard LookML from an Explore or a Look and paste it into your dashboard file.
When you're creating a dashboard, keep in mind best practices for dashboard construction. Find information and recommendations about building performant dashboards in the Considerations when building performant Looker dashboards Best Practices page.
Adding a visualization to an existing LookML dashboard
The easiest way to add a visualization to an existing LookML dashboard is to use the Explore page to build a query that you want to turn into a dashboard element:
- Once you have created the query and visualization that you want to add to a dashboard, click the Explore's Explore actions gear menu.
Select Get LookML to expose the LookML.

A Get LookML window appears. With Dashboard selected in the window, select all the LookML and copy it.
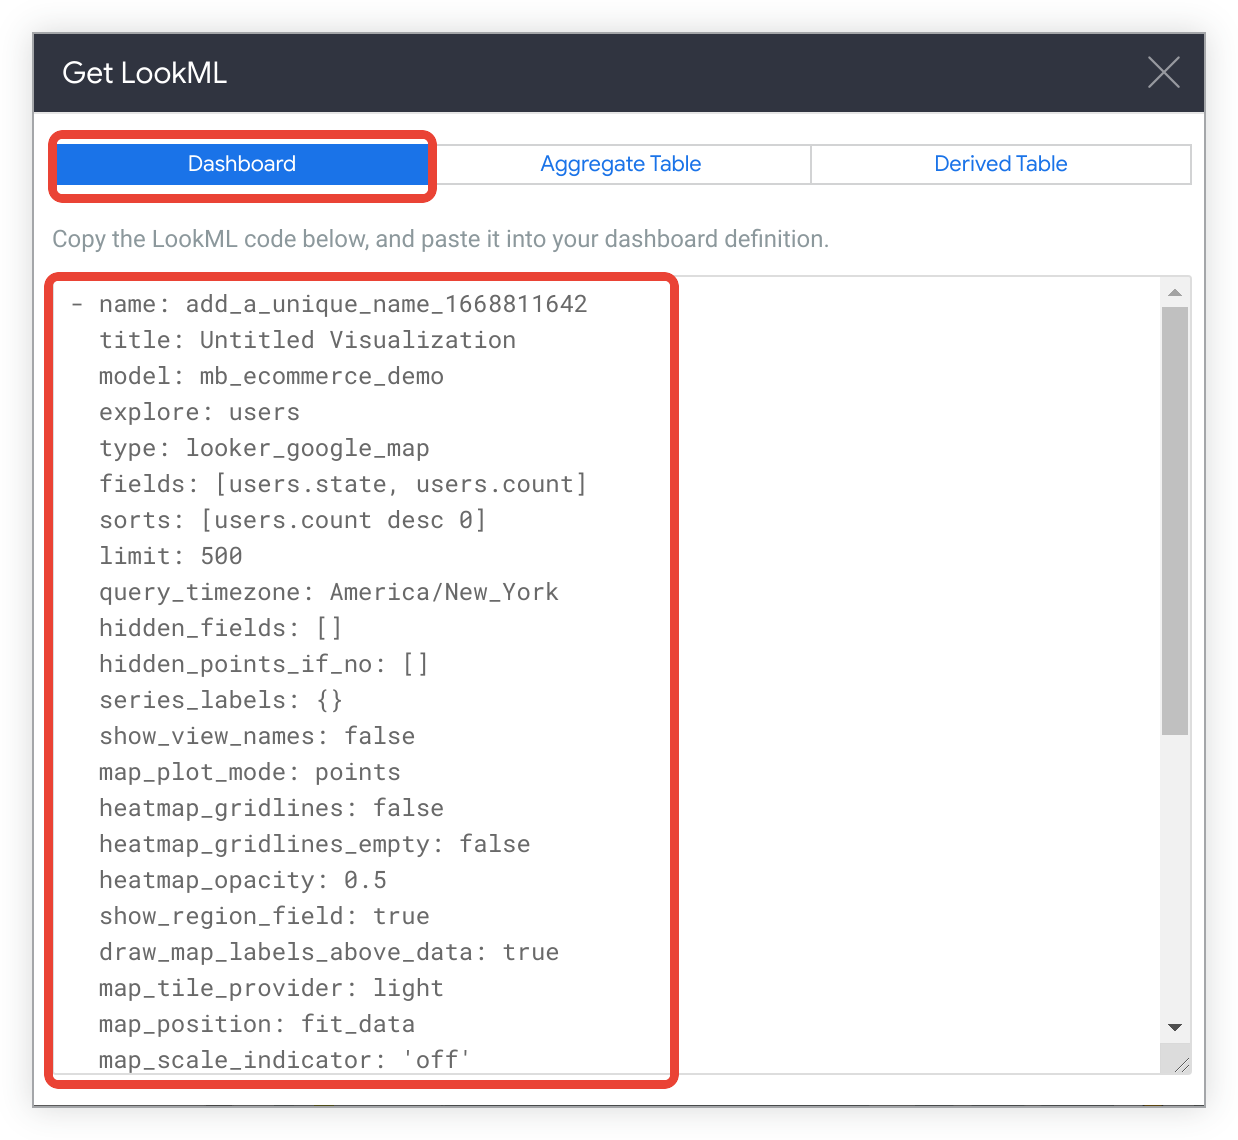
From here, paste the LookML into your dashboard LookML file. When editing the dashboard LookML file, be sure to:
- Verify that you are in Development Mode so that you can edit the dashboard file.
- Paste the LookML under the dashboard's
elementsparameter. - Use the correct indentation when pasting LookML into the dashboard file. If possible, match the indentation to existing elements already in the dashboard file.
You can adjust the LookML parameters if desired, using the parameters described on the documentation pages for each individual element type.
Adding filters
Once you have dashboard elements saved in your dashboard file, you may want to add filters, which let dashboard viewers filter some or all elements on a dashboard. Filters can be useful for many possible reasons, for example:
- Adjusting the time period shown
- Adjusting the specific product category, customer type, etc being shown
- Providing a "lookup" type capability for a client or customer
Be sure to build the type of filter you want. The two types are:
- Filters that you hard-code into the dashboard elements, which dashboard viewers cannot change
- Dashboard filters, which dashboard viewers can change
Filters hard-coded into dashboard elements
Filters that you hard-code into the dashboard elements, which users cannot change, usually get created automatically in the copy LookML step for a visualization or for a dashboard. In a LookML dashboard, those filters use the filters dashboard element parameter and look like this:
- name: element_name
  # lots of other element parameters here
  filters:
    dimension_or_measure_name: 'looker filter expression'
Dashboard filters
Dashboard filters let viewers interactively refine the data that is shown in dashboard elements. To create a dashboard filter, follow these steps:
- Create the dashboard filter by using the
filtersparameter within your LookML dashboard file. - Apply the filter to individual dashboard elements by using the
listenparameter.
Creating a dashboard filter
The filters parameter lets you create various types of interactive filters for your dashboard.
To create a dashboard filter that users can interact with, add a filters parameter to your dashboard file. For example, the following sample code creates a LookML dashboard that has the filters date and category_name:
- dashboard: dashboard_name
  title: Dashboard Title
  layout: newspaper
  filters:
  - name: date
    title: 'Date Range'
    type: date_filter
    default_value: 30 days

  - name: category_name
    type: field_filter
    model: ecommerce
    explore: product
    field: category.name
The code in the previous example creates the following filters:
date: A date filter that lets users select a date range. The default value is set to the last 30 days.category_name: A field filter that lets users filter by product category. This filter dynamically generates options that are based on thecategory.namefield within the specified LookML model (ecommerce) and Explore (product).
Applying a dashboard filter to dashboard elements
Once you've created a dashboard filter, you can apply that filter to individual dashboard elements by using the listen parameter. Using the listen parameter in this way allows the linked elements to be dynamically updated based on the user's selection in the filter.
For example, consider the following sample LookML code for an area chart element:
- name: approved_orders_by_day
  type: looker_area
  model: ecommerce
  explore: orders
  dimensions: [orders.created_date]
  measures: [orders.count]
  filters:
    orders.status: 'approved'
The approved_orders_by_day chart displays the count of approved orders by day, as the query is based on the orders_created_date dimension and the orders.count measure and has a filter applied, orders.status: 'approved'. This filter is fixed within the element and cannot be modified by dashboard viewers.
To let users filter the approved_orders_by_day chart by using the date filter and the category_name filter from the previous example, add the listen parameter to the dashboard element.
- name: approved_orders_by_day
  type: looker_area
  model: ecommerce
  explore: orders
  dimensions: [orders.created_date]
  measures: [orders.count]
  filters:
    orders.status: 'approved'
  listen:
    category_name: category.name
    date: orders.created_date
When a dashboard viewer interacts with the category_name filter or the date filter, the approved_orders_by_day chart will be automatically updated to reflect the filtered results.
The listen parameter uses the syntax filter_name: field_name. In the previous example, the category_name and date are the names of filters, and category.name and orders.created_date are the fields that will be used to let dashboard viewers provide input to the filter.
A dashboard filter can be applied to any field (of the same data type) in any given element. For example, one element can apply a user's input to the order created date (date: orders.created_date), while another applies it to the order ship date (date: orders.ship_date):
- name: element_one
  # lots of other element parameters here
  listen:
    date: orders.created_date

- name: element_two
  # lots of other element parameters here
  listen:
    date: orders.ship_date
Including the dashboard file in a model
For your dashboard to be visible to preview in Development Mode or visible in production, it must be included in the model file on which the dashboard is based by using an include statement.
A common practice is to include all LookML dashboards in a model by using a wildcard:
include: "*.dashboard.lookml"
or, if your LookML dashboards appear within a folder in the IDE, use the path to their location
include: "/path/*.dashboard.lookml"
You can also include a specific dashboard by specifying its filename:
include: "my_dashboard.dashboard.lookml"
Saving, previewing, and publishing the LookML dashboard
To preview the dashboard:
- Save the
.dashboard.lookmlfile, by clicking the Save Changes button at the top right corner of the file. - Include the dashboard in the relevant model file and save the changes to that file.
- In the
.dashboard.lookmlfile you wish to preview, click the downward arrow See file actions icon and select View Dashboard.

You can make further changes to your .dashboard.lookml file, save them, and preview the dashboard again.
Once you are happy with your dashboard, you can publish it to production, which allows other users with the correct permissions to see it. The method for publishing the dashboard is the same as publishing other changes to LookML on your instance, and depends on the version control settings for your Looker instance.
LookML dashboards folder
Once published, LookML dashboards are saved in the LookML dashboards folder by default. The LookML dashboards folder is located in the Folders folder in the left navigation. The LookML dashboards folder is unique from other folders in a few ways:
- You must include a LookML dashboard in at least one model file for it to appear in the LookML dashboards folder.
- To see the LookML dashboards folder, users must have the
see_lookml_dashboardspermission. - To see dashboards within the LookML dashboards folder, users must have access to the LookML model that includes the dashboard.
- To see any given tile within a LookML dashboard, dashboard viewers must have access to the LookML model that the tile is based on.
- To edit a dashboard in the LookML dashboards folder, you must have the
developpermission on the model that includes the LookML dashboard. - To Explore from Here on any given tile within a dashboard, dashboard viewers must have the
explorepermission for the model that tile is based on. - You cannot create a folder inside the LookML dashboards folder.
Moving LookML dashboards outside of the LookML dashboards folder
If you have the see_lookml_dashboards and develop Looker permissions as well as access to the LookML model a LookML dashboard is included in, you can move a LookML dashboard into any folder for which you have the Manage Access, Edit folder access level.
There are two ways to move the dashboard:
- From the LookML dashboards folder, select the dashboard to move, click the Move button at the top of the dashboards section, and select the folder into which you wish to move the dashboard. See the Organizing and managing content documentation page for more information.
- From the LookML dashboards folder, click the three-dot menu for the dashboard, select Move from the menu, and select the folder into which you wish to move the dashboard.
If you're in Development Mode, you can't move LookML dashboards outside of the LookML dashboards folder. You can instead use the Import option to copy the LookML dashboard as a user-defined dashboard to another folder.
A folder that contains both user-defined dashboards and LookML dashboards displays the LookML dashboards in a LookML Dashboard section. From the LookML Dashboard section, you can move a LookML dashboard to another folder or pin a LookML dashboard to a board. However, unlike user-defined dashboards, LookML dashboards cannot be renamed or moved to the trash from a folder.
If the value of a LookML dashboard's dashboard parameter is changed, the LookML dashboard will automatically move back into the LookML dashboards folder.
Viewing the LookML for an existing LookML dashboard
If you have the see_lookml permission, you can navigate to the dashboard LookML for an existing LookML dashboard by selecting Go to LookML from a dashboard's three-dot Dashboard actions menu:

When you select Go to LookML, Looker navigates to the dashboard file in which the LookML dashboard is defined.
Extending a LookML dashboard
Once you've created a LookML dashboard, you can extend the dashboard. This lets you create a second dashboard based on the original one, possibly adding or overriding some settings. Then if you change the first dashboard, the second one inherits those changes automatically (unless overridden in the second dashboard). See the Reusing code with extends documentation page for more information.
Improving dashboard performance using aggregate awareness
LookML developers may be able to improve LookML dashboard performance by using aggregate awareness. With aggregate awareness, developers can create aggregate tables under LookML explore parameters, which can optimize queries for one or more tiles in a dashboard.
Once you have created and are viewing a LookML dashboard, you can use the Get aggregate table LookML option in the three-dot Dashboard actions menu, which is visible if you have the see_lookml permission.

For more information, see the aggregate_table parameter documentation page.