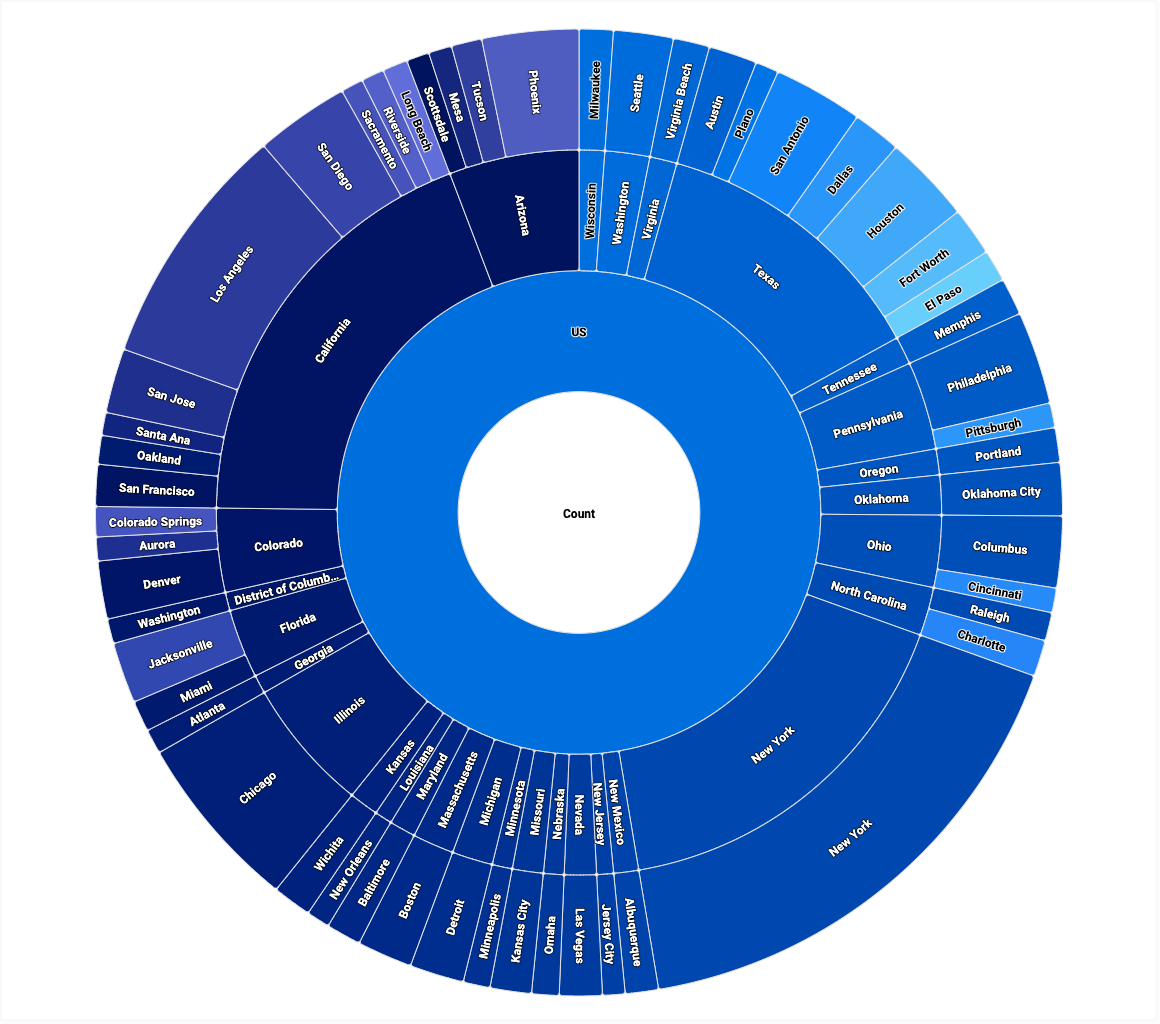
旭日圖會以一組同心圓環顯示階層式資料,每個圓環切片的大小取決於數值指標。
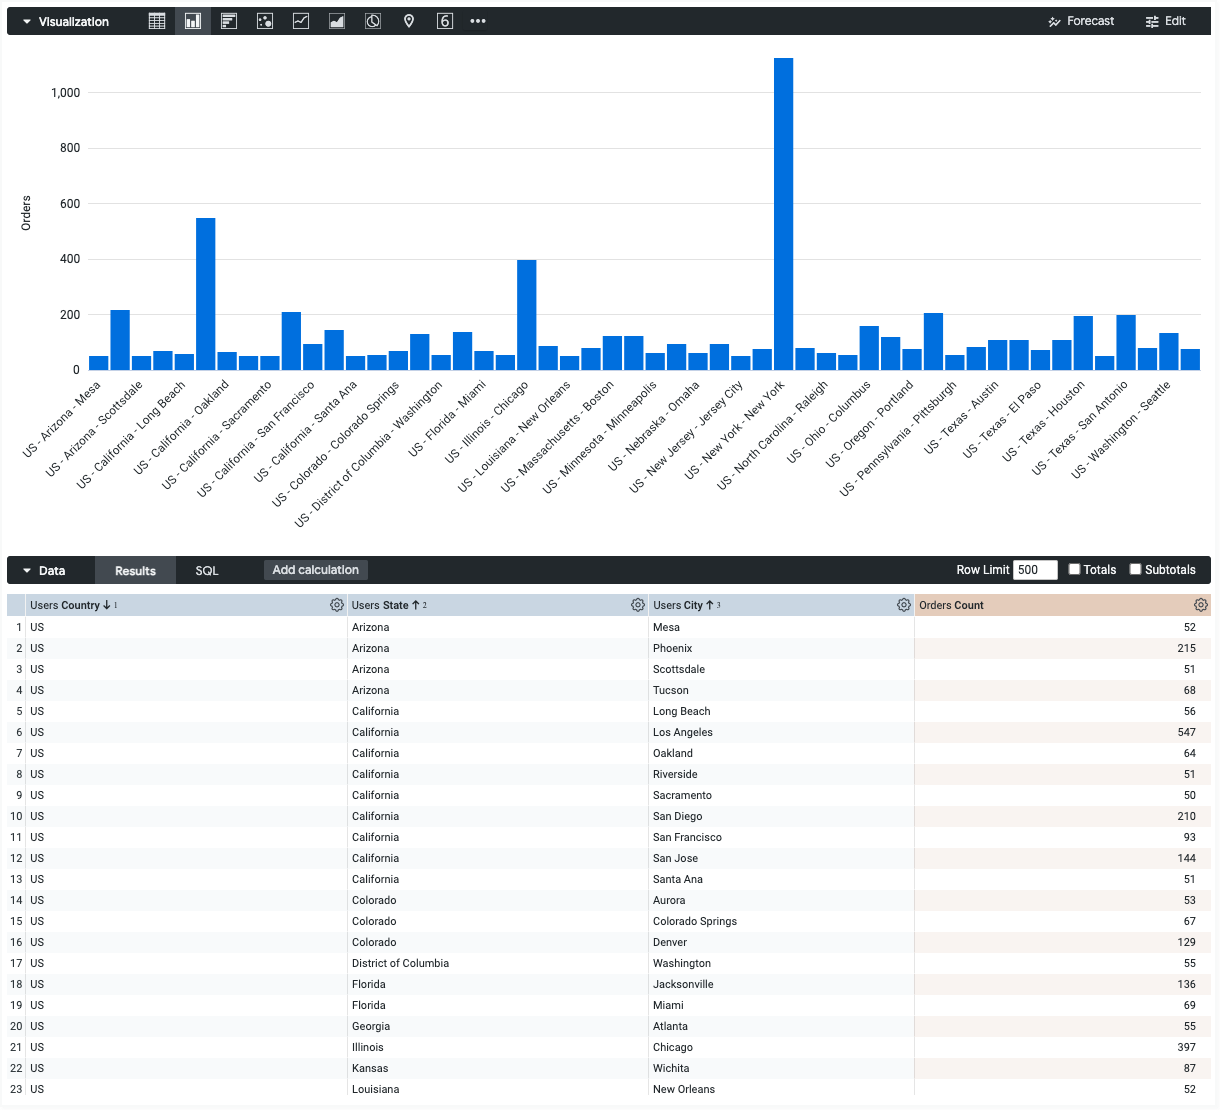
使用圖表設定編輯器,從 Looker 中的直條圖開始,即可建立旭日圖。如要獲得最佳效果,請使用至少兩個未樞紐分析的維度和一個數值指標,建立旭日圖。
舉例來說,您可以建立旭日圖,顯示依「使用者國家/地區」、「使用者州/省」和「使用者城市」維度細分的「訂單數」指標。每個圓環切片的大小對應至「訂單數」。
必要條件
如要存取圖表設定編輯器,您必須具備 can_override_vis_config 權限。
編寫 JSON 片段
如要建立旭日圖,請從下列 JSON 片段開始:
{
  chart: {
    type: 'sunburst',
  }
}
建立旭日圖
如要建立旭日圖,請按照下列步驟操作:
在「探索」中查看直條圖,或在「Look」或資訊主頁中編輯直條圖。
從包含兩個以上未透視維度和一個數值指標的直條圖開始。請務必依精細程度排序維度,從最不精細到最精細。您的起始圖表可能看起來像繪製單一指標的直條圖,每個 x 軸值都有維度值串連。
開啟資料視覺化中的「編輯」選單。
在「Plot」分頁中,按一下「Edit Chart Config」按鈕。Looker 會顯示「編輯圖表設定」對話方塊。
選取「圖表設定 (覆寫)」部分,然後輸入本頁「編寫 JSON 片段」部分中的 HighCharts JSON。
如要讓 Looker 正確格式化 JSON,請按一下「<> (格式化程式碼)」。
如要測試變更,請按一下「預覽」。
如要套用變更,請按一下「套用」。系統會使用自訂 JSON 值顯示視覺化內容。
自訂完圖表後,即可儲存。
深入分析資料
放射環狀圖支援下列向下鑽取動作:
- 如要深入瞭解某個維度值,請按一下對應的圓環切片。
- 如要返回上一層,請按一下旭日圖的中心。
- 如要返回一或多個層級,請使用圖表左上方的導覽標記。