시스템 활동의 쿼리 성능 측정항목 Explore는 Looker 인스턴스에서 실행되는 각 쿼리에 대한 자세한 분석을 제공합니다.
예를 들어 이 Explore를 사용하여 로드 시간이 가장 긴 쿼리 구성요소를 조사할 수 있습니다. 이 Explore를 사용하여 쿼리 성능 동향과 이상치를 식별할 수도 있습니다.
시스템 활동에서 사용할 수 있는 Explore에 관한 자세한 내용은 시스템 활동 Explore로 Looker 사용량 모니터링하기 문서 페이지를 참고하세요.
쿼리 성능 측정항목 보기
쿼리 성능 측정항목은 시스템 활동 쿼리 성능 측정항목 Explore에 표시됩니다. 쿼리 성능 측정항목 Explore를 보려면 Looker 관리자이거나 see_system_activity 권한이 있어야 합니다.
Looker 쿼리 수명 주기 이해
Looker가 데이터베이스로 보내는 각 쿼리는 여러 단계로 구성된 각 과정을 거칩니다. 이러한 각 단계는 쿼리 성능 측정항목 Explore에서 측정기준으로 표시됩니다.
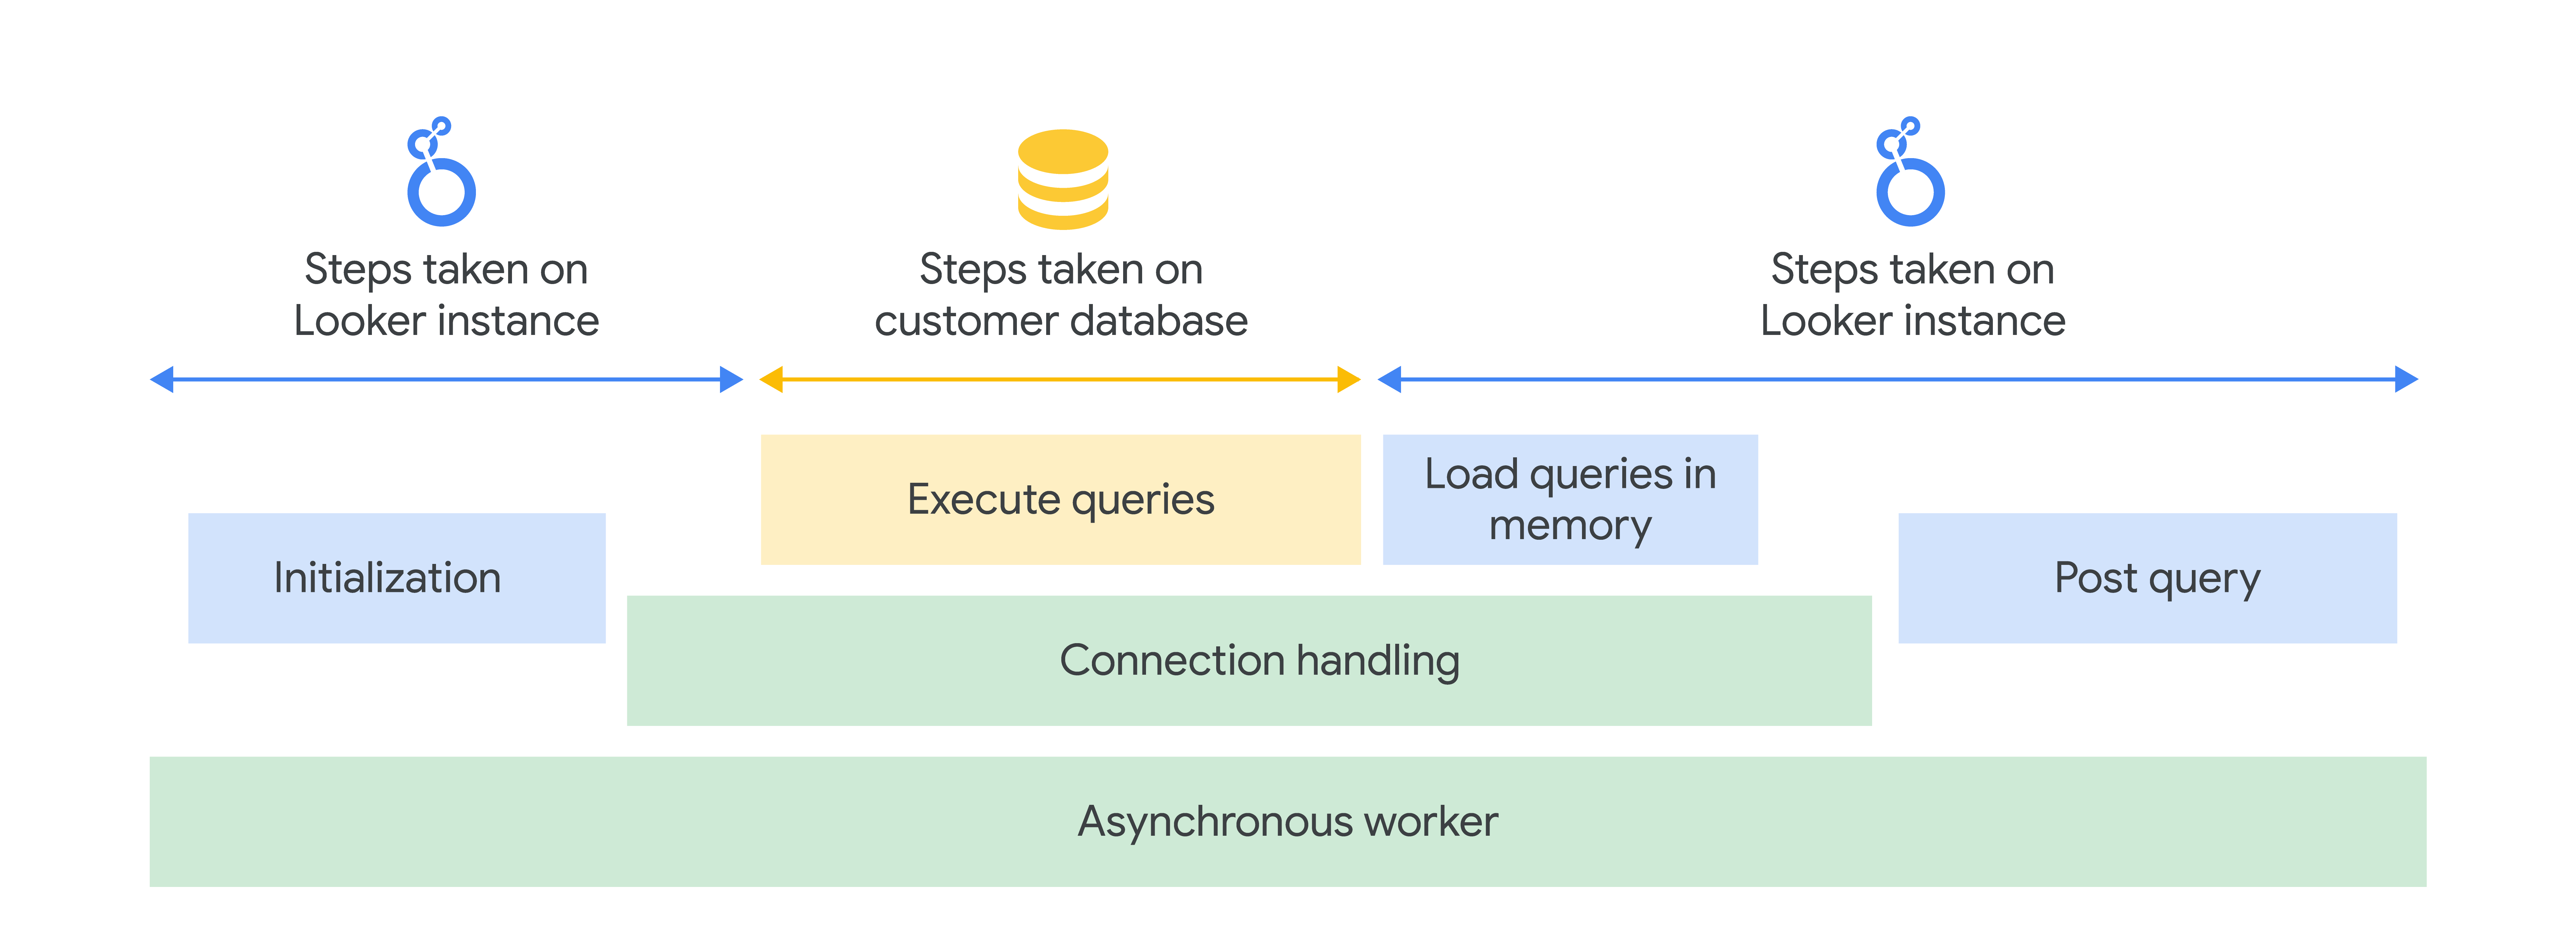
개략적으로 단계는 다음과 같이 개념화할 수 있습니다.
- 비동기 작업자 단계: 먼저 쿼리 태스크를 사용 가능한 비동기 작업자에 할당해야 합니다. 사용 가능한 작업자가 없으면 대기열 시간이 발생할 수 있습니다.
- 초기화 단계: 비동기 작업자가 할당되면 Looker 인스턴스는 여러 초기화 단계를 실행하여 쿼리를 준비합니다.
- 연결 처리 단계: 초기화가 완료되면 Looker 인스턴스가 고객 데이터베이스에 대한 연결을 설정합니다.
- 기본 쿼리 단계: Looker 인스턴스가 고객 데이터베이스에 대한 연결을 설정하면 기본 쿼리가 고객 데이터베이스에서 실행됩니다. 쿼리에 대해 선택한 옵션에 따라 합계와 같은 결과를 계산하기 위한 추가 쿼리도 실행될 수 있습니다. 쿼리가 스트리밍되지 않은 경우 쿼리가 Looker 인스턴스의 메모리에 로드됩니다. 이후에는 Looker 인스턴스와 고객 데이터베이스 간의 연결이 종료됩니다.
- 쿼리 후 단계: 마지막으로 Looker 인스턴스는 여러 쿼리 후 단계를 실행하여 다음 대상에 대한 쿼리를 준비합니다. 이 시점에서 비동기 작업자가 해제됩니다.
쿼리 성능 측정항목
다음 섹션에서는 각 쿼리 과정과 쿼리 단계를 시간순으로 나열합니다.
비동기 작업자 단계 측정항목
| 쿼리 단계 | 측정항목 설명 |
|---|---|
Queued |
쿼리가 실행할 수 있도록 비동기 작업자를 사용할 수 있을 때까지 대기하는 시간(초)입니다. |
Async processing |
비동기 작업자가 쿼리에 사용하는 시간(초)입니다. 작업자는 쿼리 후 단계가 완료될 때까지 쿼리 작업을 계속하므로 이 측정항목이 이 페이지의 대부분의 다른 측정항목과 겹칩니다. |
초기화 단계 측정항목
| 쿼리 단계 | 측정항목 설명 |
|---|---|
Model Init: From Cache |
캐시에서 모델 정의를 가져오는 데 걸리는 시간(초)입니다. null 값을 반환하는 경우 캐시에서 가져오는 대신 모델이 로드되고 파싱되었음을 의미합니다. (Model Init: Computed 단계를 참조합니다.) |
Model Init: Computed |
쿼리를 실행하는 데 필요한 모델을 로드하고 파싱하는 데 걸리는 시간(초)입니다. null 값을 반환할 경우 모델이 처음부터 로드되고 파싱되는 대신 캐시에서 검색했음을 의미합니다. (Model Init: From Cache 단계를 참조합니다.) |
Explore Init: From Cache |
캐시에서 Explore 초기화를 가져오는 데 걸리는 시간(초)입니다. null 값을 반환하는 경우 캐시에서 가져오는 대신 Explore가 로드되고 파싱되었음을 의미합니다. (Explore Init: Computed 단계를 참조합니다.) |
Explore Init: Computed |
prepare를 시작하기 전에 Explore를 초기화하는 데 걸리는 시간(초)입니다. null 값을 반환할 경우 Explore가 처음부터 로드되고 파싱되는 대신 캐시에서 검색했음을 의미합니다. (Explore Init: From Cache 단계를 참조합니다.) |
Prepare |
Explore 정의에서 쿼리를 준비하는 데 걸리는 시간(초)입니다. |
연결 처리 단계 측정항목
| 쿼리 단계 | 측정항목 설명 |
|---|---|
Per User Throttler |
사용자가 쿼리를 실행할 수 있도록 연결이 사용 가능해질 때까지 쿼리가 대기하는 시간(초)입니다. |
Acquire Connection |
Looker 인스턴스가 고객 데이터베이스에 대한 연결을 획득하는 데 걸리는 시간(초)입니다. 이 단계에는 사용자의 사용자 인증 정보를 조회하고, 연결 풀이 없으면 새로 만들고, 사용할 연결을 초기화하는 시간이 포함됩니다. |
Connection Held |
Looker 인스턴스가 고객 데이터베이스에 대한 연결을 유지하는 시간(초)입니다. 이 단계에는 고객 데이터베이스가 SQL 쿼리를 실행하는 데 걸리는 시간이 포함됩니다. |
기본 쿼리 단계 측정항목
| 쿼리 단계 | 측정항목 설명 |
|---|---|
Cache Load |
결과 집합 캐시에서 원시 결과를 가져오는 데 걸리는 시간(초)입니다. |
PDTs |
쿼리에 필요한 영구 파생 테이블을 빌드하는 데 걸리는 시간(초)입니다. |
Execute Main Query |
고객 데이터베이스에서 primary 쿼리를 실행하는 데 걸리는 시간(초)입니다. 여기에는 고객 데이터베이스에서 연결을 가져오는 데 걸리는 시간이 포함되지 않습니다. 크기가 큰 결과 허용 기능을 사용해야 하는 쿼리에서는 추적되지 않습니다. |
Execute Totals Query |
쿼리를 실행하여 고객 데이터베이스에 합계를 생성하는 데 걸리는 시간(초)입니다. 합계가 사용 설정된 쿼리에만 적용됩니다. |
Execute Row Totals Query |
쿼리를 실행하여 고객 데이터베이스에 행 합계를 생성하는 데 걸리는 시간(초)입니다. 행 합계가 사용 설정된 쿼리에만 적용됩니다. |
Execute Grand Totals Query |
쿼리를 실행하여 고객 데이터베이스에 총계를 생성하는 데 걸리는 시간(초)입니다. 합계 및 행 합계가 모두 사용 설정된 쿼리에만 적용됩니다. |
Load Process and Stream Main Query |
기본 쿼리를 로드(고객 데이터베이스에서)하고, 처리(Looker 인스턴스에서)하여 스트리밍하는(클라이언트에) 데 걸리는 시간(초)입니다. 스트리밍 쿼리에만 적용됩니다. |
Load Main Query In Memory |
기본 쿼리가 고객 데이터베이스에서 로드되는 데 걸리는 시간(초)입니다. 스트리밍되지 않은 쿼리에만 적용됩니다. |
Load Totals Query In Memory |
쿼리를 로드하여 메모리에 합계를 생성하는 데 걸리는 시간(초)입니다. 합계가 사용 설정된 스트리밍되지 않은 쿼리에만 적용됩니다. |
Load Row Totals Query In Memory |
쿼리를 로드하여 행 합계를 메모리에 생성하는 데 걸리는 시간(초)입니다. 행 합계가 사용 설정된 스트리밍되지 않은 쿼리에만 적용됩니다. |
Load Grand Totals Query In Memory |
쿼리를 로드하여 메모리에 총계를 생성하는 데 걸리는 시간(초)입니다. 합계 및 행 합계가 모두 사용 설정된 스트리밍되지 않은 쿼리에만 적용됩니다. |
쿼리 후 단계 측정항목
| 쿼리 단계 | 측정항목 설명 |
|---|---|
Postprocessing |
쿼리 후 처리에 필요한 시간(초)입니다. 연결이 닫힌 후에 발생합니다. |
Stream to Cache |
결과를 처리하고 렌더 캐시로 스트리밍하는 데 걸리는 시간(초)입니다. |
BigQuery BI Engine 측정항목
Looker와 함께 BigQuery BI Engine을 사용하는 경우 쿼리 성능 측정항목 Explore를 사용하여 쿼리에 대한 데이터베이스별 정보를 볼 수 있습니다. BI Engine을 사용하지 않는 쿼리와 BigQuery 데이터베이스 이외의 데이터베이스를 쿼리하면 해당 측정항목에 대해 null 값이 반환됩니다.
| 측정항목 | 측정항목 설명 |
|---|---|
BigQuery Job ID |
쿼리의 BigQuery 작업 ID입니다 (또는 NULL). BigQuery의 쿼리 응답 시간을 단축하기 위해 Looker는 BigQuery에서 즉각적인 결과를 반환할 수 없다고 판단하면 BigQuery는 작업을 만들고 쿼리에는 BigQuery 작업 ID가 부여됩니다 (BigQuery 쿼리 ID는 NULL이 됨). |
BigQuery Query ID |
쿼리의 BigQuery 쿼리 ID입니다 (또는 NULL). BigQuery의 쿼리 응답 시간을 단축하기 위해 Looker는 BigQuery에서 즉각적인 결과를 반환할 수 없다고 판단하면 BigQuery는 작업을 만들고 쿼리에는 BigQuery 작업 ID가 부여됩니다 (BigQuery 쿼리 ID는 NULL이 됨). 이 필드가 비어 있으면 BigQuery가 쿼리를 즉시 실행할 수 없어 쿼리를 실행하는 작업을 대신 만들었습니다. BigQuery 작업의 ID를 가져오려면 |
BI Engine Mode |
쿼리를 부분적으로 또는 완전히 가속화할 수 있는지 여부 이 필드에 사용 가능한 값에 대한 자세한 내용은 BI Engine 가속 통계를 참고하세요. |
BI Engine Reason |
쿼리를 완전히 가속화할 수 없는 경우 이 필드에 이유가 표시됩니다. Google BigQuery에서 직접 오는 메시지입니다. |
쿼리 성능 측정항목 문제 해결
쿼리 측정항목을 분석하면 Looker 인스턴스의 성능을 개선할 수 있습니다. 시작하려면 시스템 활동 대시보드 목록에서 성능 권장사항 대시보드를 선택합니다.