To view a dashboard, you must have:
- The View access level for the folder in which the dashboard resides
- The
see_user_dashboardsLooker permission
Additionally, to view a specific dashboard tile, you must have access to the model the tile is based on.
For more information on the access levels and permissions required to view a dashboard or view dashboard tiles, visit the Access control and permission management documentation page.
Anatomy of a dashboard
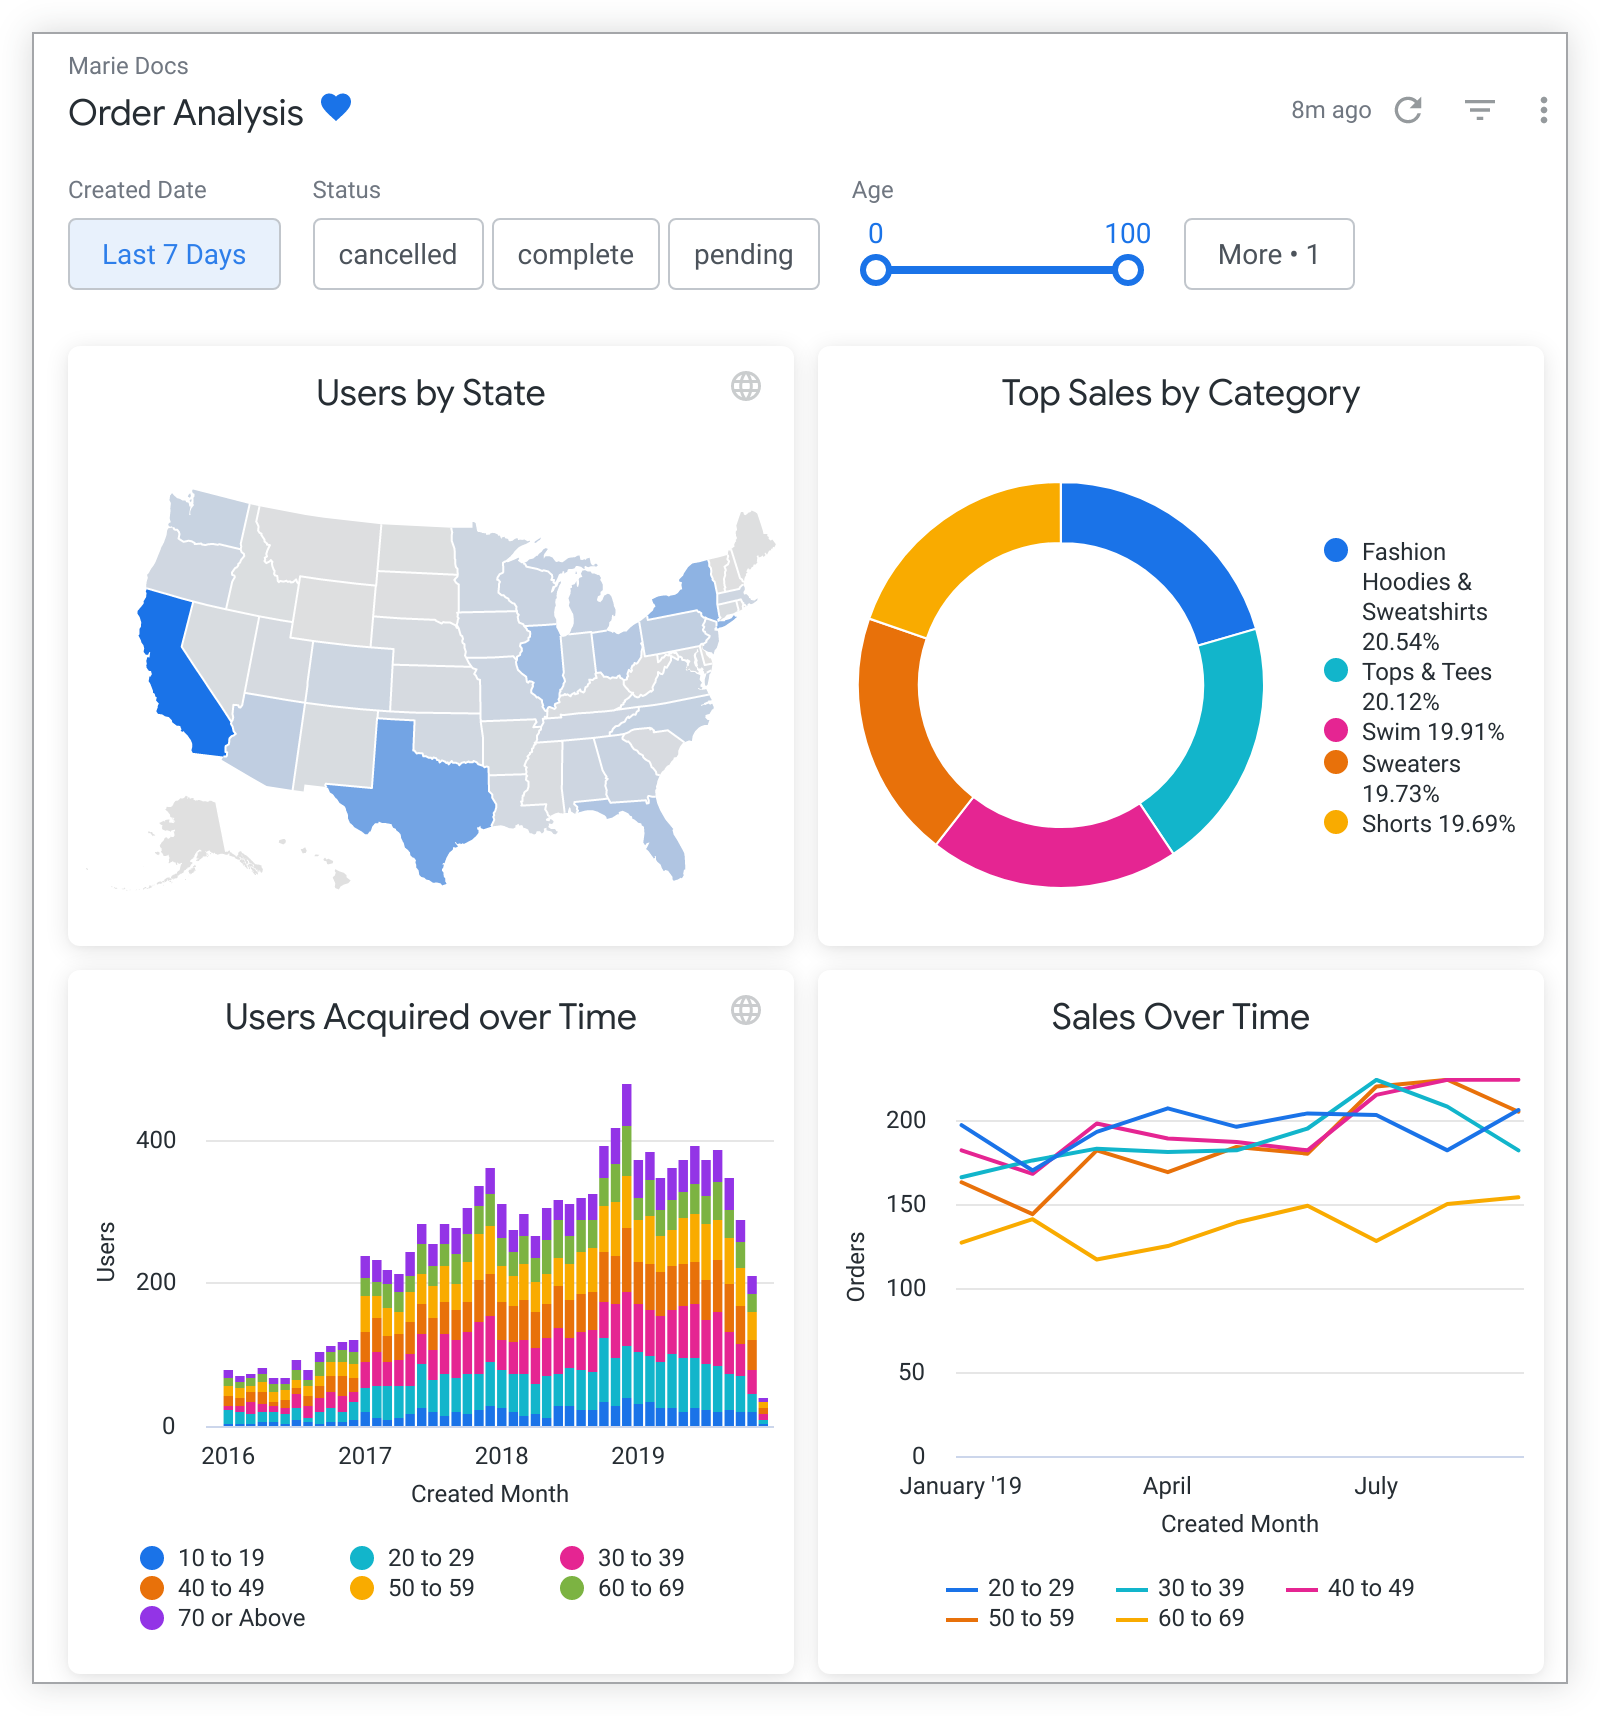
Each dashboard contains a number of elements:
- Navigation breadcrumb
- Add to boards icon
- Dashboard filters
- Dashboard last updated indicator
- Reload data icon
- Filters icon
- Three-dot dashboard menu
Navigation breadcrumb
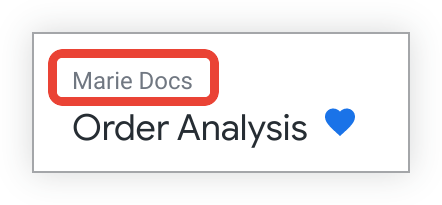
A navigation breadcrumb appears at the top left of the dashboard, indicating the enclosing folder for the dashboard. Click the breadcrumb to be taken to the enclosing folder.
Dashboard title and favorite indicator
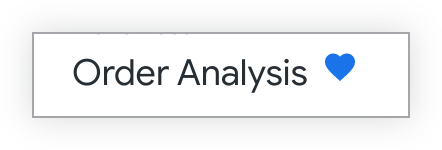
The dashboard title and the heart-shaped favorite indicator appear at the top left of the dashboard.
The dashboard favorite indicator shows whether you have marked the dashboard as a favorite. If the dashboard is marked as a favorite, the heart icon is colored solid blue. You can also favorite or unfavorite directly in the dashboard by clicking on the heart.
Add to boards icon

The Add to boards icon appears to the right of the dashboard title and the heart-shaped favorite indicator.
Selecting the Add to boards icon opens the Add to Boards window, where you can add the dashboard to one or more boards. Any boards that you have selected appear in the right-hand pane of the Add to Boards window.
Dashboard filters
Dashboard filters appear in the filter bar at the top of the dashboard.
The filter bar, which contains the filters, may be set to collapsed or expanded by default. If the filter bar is collapsed, you will see a number next to the filters icon at the top of the dashboard:
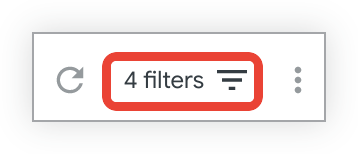
You can click the icon to expand the filter bar and see the filters.
Filter controls
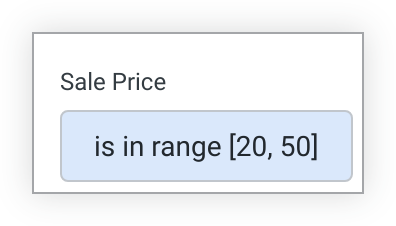
There are a variety of filter controls that you might see. They can be displayed as:
inline filters:
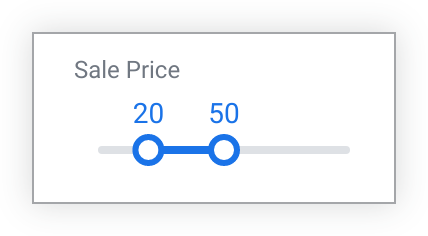
popover filters:
or behind a More button:
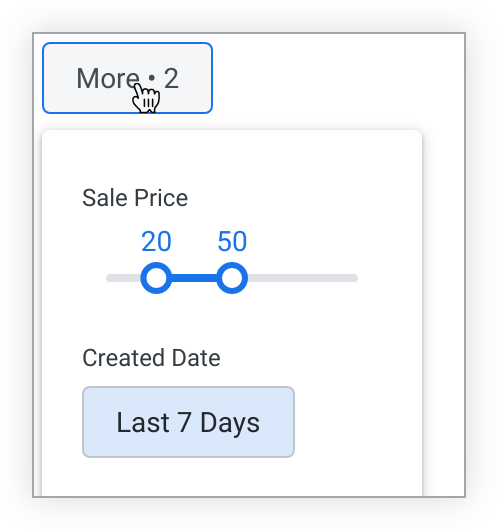
For popover filters and filters that are placed behind a More button, clicking on the filter value or the More button will reveal the full filter control.
Dashboard last updated indicator
This indicator appears at the top right of the dashboard and shows how recently the data on the dashboard has been queried from — in other words, "refreshed" from — the database. It appears when the data for all dashboard tiles has been refreshed at approximately the same time.
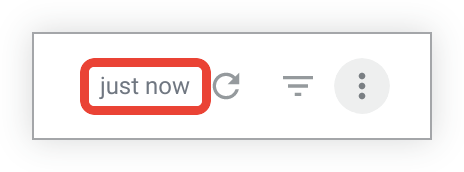
When dashboard tiles have been updated at different times, the last updated indicator no longer appears in this position; instead, each tile contains its own indicator in the tile three-dot menu. For more information, see the Updating data on dashboards section on this page.
Reload data icon
Clicking the circular reload data icon updates the data on the dashboard.
![]()
This is often useful once filters have been changed, added, or removed. In those circumstances, the icon becomes an Update button.
If Run on load is disabled for the dashboard, when a dashboard is opened the icon becomes a Load button, which you must click to load the dashboard's data.
Filters icon
A dashboard's filter bar may be collapsed (filters hidden) or expanded (filters shown) by default. Clicking the filters icon lets you switch the state of the filter bar between collapsed and expanded. When the filter bar is collapsed, an indicator appears next to the filters icon that shows the number of filters on the dashboard.

Three-dot dashboard menu
The three-dot dashboard menu is revealed when you click the three-dot icon at the top right of the dashboard. The menu provides the following options (depending on your permissions):
- Clear cache and refresh
- Edit dashboard
- Show dashboard details
- Dashboard performance summary
- Copy dashboard
- Get LookML
- Download
- Schedule delivery
- Add to a board
- Get embed URL
- Get link
- Reset filters
- Dashboard time zone
- Move to trash
You must have the Manage Access, Edit access level for the dashboard, or be a Looker admin, to see the options to edit the dashboard or move the dashboard to the trash. Filters must be present on the dashboard to see the Reset filters option.
Dashboard details
The Dashboard Details panel appears to the right of the dashboard when the Show dashboard details option has been selected from the three-dot dashboard menu.
This panel displays several metadata items. These include:
Description: A text description of the dashboard, if a description has been added
Favorites: The number of users who have marked the dashboard as a favorite
Views: The number of times the dashboard has been viewed
Owner: The name of the user that created the dashboard
Created: The date and time at which the dashboard was created
Last updated: The date and time at which the dashboard was most recently updated
Updated by: The name of the user that most recently updated the dashboard
To hide the Dashboard Details panel, click the close icon (X) in the upper right corner of the panel.
Dashboard tiles
Each dashboard tile represents a query or Look that can be explored further.
Explore from here
The Explore from here icon allows you to explore the tile's data.
Alerts
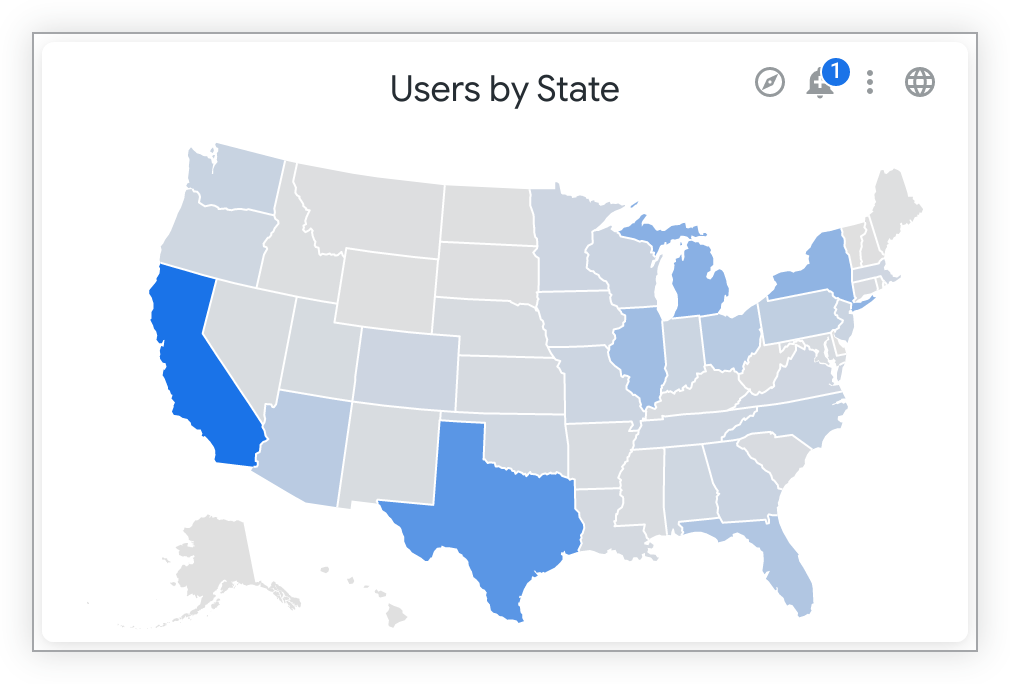
If your Looker admin has given you permission, you can use the bell icon at the upper right of a tile to create or follow an alert on the tile. A numeric indicator will show how many alerts you are permitted to view on that tile.

Tile three-dot menu
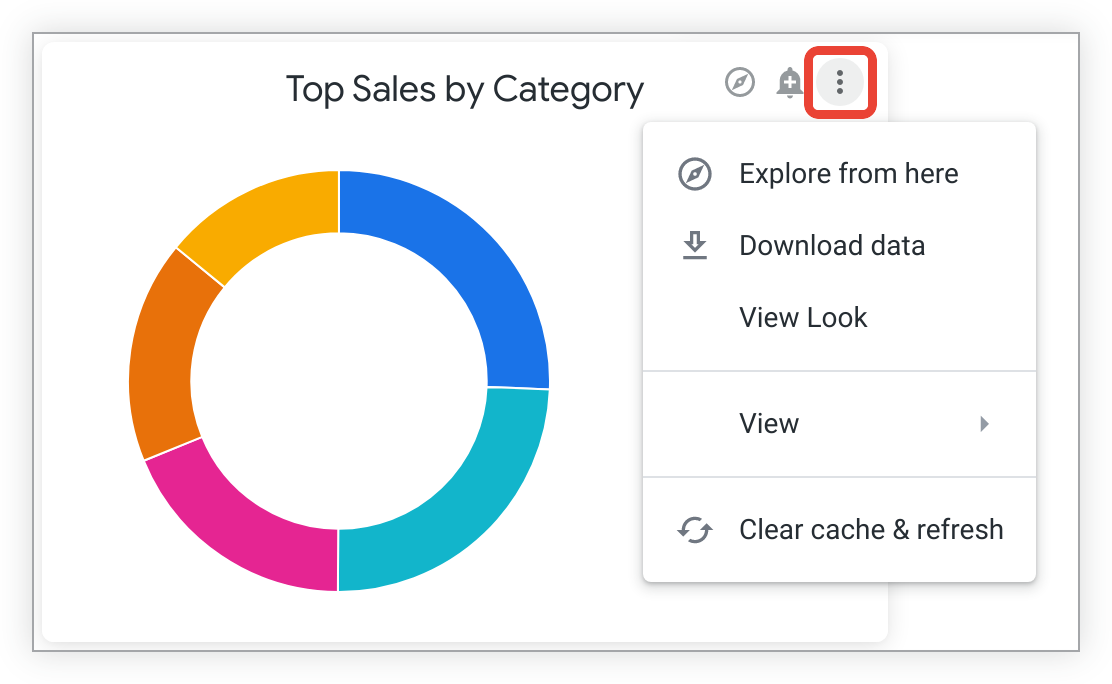
Depending on the permissions that your Looker admin has given you, each tile's three-dot Tile actions menu provides the following options:
- Explore from here, which lets you explore the tile's data
- Download the tile's data
- View the tile's parent Look (for Look-linked tiles only)
- Clear cache and refresh the tile to update its data
If a tile contains a Table or a Table (Legacy) chart, the tile menu will also show options to Autosize all columns and Reset all column widths.
Changes made to column widths using the Autosize all columns or Reset all column widths option are not saved after you close the dashboard. To save changes to settings, enter edit mode on the dashboard, click Edit in the tile's three-dot menu, and change the settings in the edit window that appears.
The three-dot menu may also show when the tile's data was last refreshed from the database, if the tiles on the dashboard have been refreshed at different times.
View options
If your Looker admin has enabled the Full Screen Visualizations Labs feature, you will see an additional menu item in each tile's three-dot Tile actions menu, View. Selecting View opens a submenu that reveals options for Expanded or Full Screen:
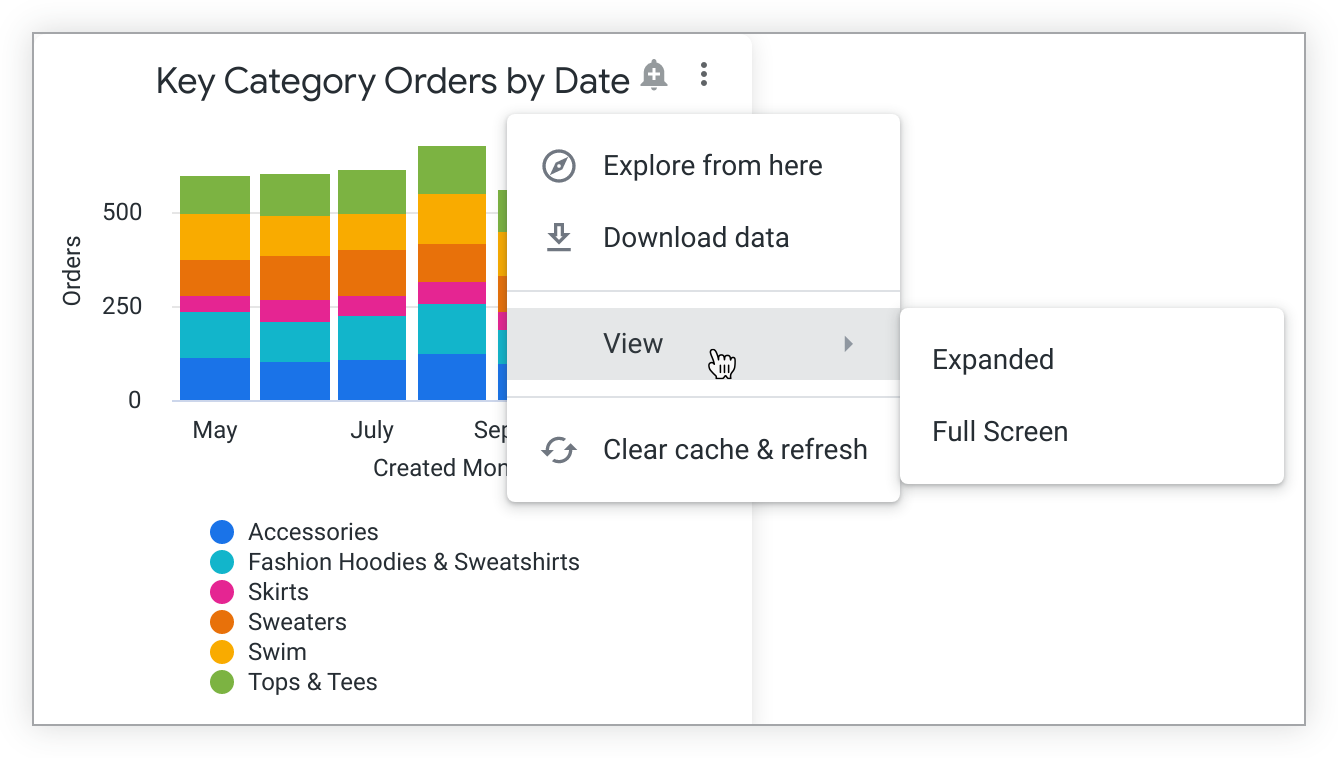
Selecting Expanded from the submenu opens an overlay on top of the dashboard with an expanded view of the tile:
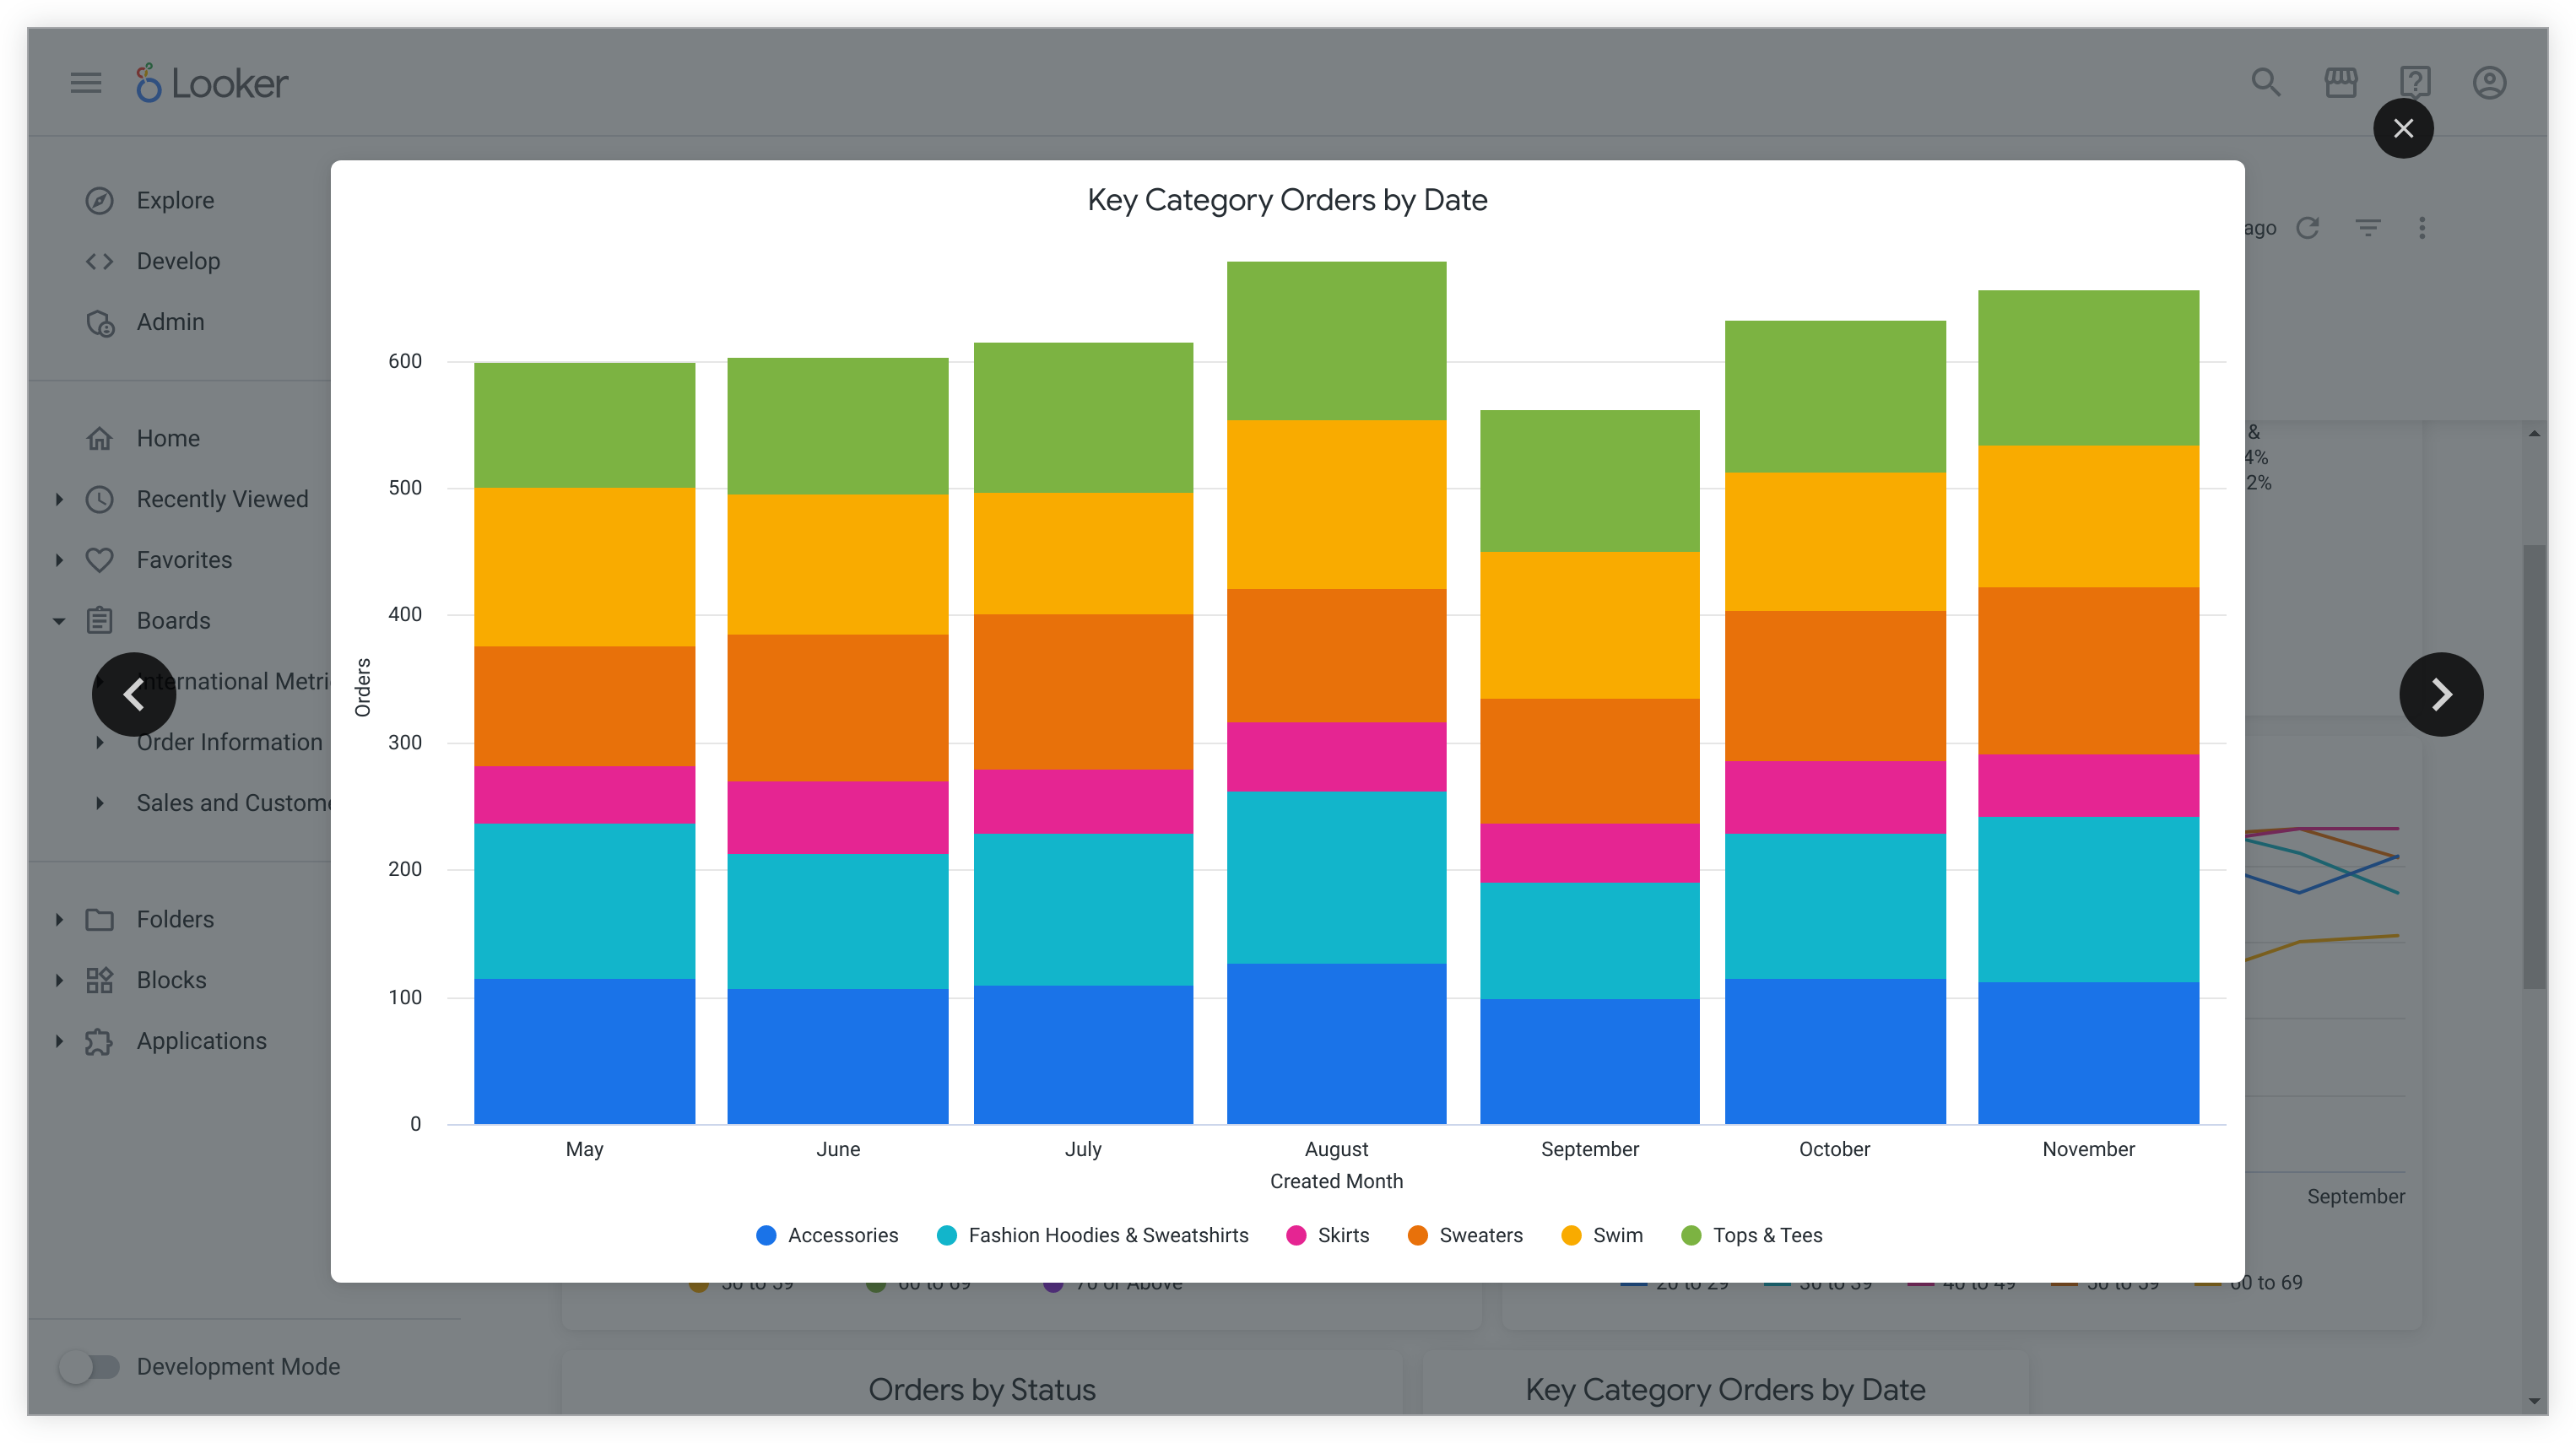
Clicking the forward or back arrows on the overlay cycles the viewer through expanded views of the tiles and buttons that are present on the dashboard. Clicking the Close (X) icon at the top right of the overlay, or pressing the escape key, closes the overlay.
Selecting Full Screen from the View submenu opens a full-screen view of the tile's visualization. Clicking the X icon at the top right closes the full-screen view.
Data history playback
If your Looker admin has enabled the Data history playback (data change over time animation) for visualization Labs feature, you will see an additional menu item in each tile's three-dot Tile actions menu, Data History Playback.
Data History Playback produces a time-based animation of the tile's query, displaying the changes in data for that query over time.
Data History Playback is available for tiles that contain data from an Explore that contains a time field, even if the time field is not present in the query the tile is based on. If a tile is based on an Explore that contain no time fields, Data History Playback is unavailable and disabled in the three-dot Tile actions menu. Data History Playback is also unavailable for merged results tiles.
If the feature is available for a tile, once you select Data History Playback from the tile's menu, a window appears that shows the tile visualization for the data at the beginning of the data history timeframe. Viewers can pause, fast forward, or rewind the animation at any point. The window contains the following playback options:
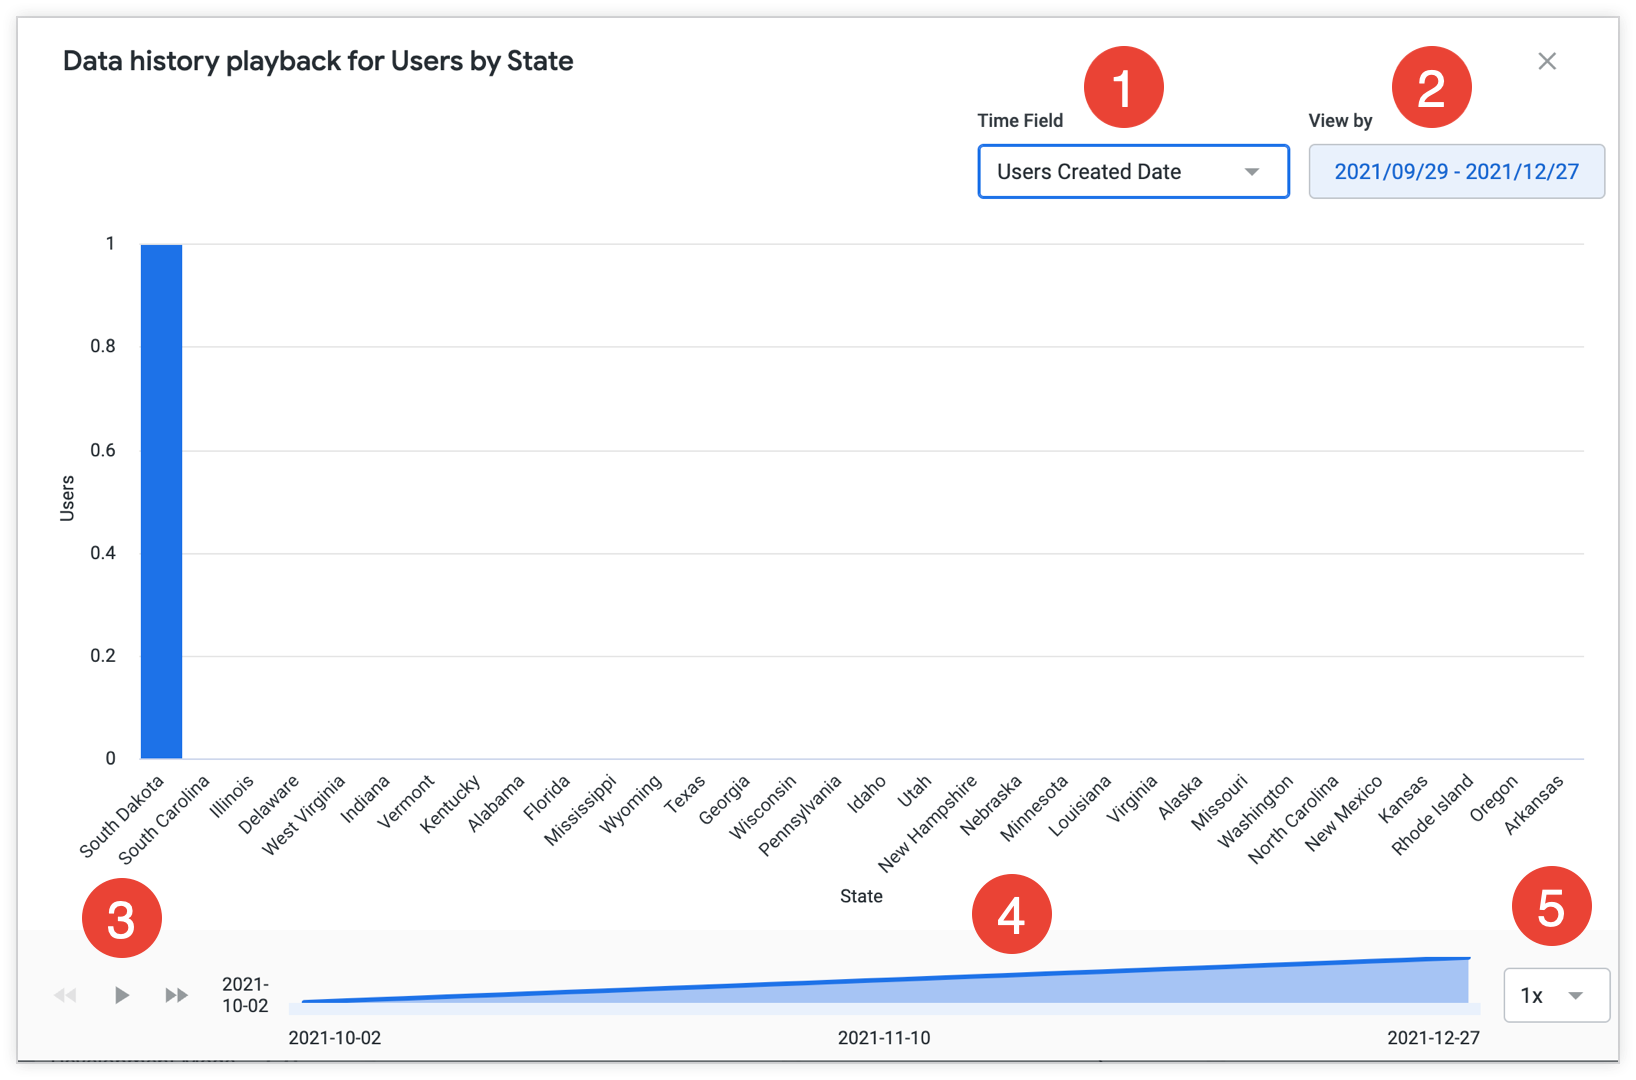
- Time Field: This drop-down menu contains options for all the time fields available in the visualization's Explore. The menu defaults to the first time field present in the view.
- View by: This field determines the timeframe for the playback. The drop-down menu provides options for adjusting the timeframe, through either preset options or a custom date range. Looker displays a message if the selected timeframe gives too little data for playback. To address this, increase the timeframe to enable playback. Looker also displays a message if the selected timeframe does not contain any data for the query. To address this, change the timeframe to a range that contains data to enable the playback.
- Playback player controls: Use the controls at the bottom left to play, pause, rewind, or fast-forward the playback.
- Playback timeline: The playback timeline at the bottom of the window indicates the animation's current location within the playback timeframe. Click locations along the timeline to jump to those frames wihin the playback. Hovering over points along the timeline displays the tooltip for each data point with more details about the data.
- Playback speed: Select the 1x option from the playback speed drop-down menu to play the animation at regular speed. Select the 2x option from the playback speed drop-down menu to play the animation at double speed.
Using Data History Playback on tiles that visualize very large numbers of data points may impact instance performance.
Tile time zone
If your Looker admin has enabled User Specific Time Zones and your dashboard time zone is set to Each tile's timezone, you may see a globe icon in the upper right corner of a tile. This indicates that the tile has a different time zone than the default dashboard time zone and that the tile is not in your default time zone, which is set in your account settings. Hover over the globe icon to see the time zone that the tile is using.
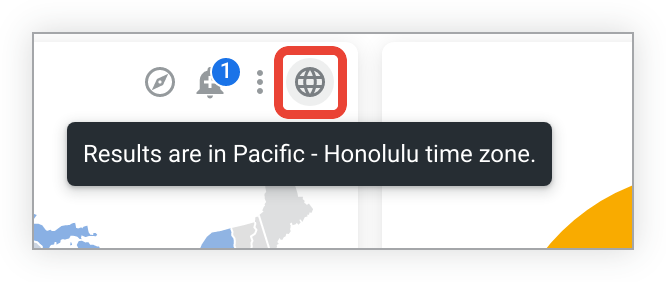
To see the default dashboard time zone, view the three-dot dashboard menu. The default dashboard time zone appears under the Each tile's time zone text.
Zooming on Cartesian charts
You may be able to zoom in on dashboard tiles that contain Cartesian charts (column, bar, scatterplot, line, area, waterfall, or boxplot charts).
To zoom, click and drag to highlight an area within the visualization that you want to zoom on. In the following tile, the shaded rectangle is the area that will be zoomed on:
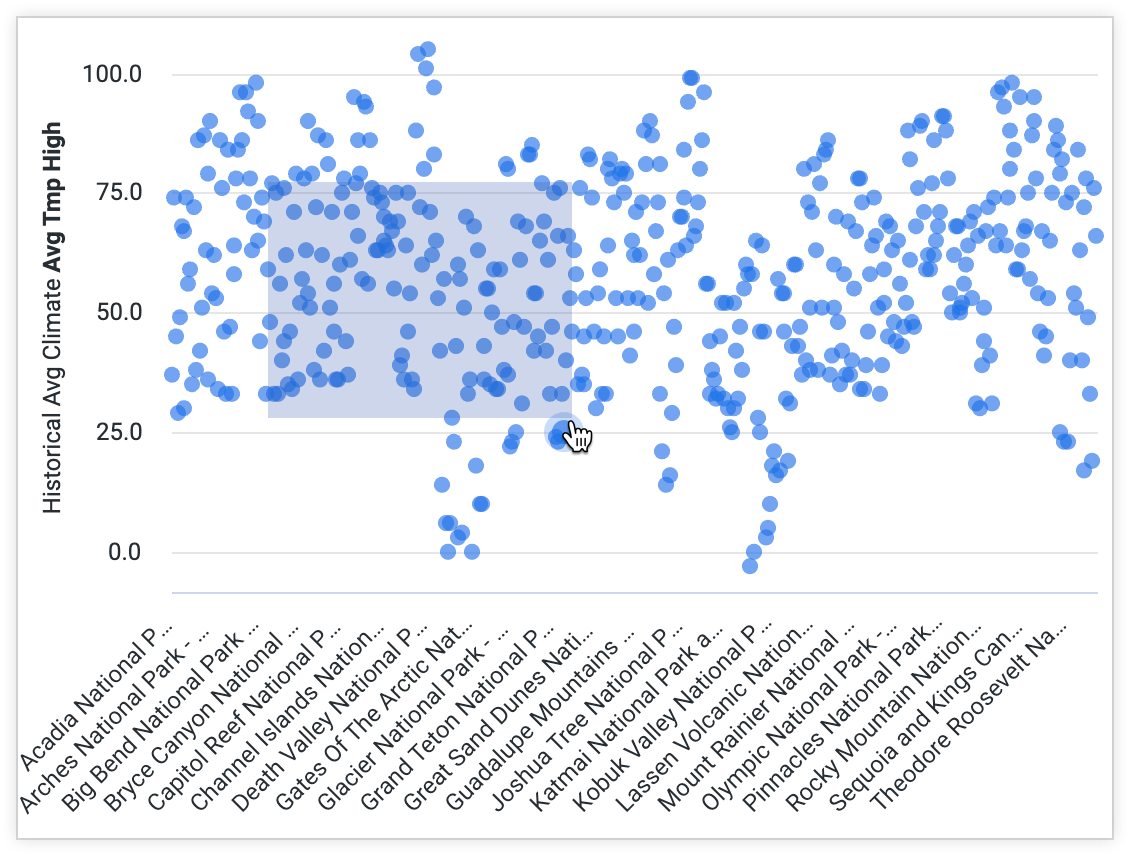
After you highlight the area, the tile refreshes with the zoom area expanded to the full tile size. While zoomed in, you can pan the zoomed area horizontally by holding down the Shift key and dragging the visualization right or left.
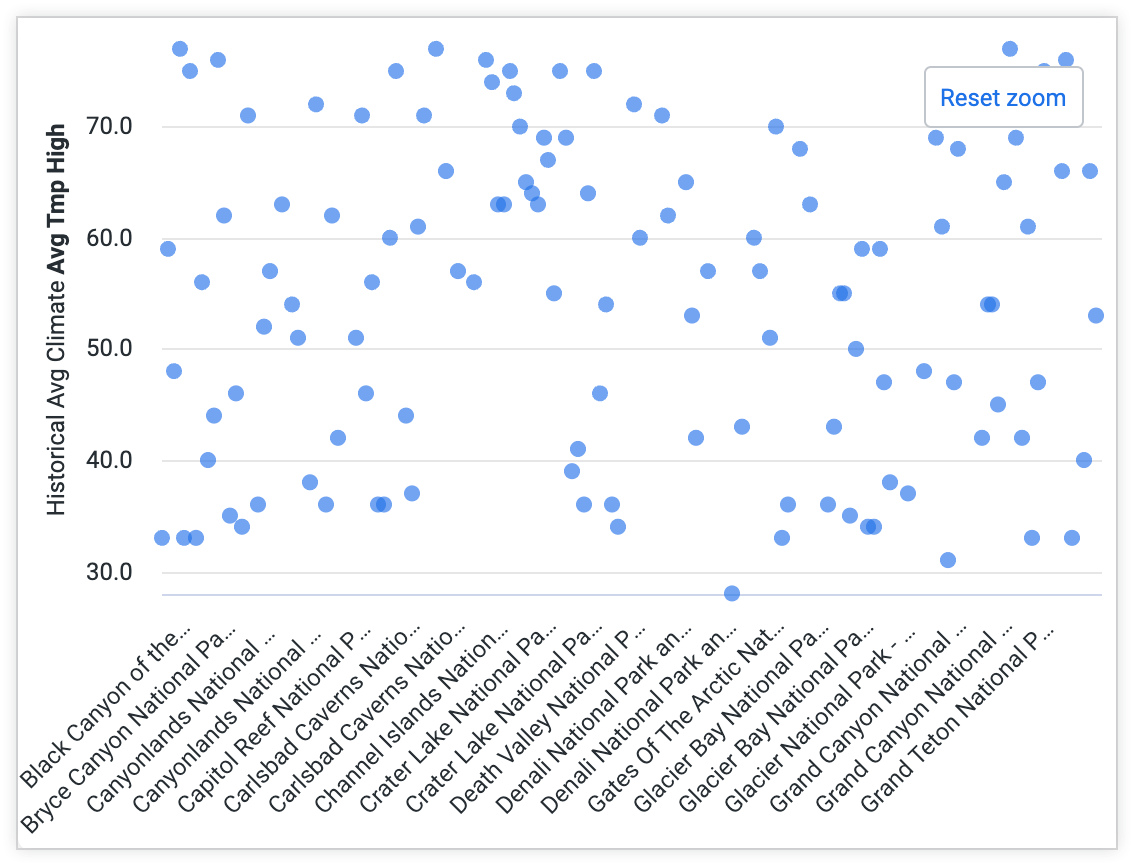
A Reset zoom button appears near the top right of the tile. Click the button to reset the tile to its original appearance.
Zoom areas cannot be saved on a dashboard and will be reset when the viewer closes or navigates away from the dashboard.
If a tile's visualization has the Allow Zoom option on the Y menu disabled, you cannot zoom into smaller portions of the y-axis; you can zoom only into smaller portions of the x-axis. When you highlight an area to zoom, the entire y-axis will be included as shown in the following tile:
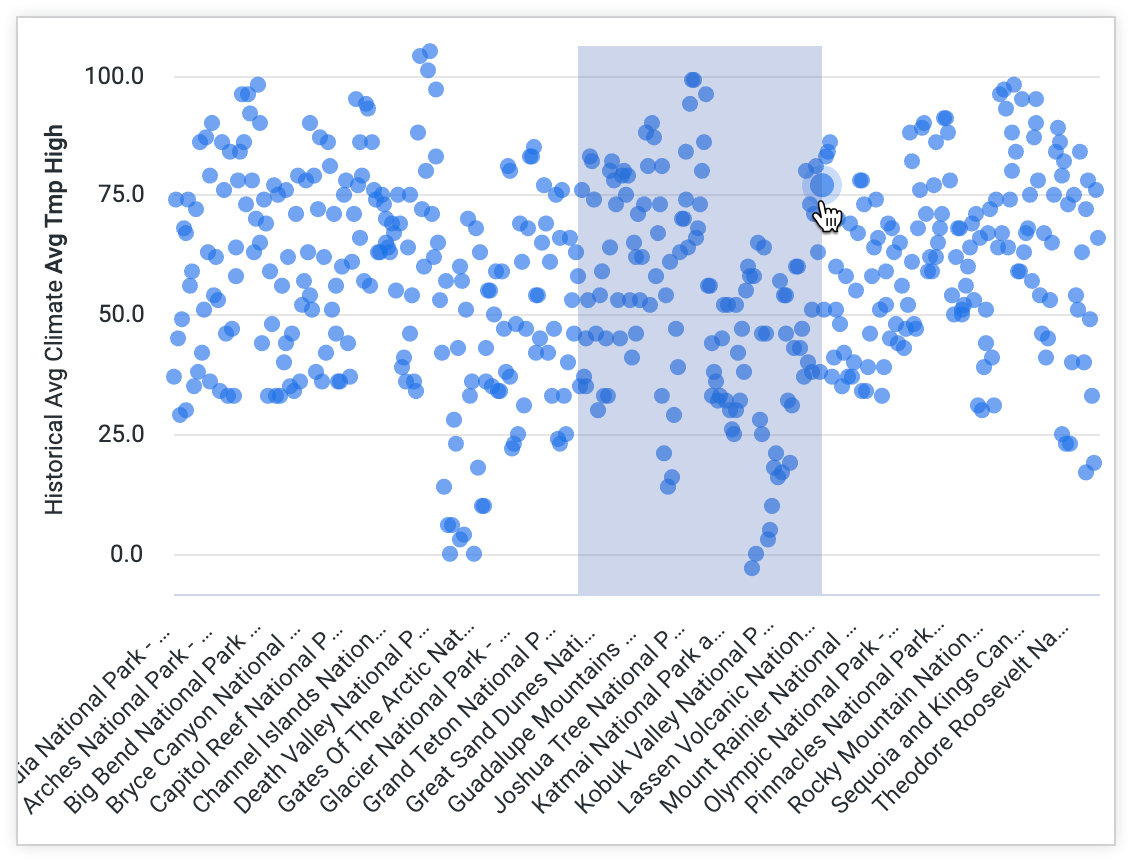
If a tile's visualization has the Allow Zoom option on the X menu disabled, you cannot zoom in on the visualization at all.
Drilling into data points
You can hover over some regions or points in a tile's visualization to reveal a tooltip that displays more details about the data.
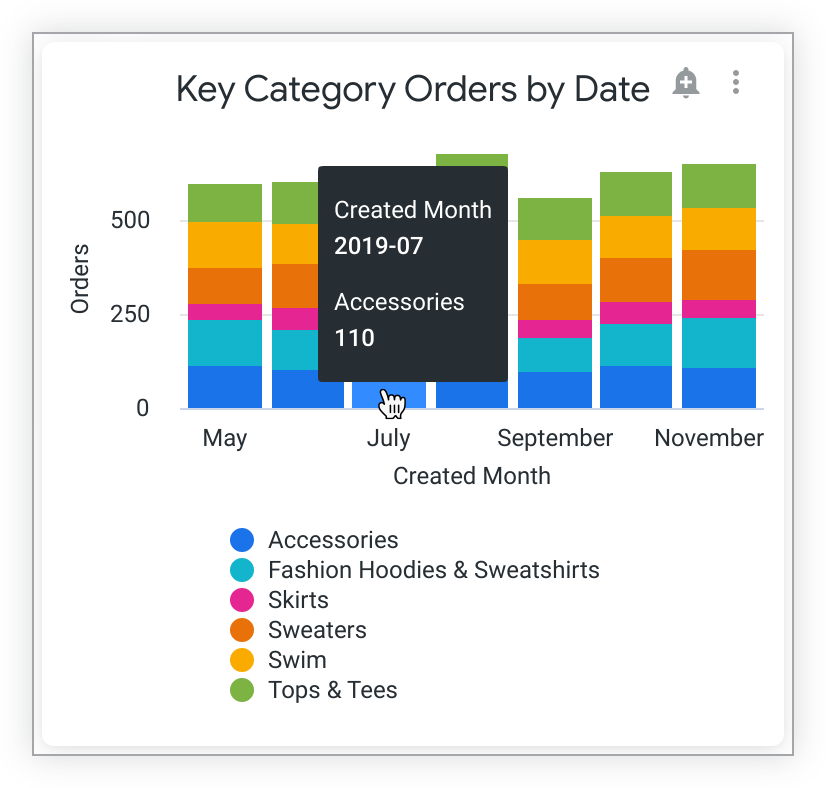
To go deeper, click on a region or data point. Depending on the underlying data, a drill overlay may open automatically, allowing you to drill down into that data point. (In table visualizations, data points that you can drill into show a dotted underscore when you hover over them.) For example, consider a tile displaying an Orders measure grouped by a Status dimension in a table visualization.
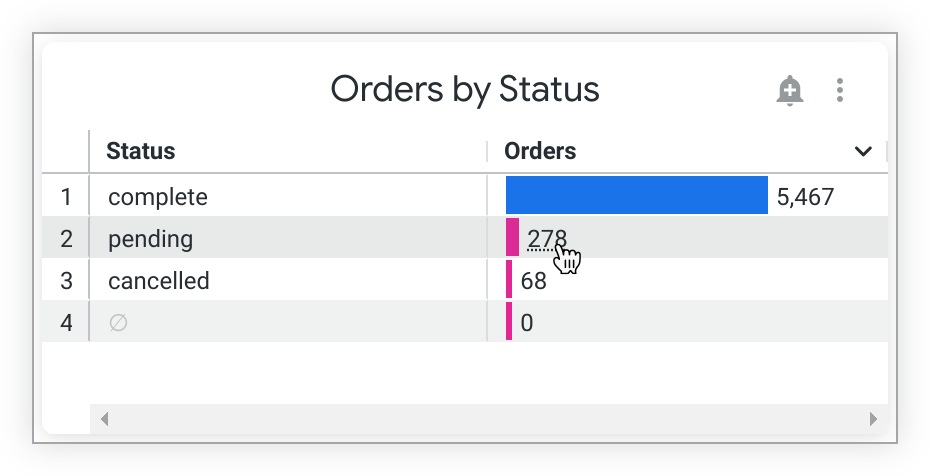
If you click on the Orders measure value in the row where Status has a value of pending, a drill overlay appears that gives you information about all the orders that are pending. The overlay also displays any filters applied, either from the original tile query or as a result of your click.

You can sort the drill overlay by a single column. Click on a column's header and the data table will sort in that column's ascending order. An upward pointing chevron appears at the right of the column to indicate the sort. Click the column header again to change the sort to descending order. The chevron on the right of the column will switch to downward pointing. Sorting by multiple columns is not available.
Click Explore at the top of the overlay to navigate to an Explore page that contains this data, where you can explore the data more.
Click Download in the top right to download the data in the drill overlay.
Depending on the underlying data and the permissions given to you by your Looker admin, you may also be able to drill down further directly in the drill overlay. Drillable data points show dotted underscores when you hover over them. Click on the data point to drill further or open a drill menu with your drilling options, depending on the underlying data.
Drill menu
Depending on the underlying data and the permissions given to you by your Looker admin, clicking on a data point in a tile may open the drill menu, which gives you options to drill into the data in various ways.
For example, consider a tile with an Order Count measure, grouped by a Clothing type dimension and pivoted on an Order Created date dimension. Say that you want to know more about sweater orders in July. You click on the sweaters bar in the July stack, and Looker displays a drill menu for sweater orders in July.
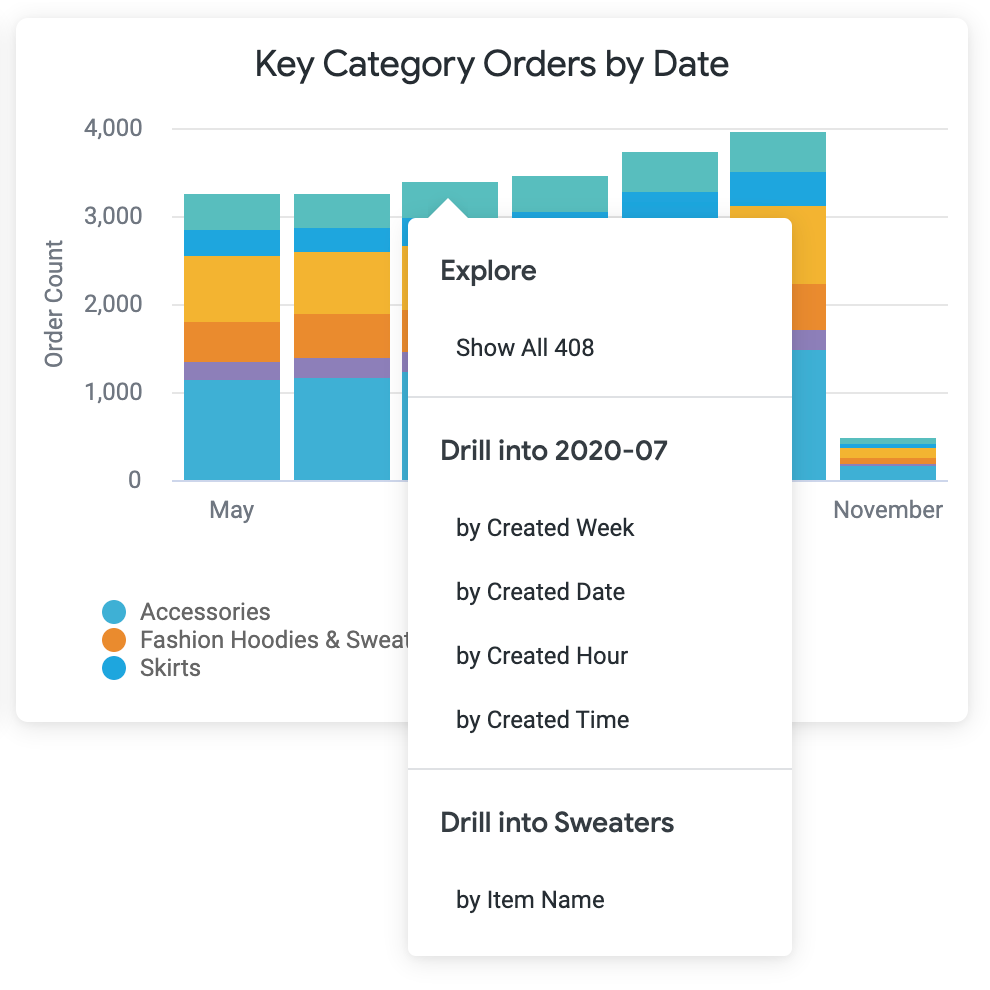
If you click Show All
If you click one of the entries under one of the Drill into... headings, you can slice and dice the data in various ways.
You can use the options under Drill into
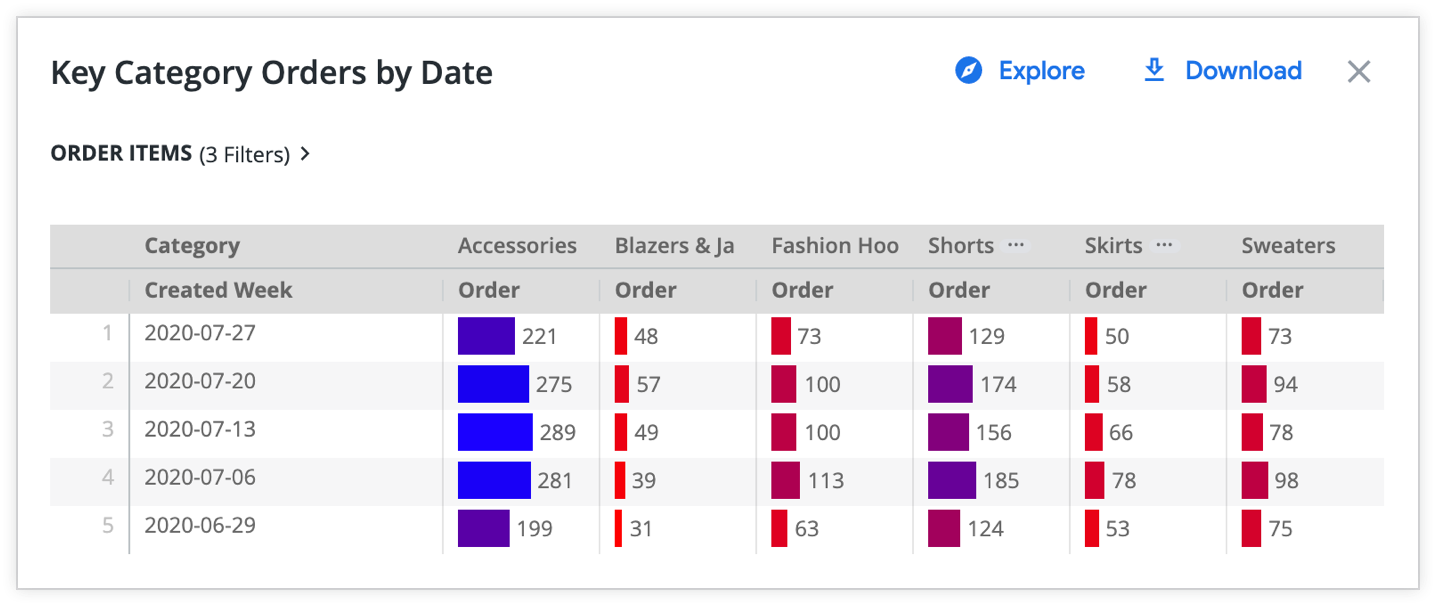
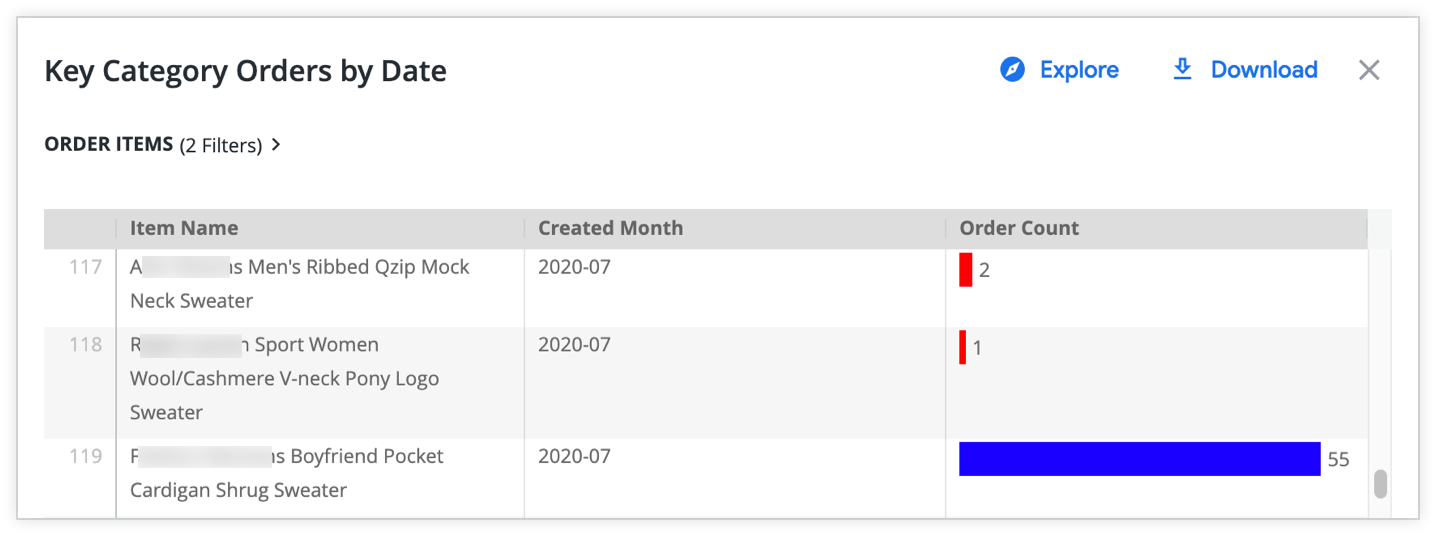
You can also drill into sweater orders by clicking by Item Name under Drill into Sweaters. A drill overlay will appear, showing orders for each individual sweater style broken out by month.
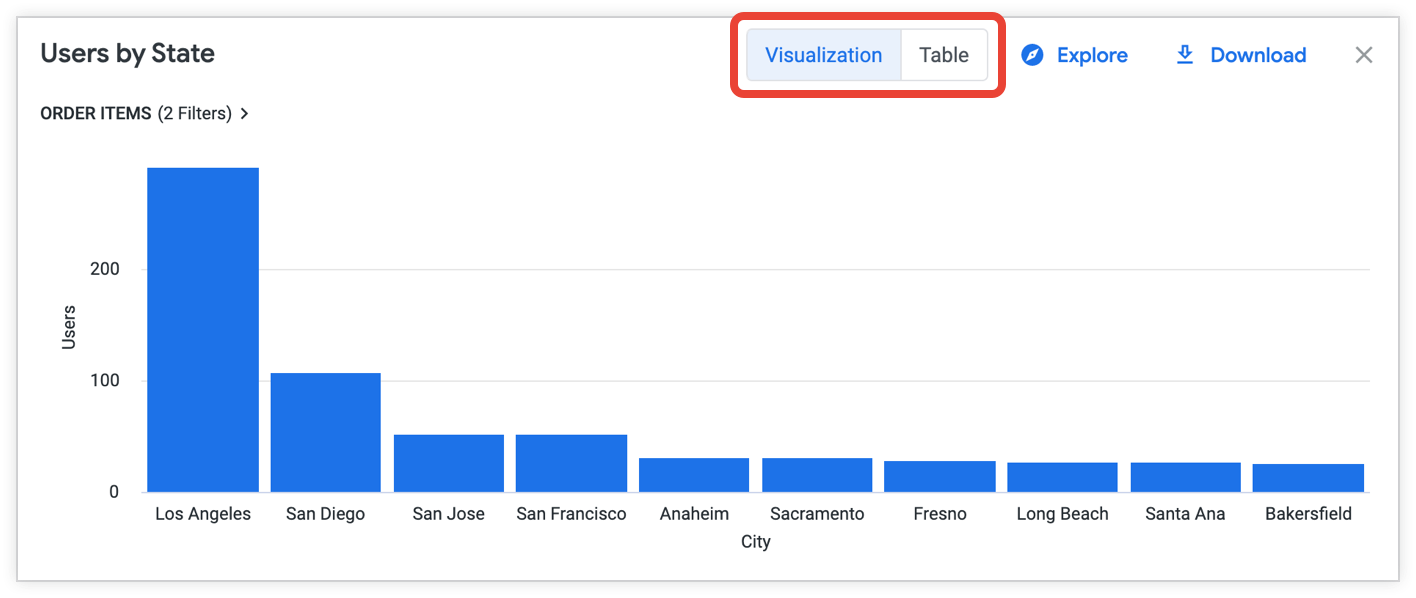
If a LookML developer has set up visual drilling for the data you are drilling into, you may see a visualization instead of a data table when you choose a drill menu option. Switch between the visualization and the data table by clicking the Visualization and Table buttons at the top of the drill window:
In some instances, you must use right-click to open the drill menu:
- When you view single value visualizations
- When you click on certain data points in table visualizations
- When cross-filtering is enabled on a dashboard
Links
If your Looker developers have added clickable links to your data, these links will appear in the drill menu under a Links heading. In table visualizations, the presence of a link is indicated by an ellipsis that follows the data in a field.
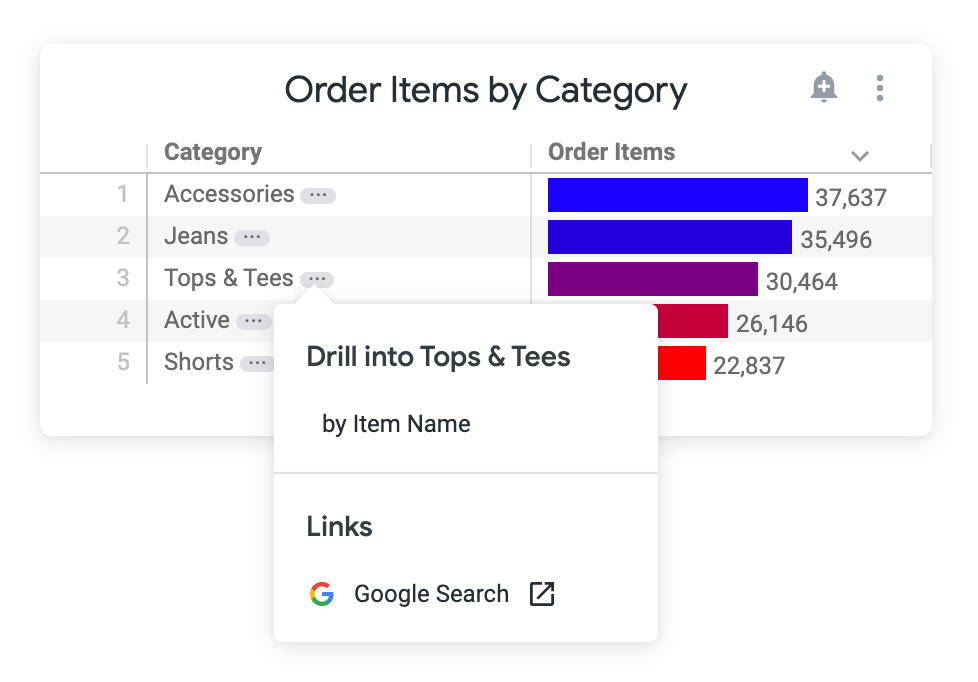
In the preceding example, clicking the Google Search option takes you to the Google search results for the keyword “tops & tees”.
Data actions
Your Looker developers may have added data actions to the dimensions or measures in your data. With data actions, you can perform tasks with other tools directly from Looker, such as sending an email or setting values in other applications. These data actions appear in the drill menu under an Actions heading.
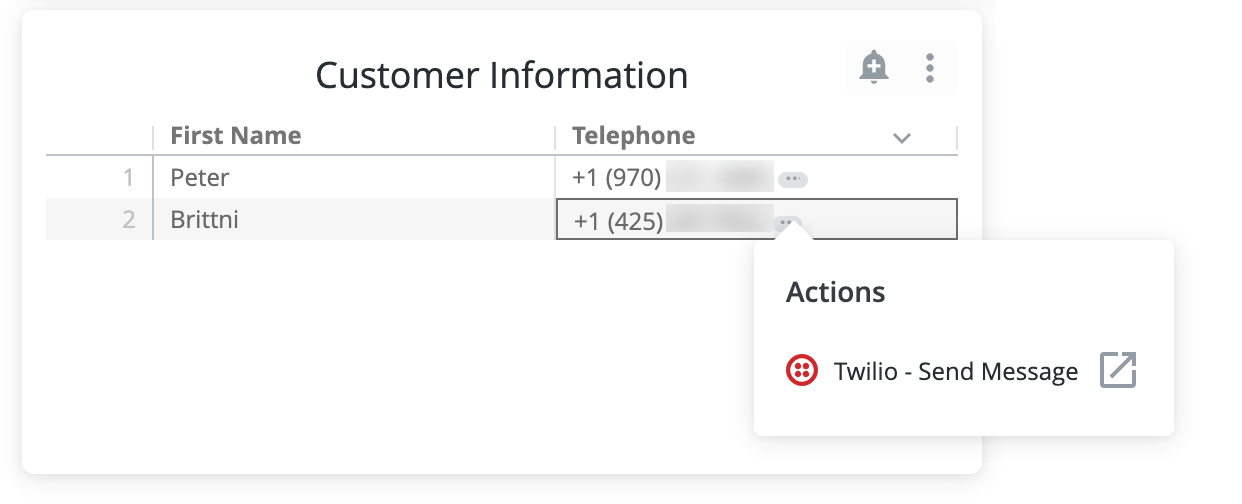
In the preceding example, the Telephone field has a Twilio action. When you click the phone number and select the Twilio action, a pop-up form prompts you to enter a message. Then Twilio sends that message to the phone number.
Not all data actions require a pop-up form. In that case, the action is triggered as soon as a user clicks on it. See the action documentation page for more information.
Temporarily changing the dashboard time zone
The time zone applied to your dashboard can affect the results shown, because of slight differences in the exact hours used for time-based data. If you are interested in the data as it applies to a different region, you might want to change the time zone of your dashboard to reflect that region.
If your Looker admin has enabled User Specific Time Zones, you can view the dashboard time zone in the three-dot dashboard menu. To temporarily change the time zone with which all tiles run their queries, click on the time zone in the menu to open a Dashboard time zone window where you can make adjustments.
You can choose one of the following options:
- Choose Each tile's time zone to run all tiles in the time zone in which they were saved.
- Choose Viewer time zone to run all tiles in the time zone selected in your account settings.
- Choose any of the time zones listed in the drop-down to run all tiles in that time zone.
Once you select your time zone, click Update in the dashboard time zone window; the dashboard will update for the new time zone.
Once you navigate away from the dashboard, the dashboard will return to its default time zone setting.
Temporarily changing filter values on dashboards
If you have temporarily changed the filter values on a dashboard that you want to add to one or more boards, you can turn on the Include custom filter values toggle to add that dashboard with the custom filter values applied.
Looker dashboards can have one or more filters that affect one or more tiles. Filters appear at the top of the dashboard (if a More button appears at the top of your dashboard, click it to see all filters). You can format dashboard filters using a variety of controls that you can interact with in different ways.
You can temporarily change dashboard filter values to see how the data changes by clicking on the different options or selections shown in the filter. You will not affect anyone else's filter results by changing the filter values temporarily using this method.
For example, many dashboards have a filter that specifies a timeframe to include. Consider a filter that specifies a Created Date of the Last 7 Days.
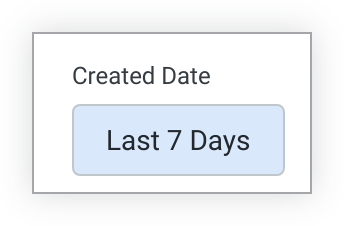
To change its timeframe, click on the filter to display a drop-down menu of preset range options.
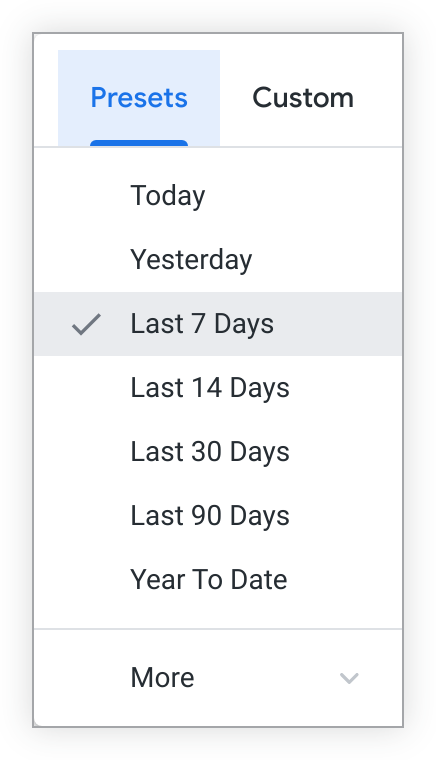
Click More to see additional options.

Select the Custom tab to set any date range you want.
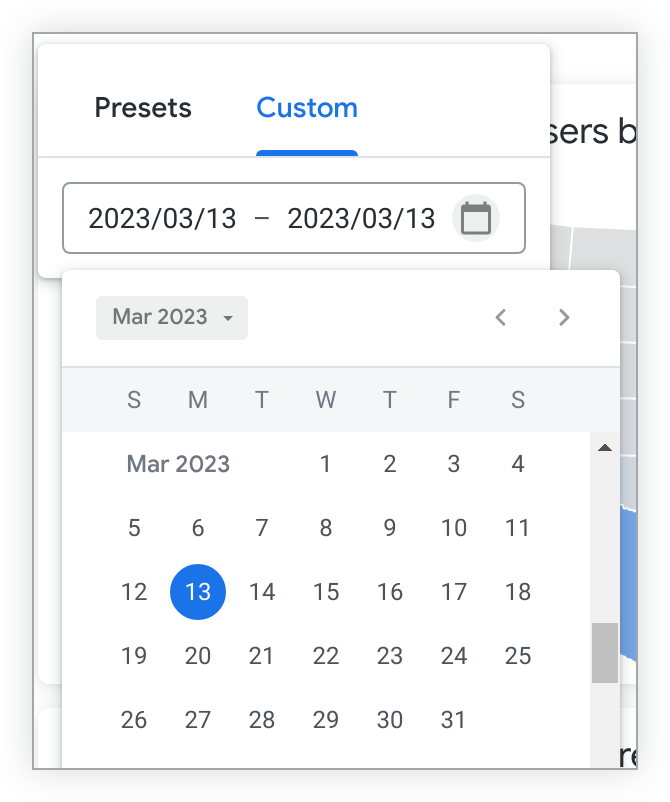
Once you have edited the filter as you like, click the Update button to see how the filter value changes will affect your data.
If you change a filter value and any tiles do not update, the filter may not currently apply to those tiles. To adjust which tiles a filter applies to, you must edit the filter.
When you enter a filter value for a text dimension, Looker preserves any leading or trailing spaces. For example, a filter that contains the text " pants" would not match values that did not contain the leading space, such as "pants and leggings". However, the filter would match any values that contained the space before the word pants, such as "parachute pants".
If you copy and paste a value into a text filter, however, leading and trailing spaces are trimmed as part of the copy and paste process.
Alternatively, you may want to make changes to filters that affect what other people see, such as:
- Changing default filter values
- Changing the format of the filter
- Adding or removing filters
In that case, you must select Edit dashboard from the three-dot dashboard menu, edit the dashboard filter itself, and then save the dashboard with your edits. Everyone who has access to the dashboard will see the updated version you saved.
Resetting filter values
To reset all filters to their default values, select Reset filters from the three-dot dashboard menu. Reset filters also clears any cross-filters that appear on the dashboard.
If a filter value is required, selecting Reset filters clears the data from any tiles linked to that filter. The data reappears when a value is selected for that filter.
Filters must be present on the dashboard for the Reset filters option to be visible.
Creating cross-filters on dashboards
If cross-filtering is turned on for a dashboard, you can create cross-filters on dashboards by clicking data points within the dashboard; the rest of the dashboard will then be filtered by those data points. To learn more about cross-filtering, see the Cross-filtering dashboards documentation page.
Updating data on dashboards
Looker dashboards aren't static snapshots of data from a specific time. Dashboards pull data from your live database, and you can update the data on a dashboard at any point. Additionally, if you make edits to a dashboard's filters, you need to update the dashboard to apply those edits.
If the data for all tiles on the dashboard has been refreshed from the database at roughly the same time, the top right of your dashboard shows how recently the data was updated.
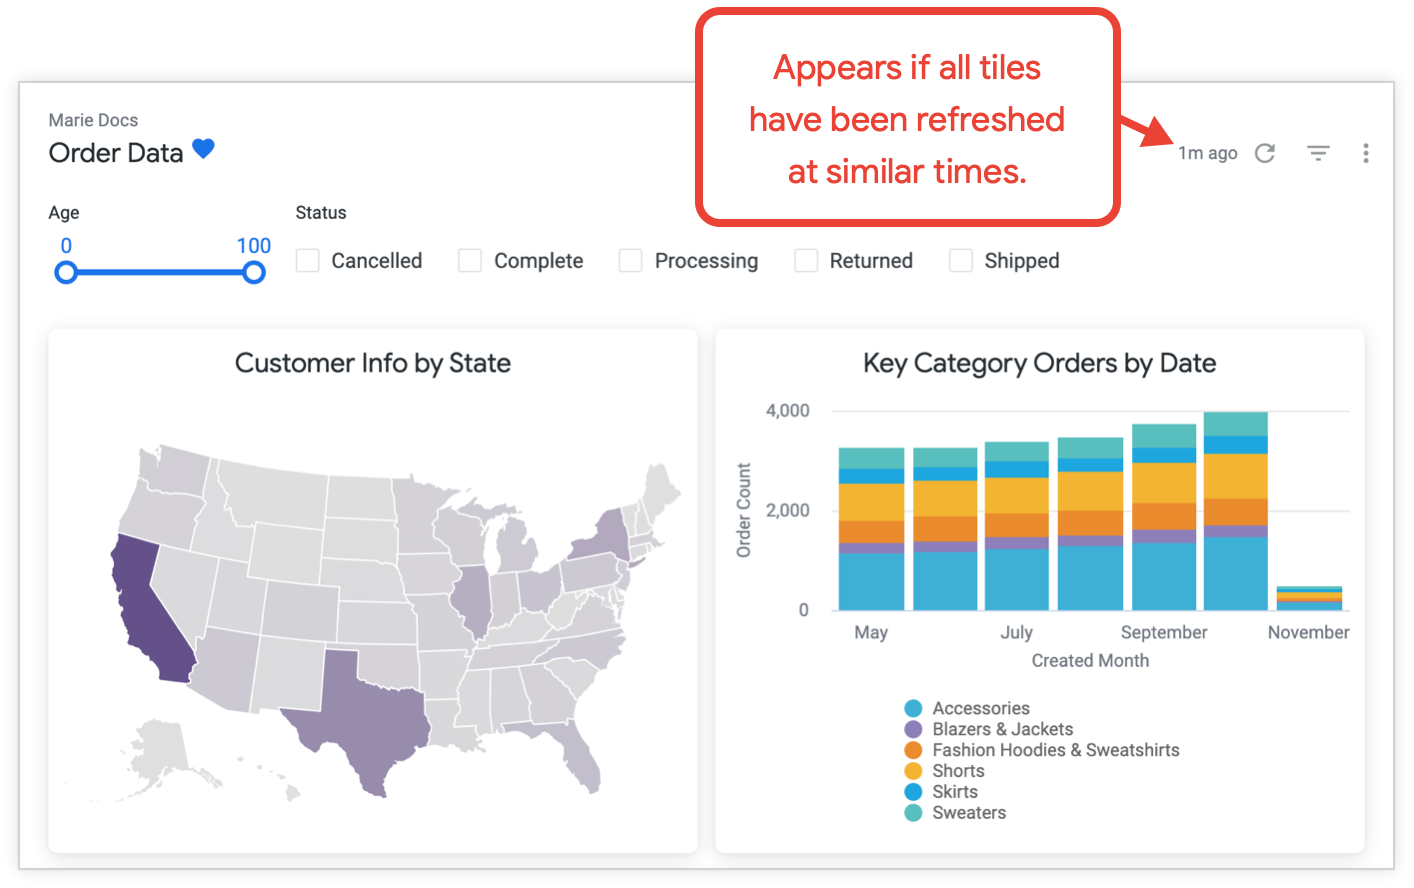
If data has been refreshed from the database at different times for different tiles, you can see when each tile was last refreshed in the tile's three-dot menu.
If you want to manually update the data on a dashboard, you have several options:
Click the circular reload data icon . In most cases, this is the best option for updating all your dashboard's data. This method will apply any changes that are made to dashboard filters; and, depending on the cache settings for your data, this updates the dashboard with any changed data in the cache or refreshes the data for each tile from the database.
Select Clear cache and refresh from the three-dot menu in the upper right of the dashboard. This method refreshes the data for all tiles on the dashboard from the database and resets the data cached for the dashboard.
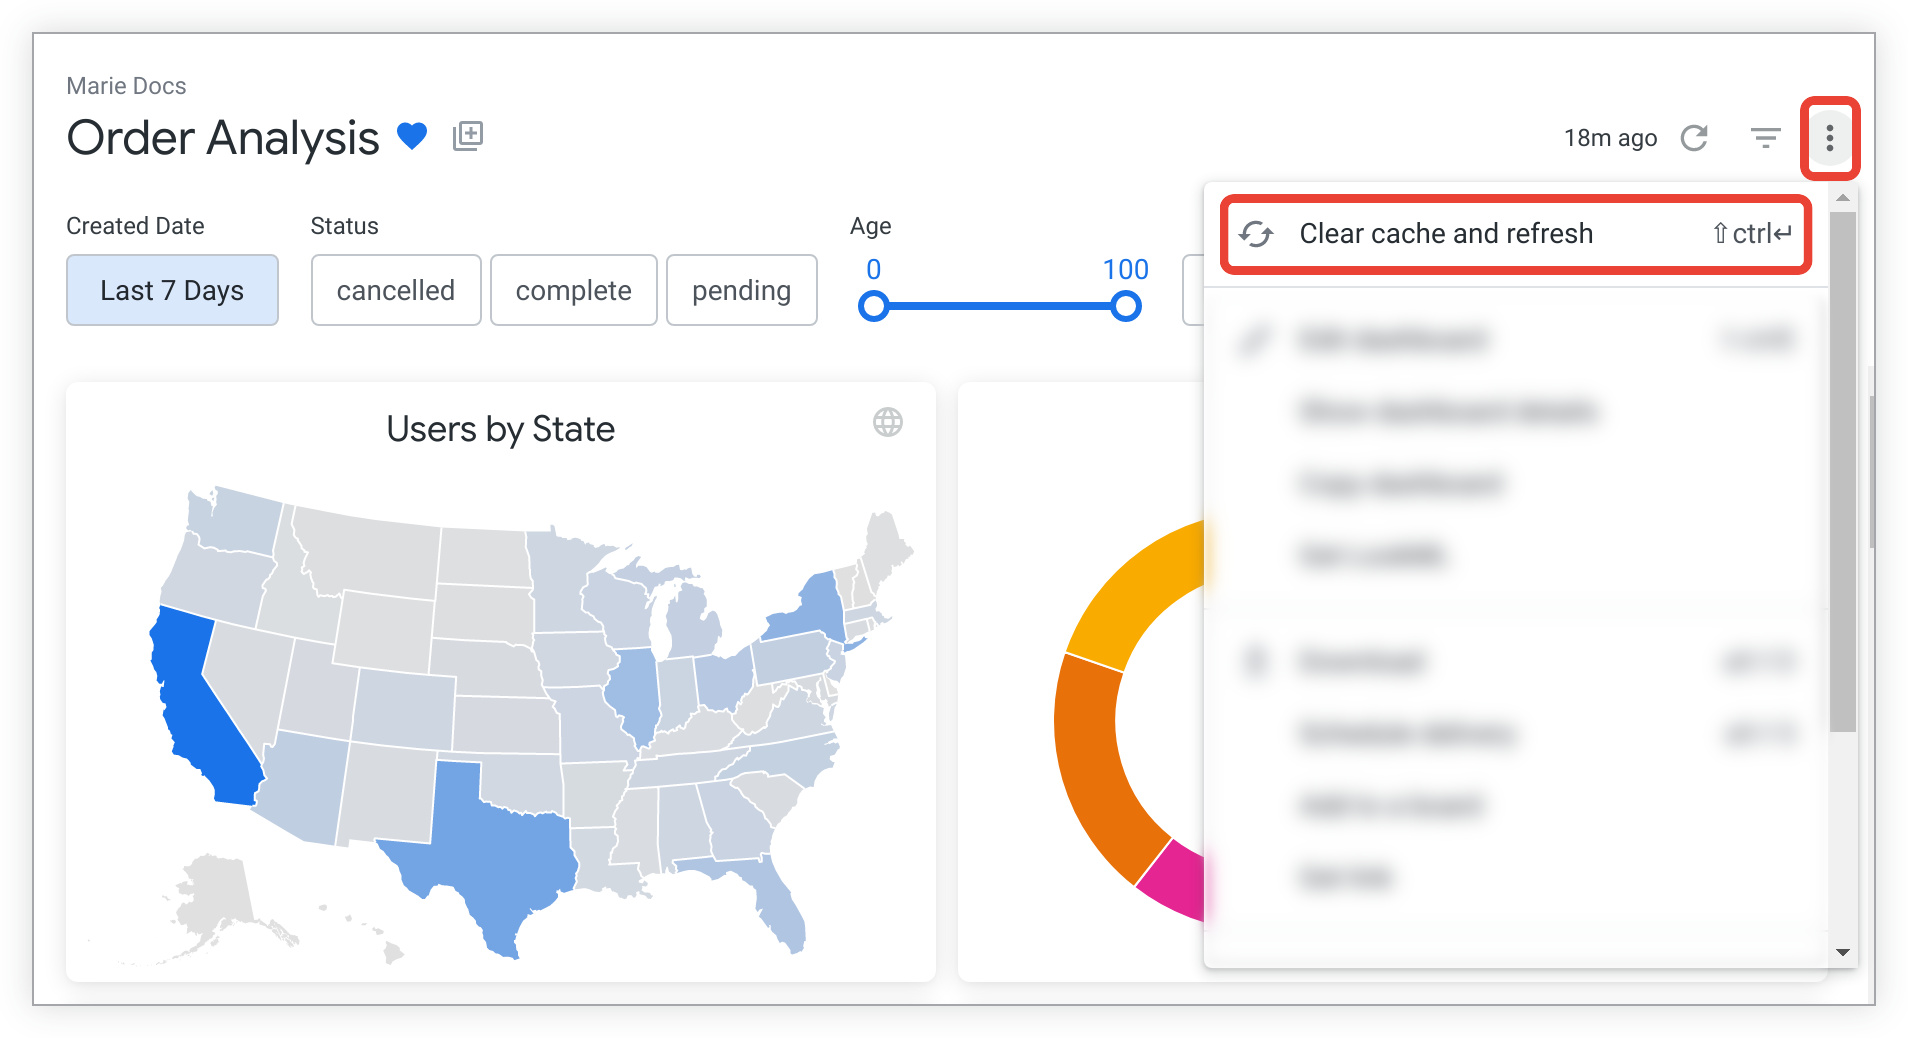
Using the dashboard-level Clear cache and refresh option on a dashboard that contains many tiles, or tiles built on very large queries or Looks, can cause a strain on your database.
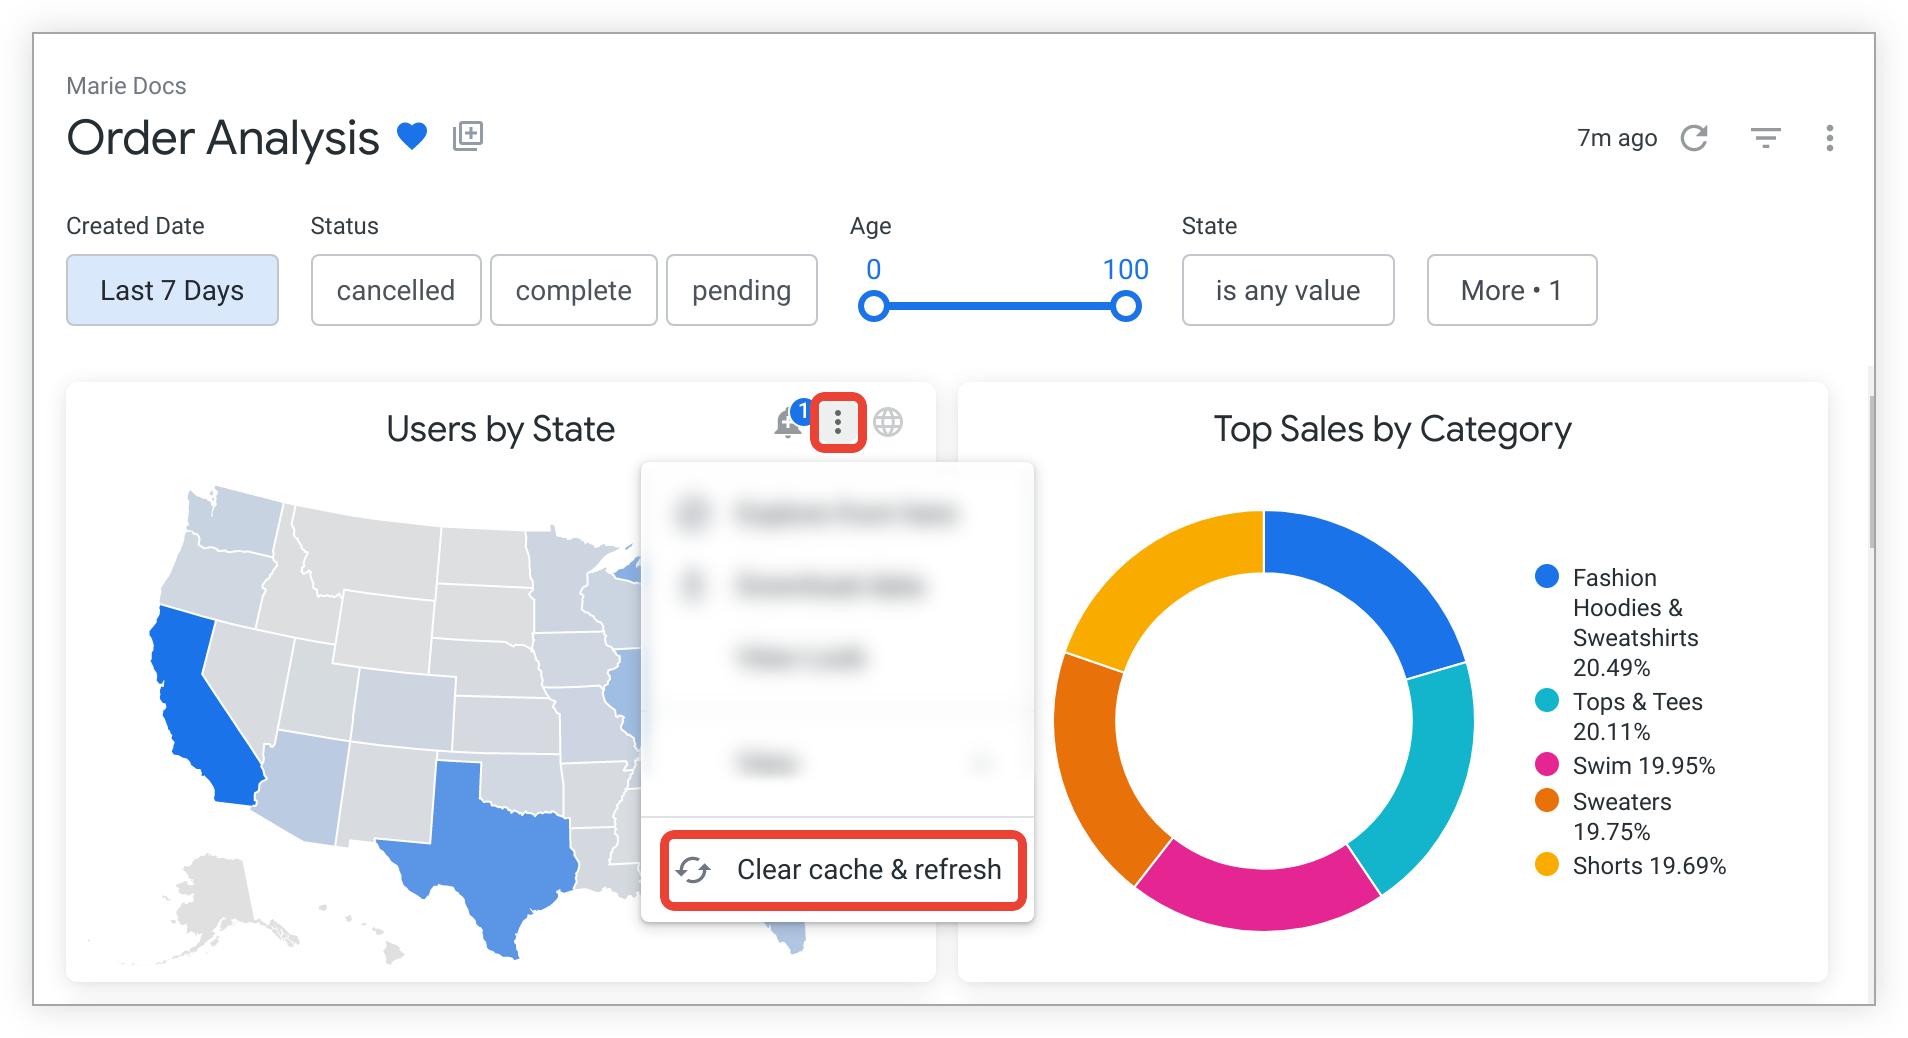
If you want to refresh the data of only a few tiles on your dashboard, it may be faster and less load on your database to use the Clear cache & refresh option in the three-dot Tile actions menu of each tile, which refreshes the data for individual tiles from the database and resets their cached data.
Copying dashboards
If you have Manage Access, Edit access to the folder in which a dashboard is located, you will see the Copy dashboard option in the dashboard's three-dot menu. Selecting this option lets you make a copy of the dashboard and place it into any other folder for which you have Manage Access, Edit access.
If the dashboard you are copying contains Look-linked tiles, the Looks those tiles are based on will also be copied and placed in the destination folder.
Getting a dashboard's link
Selecting the Get link option from the dashboard's three-dot menu reveals a pop-up that contains a link to the dashboard, which can be copied and shared.
By default, the Include current filter values in URL switch is enabled, and the link contains the URL parameters for the filter values as they currently appear on the dashboard. This means that if you have temporarily changed the filter values away from the default values, the link displays the dashboard with the changed filter values. If you have not temporarily changed any filter values, the link displays the dashboard with default filter values. The link also displays any cross-filters that are currently applied to the dashboard, if cross-filtering is enabled.
You can also view the dashboard slug by selecting Get link. The slug is a randomly chosen short string that takes the place of the content ID value in a URL. For example, in this dashboard URL, https://docserver.cloud.looker.com/dashboards/CQ1fu99Z9Y1ggq2wcHDfMm, the string CQ1fu99Z9Y1ggq2wcHDfMm is the slug.
If you disable the Include current filter values in URL switch, the pop-up contains a shorter link, which displays the dashboard with default filter values and no cross-filters applied.
To view the dashboard, anyone with the link must have access to the Looker instance on which the dashboard is saved, as well as access to the dashboard and models that the tiles are based on.
Getting the LookML from a dashboard
If you have the see_lookml permission, the dashboard menu displays an option to Get LookML.
To get the dashboard LookML or aggregate table LookML for a dashboard, select Get LookML from the dashboard's three-dot menu, and then choose the Dashboard tab or the Aggregate Tables tab, respectively.
Getting dashboard LookML from a dashboard
To get the dashboard LookML for a dashboard, select the Dashboard tab in the Get LookML window.
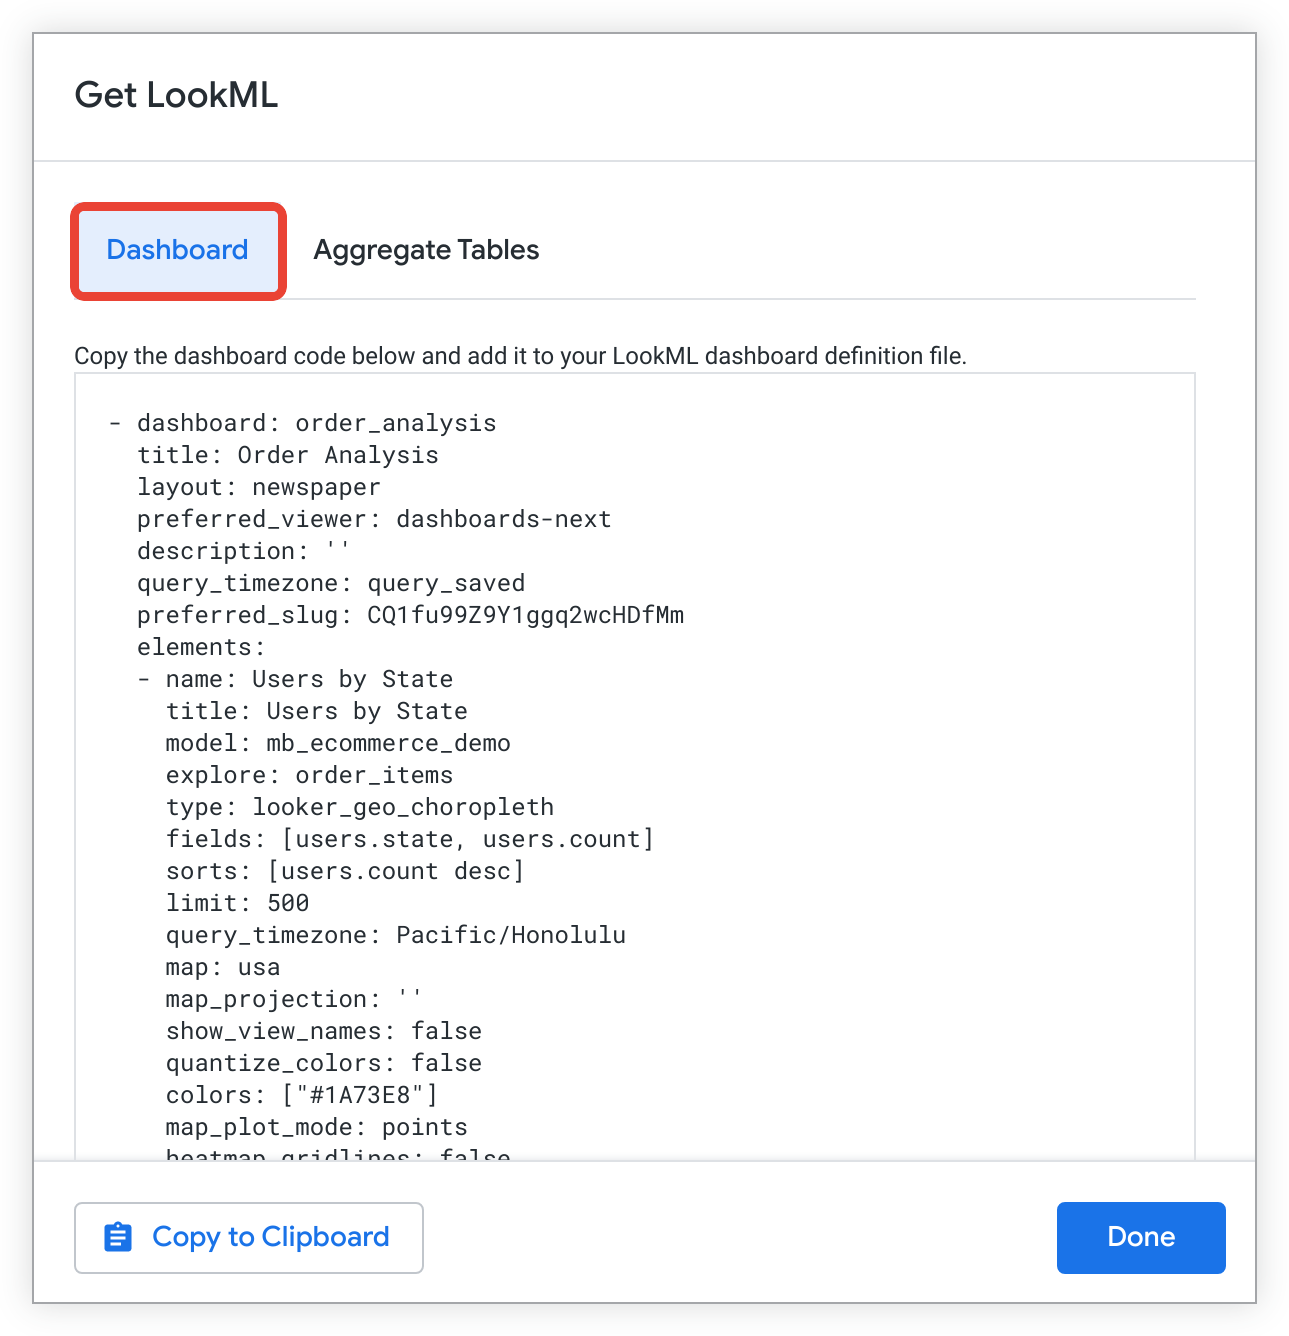
You can then select Copy to Clipboard to copy the dashboard LookML and use it to create a LookML dashboard.
Getting aggregate table LookML from a dashboard
To get the aggregate table LookML for your dashboard tiles, select the Aggregate Tables tab in the Get LookML window.
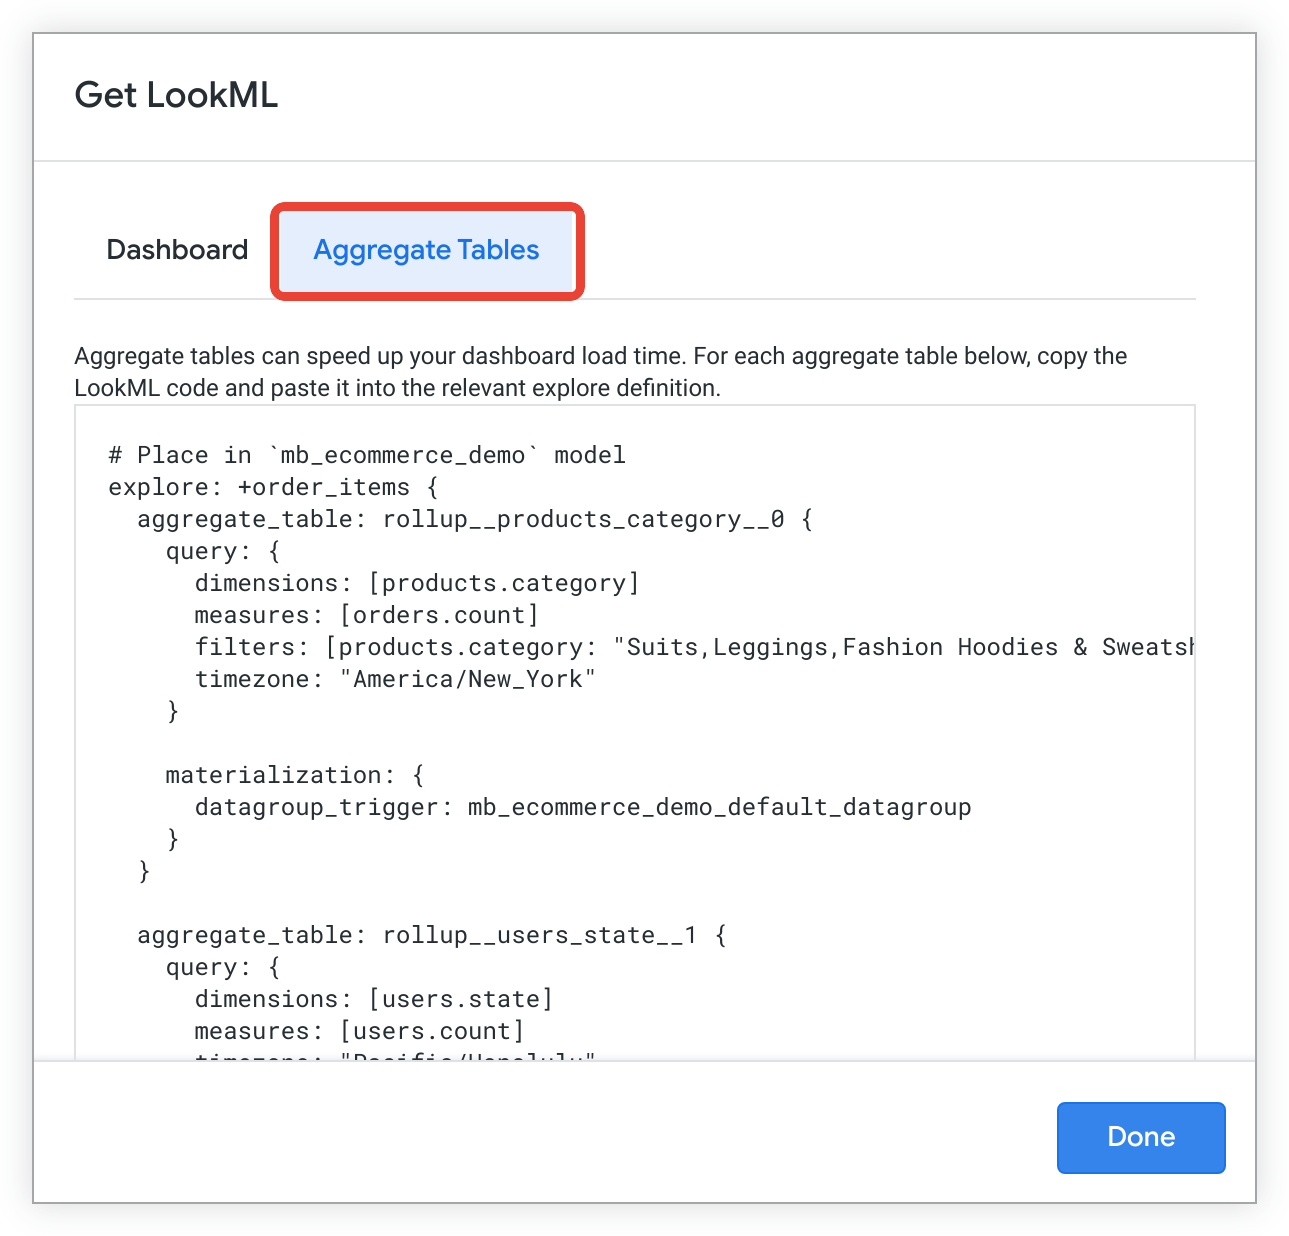
Aggregate table LookML is used to define aggregate tables, which make use of Looker's aggregate awareness logic to optimize the number of queries made on large database tables. This can improve query and dashboard performance.
To learn more about how to use the aggregate table LookML that is generated through the Get LookML option, see the aggregate_table parameter documentation page.
Viewing the LookML for a LookML dashboard
If you have the see_lookml permission, you can go to the LookML for a LookML dashboard by selecting the Go to LookML option from the dashboard menu.
When you select Go to LookML, Looker navigates to the dashboard file in which the LookML dashboard is defined.
Adding dashboards to boards
You can add dashboards to boards in several ways:
- Adding the dashboard to a board from a board
- Adding the dashboard to a board from a folder
- Adding the dashboard to a board from a dashboard
- Adding with the Add to boards icon on a dashboard
Downloading a dashboard
To learn about downloading data from your dashboard or from one of its tiles, visit the Downloading content documentation page.
Getting an embed URL for a dashboard
To generate and copy either a private embed URL or a signed embed URL to embed your dashboard, select Get embed URL from the three-dot dashboard menu.
Once you've generated and copied an embed URL, you can paste the embed URL into a new browser window or tab to preview the embedded dashboard. You can also use the private URL to embed the dashboard in an iframe.
Keyboard shortcuts you can use when viewing dashboards
To see the keyboard shortcuts you can use when viewing dashboards, visit the Keyboard shortcuts in Looker documentation page.
