Looker에서 데이터를 쿼리하고 시각화하며 쿼리 결과를 공유하고 재사용할 수 있는 Look으로 저장하는 방법을 알아보세요.
이 빠른 시작에서는 Looker(Google Cloud 핵심 서비스) 인스턴스에서 Look을 빌드하는 과정을 안내합니다. 사전 빌드된 중급 전자상거래 Explore의 샘플 데이터를 사용하여 다음 테이블 차트를 만든 다음 차트를 Look으로 저장합니다.
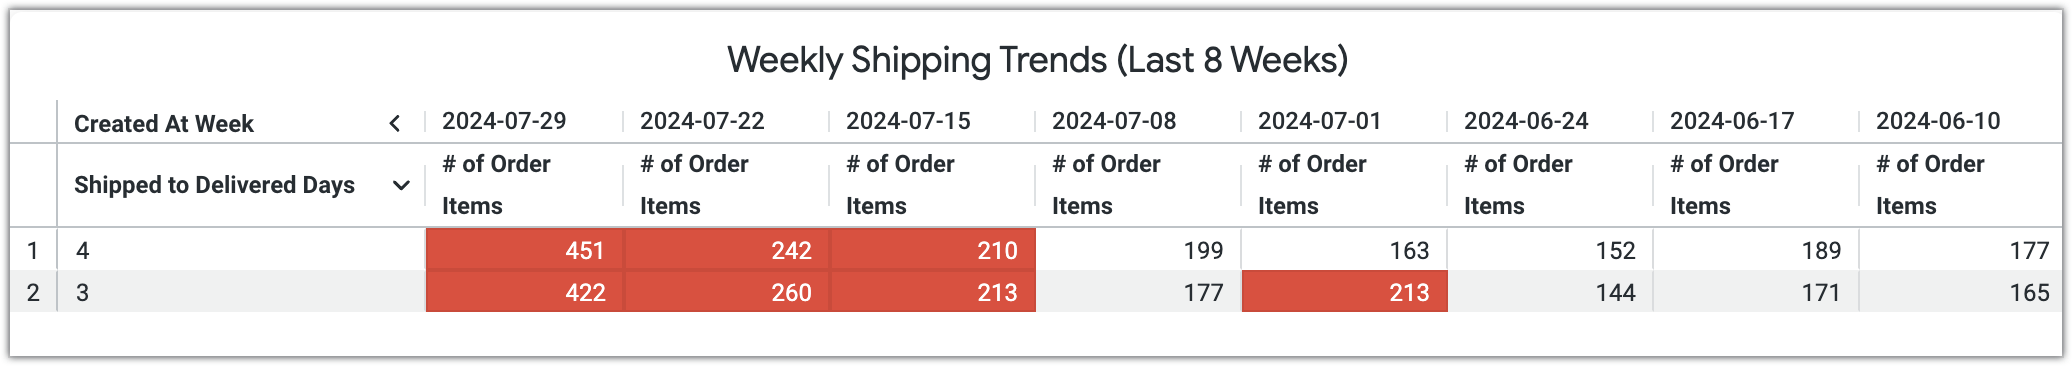
생성할 테이블 차트에는 주간 배송 동향이 표시되며, 조건부 서식(예: 빨간색 배경)을 사용하여 잠재적인 지연(이 경우 200개 초과의 주문 상품이 배송되는 데 2일이 넘게 걸린 주)을 강조 표시합니다. 다음 테이블은 Look을 빌드하는 데 사용할 쿼리 결과의 예시입니다.
생성된 주
2024-07-29
2024-07-22
2024-07-15
2024-07-08
2024-07-01
2024-06-24
2024-06-17
2024-06-10
발송 후 배송 완료된 기간
주문 상품 수
주문 상품 수
주문 상품 수
주문 상품 수
주문 상품 수
주문 상품 수
주문 상품 수
주문 상품 수
4
451
242
210
199
163
152
189
177
3
422
260
213
177
213
144
171
165
시작하기 전에
이 빠른 시작을 따라하려면 샘플 LookML 프로젝트가 포함된 Looker(Google Cloud 핵심 서비스) 인스턴스에 액세스할 수 있어야 합니다. 샘플 프로젝트에는 이 빠른 시작에서 사용되는 사전 빌드된 중급 전자상거래 Explore가 포함되어 있습니다.
Explore로 이동
중급 전자상거래 Explore로 이동하려면 다음 단계를 따르세요.
Looker에서 기본 메뉴menu를 클릭하여 기본 탐색 메뉴를 펼칩니다.
기본 탐색 메뉴에서 Explore를 선택합니다.
Z) 샘플 LookML(또는 인스턴스의 해당 모델 이름)을 펼쳐 Explore 목록을 펼칩니다.
2) 중급 전자상거래 Explore를 클릭하여 Explore 페이지를 엽니다.
필드 및 피벗 데이터 선택
쿼리를 빌드하려면 다음 단계를 따르세요.
필드 선택 도구에서 주문 상품 섹션을 펼칩니다.
필드 선택 도구의 측정기준 섹션에서 만든 날짜를 펼친 다음 주 필드 위로 커서를 가져가고 데이터 피벗 아이콘 subdirectory_arrow_right
을 선택하여 결과 테이블에 주를 열로 표시합니다.
기타 날짜를 펼친 다음 발송 후 배송 완료된 기간 필드를 선택하여 각 주문 상품이 발송된 후 배송되는 데 걸린 시간을 표시합니다.
필드 선택 도구의 측정 섹션에서 주문 상품 수 필드를 선택하여 주와 배송 기간의 각 조합에 대한 총 주문 상품 수를 표시합니다.
필터 추가 및 쿼리 실행
다음으로 다음 필드에 필터를 추가하여 쿼리 결과를 상세 검색합니다.
생성된 주: 이 필드의 필터에는 지난 8주간의 데이터만 포함된 is in the past 8 weeks 조건이 포함됩니다.
발송 후 배송 완료된 기간:
이 필드의 첫 번째 필터에는 null 값을 제외하는 is not null 조건이 있습니다.
이 필드의 두 번째 필터는 2일보다 긴 배송 기간만 포함하는 is >2 조건을 갖습니다.
이러한 필터를 쿼리에 적용하려면 다음 단계를 따르세요.
각 필터에 대해 Explore 페이지의 필터 섹션에서 + 필터를 클릭하여 필터 추가 창을 엽니다.
필터 추가 창에서 적절한 조건을 선택하고 필요에 따라 필터 값을 추가하여 각 필터를 만듭니다.
첫 번째 필터의 경우 생성된 주 필드를 선택하고 마지막에 있음 조건을 선택합니다. 텍스트 입력란에 값 8을 입력하고 기간 목록에서 주를 선택합니다.
다음 필터로 발송 후 배송 완료된 기간 필드를 선택하고 null이 아님 조건을 선택합니다.
마지막 필터로 발송 후 배송 완료된 기간 필드를 선택합니다. 필터 조건에서 보다 큼을 선택합니다. 텍스트 입력란에 값 2를 입력합니다.
실행을 클릭하여 쿼리를 실행하고 결과를 표시합니다.
이제 Explore의 데이터 섹션에 지난 8주간 각 배송 기간의 주문 상품 수가 표시됩니다.
시각화 맞춤설정
시각화를 Look으로 저장하기 전에 기본 차트 유형을 테이블 차트로 변경하고 조건부 서식을 적용하여 배송 지연이 발생할 수 있는 항목을 강조 표시합니다. 이렇게 변경하려면 다음 단계를 따르세요.
[[["이해하기 쉬움","easyToUnderstand","thumb-up"],["문제가 해결됨","solvedMyProblem","thumb-up"],["기타","otherUp","thumb-up"]],[["이해하기 어려움","hardToUnderstand","thumb-down"],["잘못된 정보 또는 샘플 코드","incorrectInformationOrSampleCode","thumb-down"],["필요한 정보/샘플이 없음","missingTheInformationSamplesINeed","thumb-down"],["번역 문제","translationIssue","thumb-down"],["기타","otherDown","thumb-down"]],["최종 업데이트: 2024-12-22(UTC)"],[],[],null,["# Quickstart: Build a Look with sample data\n\nBuild a Look with sample data\n=============================\n\nLearn how to query and visualize data in Looker and to save your query results as a [Look](/looker/docs/saving-and-editing-looks) that you can share and reuse.\n\nThis quickstart guides you through building a Look on your Looker (Google Cloud core) instance. You'll use sample data from the prebuilt **Intermediate Ecommerce** Explore to create the following table chart, and then you'll save the chart as a Look.\n\nThe table chart that you'll create will display weekly shipping trends, using conditional formatting (such as a red background) to highlight potential delays (in this case, weeks where more than 200 order items took over two days to be delivered). The following table is an example of the query results that you'll use to build your Look:\n\nBefore you begin\n----------------\n\nTo follow along with this quickstart, you'll need access to a Looker (Google Cloud core) instance that includes the [sample LookML project](/looker/docs/looker-core-sample-project). The sample project includes the prebuilt **Intermediate Ecommerce** Explore that is used in this quickstart.\n| **Note:** The **Intermediate Ecommerce** Explore is found in the **Z) Sample LookML** model. This model name may differ on your Looker instance.\n\nYou'll also need to have a the following [Looker permissions](/looker/docs/admin-panel-users-roles#permissions_list) on your Looker (Google Cloud core) instance (or a Looker role that includes these permissions):\n\n- `access_data`: Access the sample data in the **Intermediate Ecommerce** Explore.\n- `explore`: Access [the Explore page](/looker/docs/viewing-and-interacting-with-explores#the_explore_page) and run queries in the **Intermediate Ecommerce** Explore.\n- `save_looks` (and its parent permission, `save_content`): Save the visualization as a Look.\n- `see_looks`: View the Look that you'll create in this quickstart.\n\n| **Note:** If you plan to use this Look in a dashboard, you may also need additional permissions, such as `save_dashboards` and `see_user_dashboards`, as described in the [Build a dashboard with sample data](/looker/docs/looker-core-create-dashboard-quickstart) quickstart.\n\nNavigate to the Explore\n-----------------------\n\nTo navigate to the **Intermediate Ecommerce** Explore, follow these steps:\n\n1. In Looker, click **Main menu** menu to expand the main navigation menu.\n2. In the main navigation menu, select **Explore**.\n3. Expand **Z) Sample LookML** (or the corresponding model name on your instance) to expand the list of Explores.\n4. Click **2) Intermediate Ecommerce** Explore to open the Explore page.\n\nSelect fields and pivot data\n----------------------------\n\nTo build the query, follow these steps:\n\n1. In the field picker, expand the **Order Items** section.\n2. In the **Dimensions** section of the field picker, expand **Created At Date** , and then hold your cursor over the **Week** field and select the **Pivot data** icon to display the weeks as columns in the results table.\n3. Expand **Other Dates** , and then select the **Shipped to Delivered Days** field to show how long it took each order to be delivered after it was shipped.\n4. In the **Measures** section of the field picker, select the **# of Order Items** field to show the total number of order items for each combination of week and shipping duration.\n\nAdd filters and run the query\n-----------------------------\n\nNext, you will add filters on the following fields to refine the query results:\n\n- **Created At Week** : The filter on this field will have the condition `is in the last 8 weeks`, which includes only data from the past 8 weeks.\n- **Shipped to Delivered Days** :\n - The first filter on this field will have the condition `is not null`, which excludes null values.\n - The second filter on this field will have the condition `is \u003e2`, which includes only shipping durations that are longer than 2 days.\n\nTo apply these filters to your query, follow these steps:\n\n1. For each filter, in the **Filters** section of the Explore page, click **+ Filter** to open the **Add Filter** window.\n2. In the **Add Filter** window, create each filter by selecting the appropriate condition and adding filter values as needed:\n - For the first filter, select the **Created At Week** field and choose the **is in the last** condition. In the text input field, enter the value `8`, and select **weeks** from the list of timeframes.\n - For the next filter, select the **Shipped to Delivered Days** field and choose the **is not null** condition.\n - For the final filter, select the **Shipped to Delivered Days** field. For the filter condition, select **is \\\u003e** . In the text input field, enter the value `2`.\n3. Click **Run** to run the query and display the results.\n\nThe **Data** section of the Explore now shows the number of order items for each shipping duration over the past eight weeks.\n\nCustomize the visualization\n---------------------------\n\nBefore saving the visualization as a Look, change the default chart type to a table chart and apply conditional formatting to highlight potential shipping delays. To make these changes, follow these steps:\n\n1. In the **Visualization** section of the Explore page, click the **Visualizations** bar to open the visualization editor.\n2. In the **Visualization** menu, select **Table** to display the query results as a table chart.\n3. Click **Edit** tune to open the visualization editor.\n4. In the **Series** tab, expand **Order Items # of Items** and disable the [**Cell Visualization** option](/looker/docs/table-options#cell_visualization).\n5. In the **Formatting** tab of the visualization editor, confirm that the [**Enable conditional formatting** option](/looker/docs/table-options#enable_conditional_formatting) is enabled.\n6. In the **Rules** section of the **Formatting** tab, if there is an existing conditional formatting rule, replace the default conditions with the following conditions. If there are no rules, click **Add a Rule** to create a new custom formatting rule and apply the following conditions.\n\n - In the **Apply to** section, choose **Select fields...** and enter the **Order Items # of Order Items** field in the text input field.\n - In the **Format** section, choose the **If value is greater than** condition and enter the value `200`.\n - In the **Styles** section, select the existing color swatch in the **Background color** section, and then select a background color (in this example, select the color red).\n7. Click **Add Rule** to save the conditional formatting rule.\n\nNow that you've customized the visualization and applied conditional formatting, Looker highlights cells in the table chart where more than 200 order items took more than two days to be delivered.\n\nSave the visualization as a Look\n--------------------------------\n\nTo save the table chart as a Look, follow these steps:\n\n1. Click the **Explore actions** gear icon settings in the Explore header.\n2. Select **Save...** , and then select **As a Look**.\n3. In the **Save Look** window, enter a title for the Look in the **Title** field.\n4. In the **Folder** section, choose a folder to save the Look to.\n5. Click **Save** to save the Look to that folder, or click **Save \\& View Look** to save and immediately open the Look.\n\nNow that you've saved the visualization as a Look, you can access it again for further analysis, share it with others, or incorporate it into dashboards for broader visibility. You can also use the Look in a dashboard, as described in the [Build a dashboard with sample data](/looker/docs/looker-core-create-dashboard-quickstart).\n\nWhat's next\n-----------\n\n- [Quickstart: Build a dashboard with sample data](/looker/docs/looker-core-create-dashboard-quickstart)\n- [Creating and editing Explores](/looker/docs/creating-and-editing-explores)\n- [Filtering and limiting data](/looker/docs/filtering-and-limiting)\n- [Creating user-defined dashboards](/looker/docs/creating-user-defined-dashboards)\n- [Sharing data](/looker/docs/sharing-data)"]]