BigQuery Data Transfer Service のログをモニタリングして表示する
BigQuery Data Transfer Service のモニタリングとロギングでは、サービスのワークロードのパフォーマンスとステータスに関する情報が提供されます。BigQuery Data Transfer Service では、モニタリング データが Cloud Monitoring にエクスポートされます。
BigQuery Data Transfer Service をモニタリングする
モニタリング指標は、次の目的で使用できます。
- データ移転構成の使用状況とパフォーマンスを評価する。
- 問題のトラブルシューティングを行う。
- 転送実行のステータスをモニタリングする。
Monitoring でカスタム ダッシュボードの作成、アラートの設定、指標の照会を行うには、 Google Cloud コンソールまたは Monitoring API を使用します。
Metrics Explorer で転送データを表示する
Google Cloud コンソールで、[モニタリング] ページに移動します。
ナビゲーション パネルで、[Metrics Explorer] をクリックします。
プロジェクトを選択します。
[Find resource type and metric] ボックスに、次のように入力します。
- [Resource type] に「
BigQuery DTS Config」と入力します。 [指標] で、転送構成のモニタリング指標に一覧表示された指標のいずれか(
Completed run countなど)を選択します。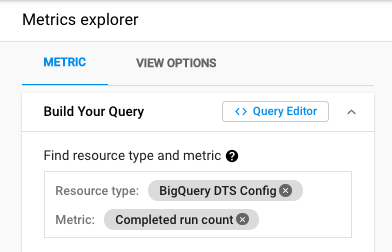
- [Resource type] に「
省略可: 配置指定子や削減指定子などのパラメータを選択します。
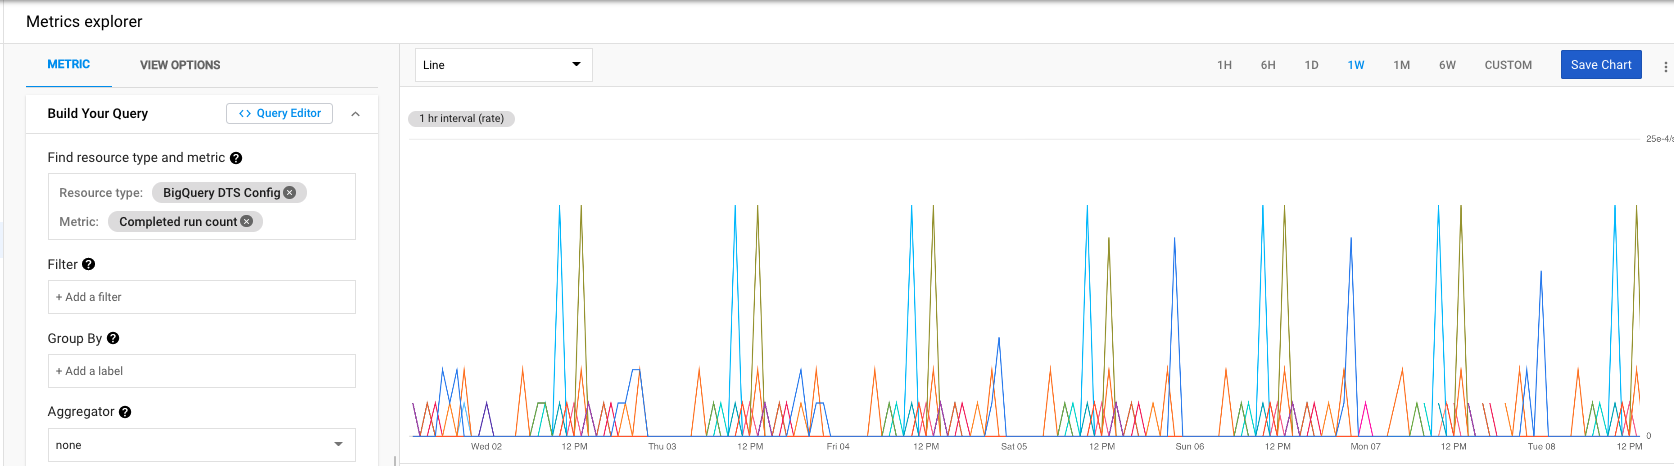
これらの指標は [Metrics Explorer] ウィンドウに表示されます。
Cloud Monitoring アラートを定義する
BigQuery Data Transfer Service の指標では、Monitoring アラートを定義できます。
Google Cloud コンソールで、[モニタリング] ページに移動します。
ナビゲーション ペインで [Alerting] > [Create policy] を選択します。
アラート ポリシーと背景コンセプトの詳細については、アラート ポリシーの種類をご覧ください。
[Add Condition] をクリックし、条件タイプを選択します。
指標とフィルタを選択します。指標のリソースタイプは BigQuery DTS Config です。
[Save Condition] をクリックします。
ポリシー名を入力し、[Save Policy] をクリックします。
アラート ポリシーとコンセプトの詳細については、アラートの概要をご覧ください。
Cloud Monitoring カスタム ダッシュボードを定義する
BigQuery Data Transfer Service の指標を使用したカスタム ダッシュボードを作成できます。
Google Cloud コンソールで、[モニタリング] ページに移動します。
ナビゲーション パネルで [Dashboards] > [Create Dashboard] を選択します。
[グラフを追加] をクリックします。
グラフにタイトルを付けます。
指標とフィルタを選択します。指標のリソースタイプは BigQuery DTS Config です。
[保存] をクリックします。
詳細については、カスタム ダッシュボードを管理するをご覧ください。
指標報告の頻度と保持
BigQuery Data Transfer Service 実行の指標は、1 分単位のバッチで Monitoring にエクスポートされます。モニタリング データは 6 週間保持されます。
ダッシュボードでは、1h(1 時間)、6H(6 時間)、1D(1 日)、1W(1 週間)、6W(6 週間)のデフォルト間隔のデータ分析結果を確認できます。1M(1 分)から 6W(6 週間)の任意の間隔で手動で分析をリクエストできます。
転送構成の指標をモニタリングする
BigQuery Data Transfer Service 構成の次の指標が、Monitoring にエクスポートされます。
| 指標 | 説明 |
|---|---|
| 実行のレイテンシ分布 | 各転送実行の実行時間の分布(転送構成ごと、秒単位)。 |
| アクティブな実行の数 | 実行中または保留中の転送実行の数(転送構成ごと)。 |
| 完了した実行の数 | 一定期間内の完了した転送実行の数(転送構成ごと)。 |
指標のディメンションをフィルタする
指標は、BigQuery Data Transfer Service の構成ごとに集計されます。集計された指標は、次のディメンション(*)でフィルタ処理できます。
| プロパティ | 説明 |
|---|---|
TRANSFER_STATE |
転送実行の現在の転送状態を表します。このディメンションは以下の値のいずれかになります。
|
ERROR_CODE |
転送実行の最終的なエラーコードを表します。このディメンションは以下の値のいずれかになります。
|
RUN_CAUSE |
転送実行がトリガーされた方法を表します。このディメンションは以下の値のいずれかになります。
|
BigQuery Data Transfer Service のログ
BigQuery Data Transfer Service は実行されるたびに、Cloud Logging によりロギングされます。ロギングがは、すべてのデータ転送で自動的に有効になります。
必要なロール
ログ閲覧者のロール(roles/logging.viewer)は、Logging のすべての機能に対する読み取り専用権限を付与します。Logging データに適用される Identity and Access Management(IAM)の権限とロールの詳細については、Logging アクセス制御ガイドをご覧ください。
ログを表示する
ログを表示するには、[ログ エクスプローラ] ページに移動します。
BigQuery Data Transfer Service のログには、まず転送構成でインデックスが作成され、次に個々の転送実行でインデックスが作成されます。
転送実行ログを表示する
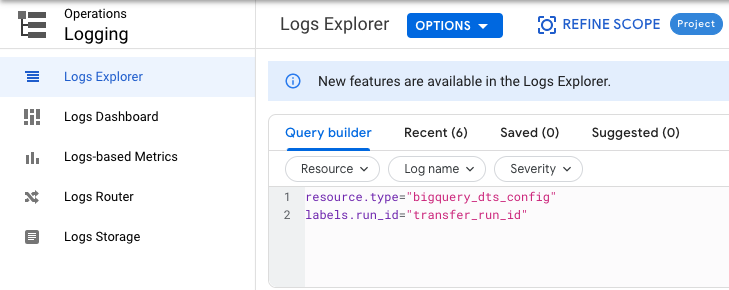
特定の転送 run_id のログエントリのみを表示するには、クエリビルダーで次のフィルタを追加します。
resource.type="bigquery_dts_config"
labels.run_id="transfer_run_id"
転送構成ログを表示する
特定の転送 config_id のログエントリを表示するには、クエリビルダーで次のフィルタを追加します。
resource.type="bigquery_dts_config"
resource.labels.config_id="transfer_config_id"
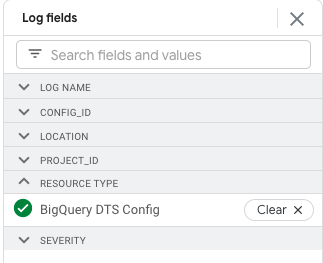
すべてのログを表示
BigQuery Data Transfer Service のすべてのログを表示するには、次のいずれかを行います。
[フィールド] ペインの [リソースタイプ] で、[BigQuery DTS 構成] を選択します。
[クエリビルダー] で、以下のフィルタを追加します。
resource.type="bigquery_dts_config"
ログ エクスプローラの使用方法について詳しくは、ログ エクスプローラの使用をご覧ください。
ログ形式
BigQuery Data Transfer Service では、次の形式でメッセージが記録されます。
{
  "insertId": "0000000000",
  "jsonPayload": {
    "message": "DTS transfer run message."
  },
  "resource": {
    "type": "bigquery_dts_config",
    "labels": {
      "project_id": "my_project_id",
      "config_id": "transfer_config_id",
      "location": "us"
    }
  },
  "timestamp": "2020-11-25T04:45:48.545732221Z",
  "severity": "INFO",
  "labels": {
    "run_id": "transfer_run_id"
  },
  "logName": "projects/your_project_id/logs/bigquerydatatransfer.googleapis.com%2Ftransfer_config",
  "receiveTimestamp": "2020-11-25T04:45:48.960214929Z"
}
ログの内容
BigQuery Data Transfer Service ログエントリには、転送実行のモニタリングとデバッグに役立つ情報が含まれています。ログエントリには次のタイプの情報が含まれています。
timestamp: ログエントリの経過時間を計算し、ログの保持期間を適用するために使用されます。severity:INFO、WARNING、ERRORのいずれかです。message_text: 転送実行の現在のステータスを説明する文字列が入ります。
次のステップ
- Monitoring の詳細を確認する。
- Cloud Audit Logs と Cloud Logging の概要を確認する。