This document is the fourth in a four-part series about designing, building, and deploying microservices. This series describes the various elements of a microservices architecture. The series includes information about the benefits and drawbacks of the microservices architecture pattern, and how to apply it.
- Introduction to microservices
- Refactoring a monolith into microservices
- Interservice communication in a microservices setup
- Distributed tracing in a microservices application (this document)
This series is intended for application developers and architects who design and implement the migration to refactor a monolith application to a microservices application.
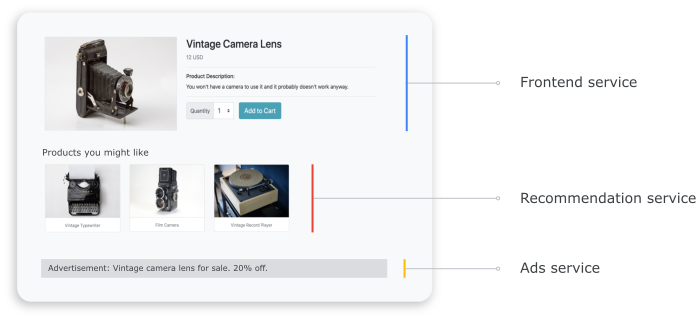
In a distributed system, it's important to know how a request flows from one service to another and how long it takes to perform a task in each service. Consider the microservices-based Online Boutique application that you deployed in the previous document, Refactoring a monolith into microservices. The application is composed of multiple services. For example, the following screenshot shows the product details page, which fetches information from the frontend, recommendation, and ads services.
To render the product details page, the frontend service communicates with the recommendation service and the ads service, as show in the following diagram:
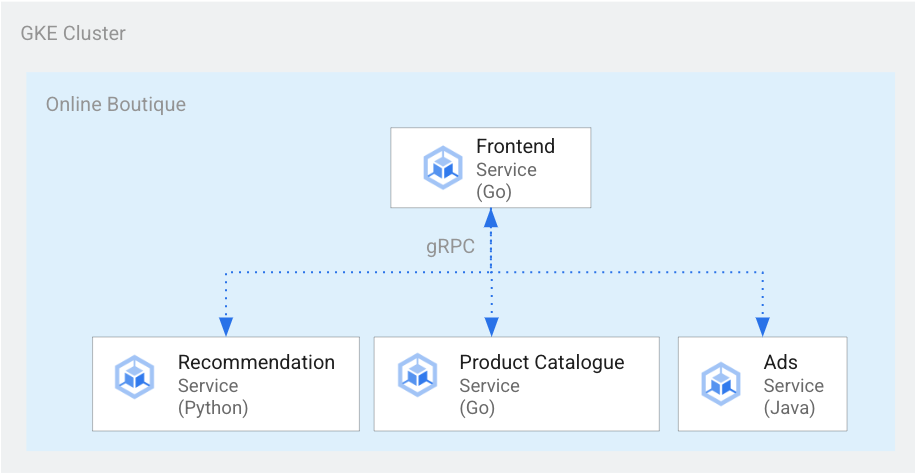
Figure 1. Services written in different languages.
In figure 1, the frontend service is written in Go. The recommendation service, which is written in Python, uses gRPC to communicate with the frontend service. The ads service, which is written in Java, also uses gRPC to communicate with the frontend service. Besides gRPC the inter-service communication method can also be in REST HTTP.
When you build such a distributed system, you want your observability tools to provide the following insights:
- The services that a request went through.
- Where delays occurred if a request was slow.
- Where an error occurred if the request failed.
- How the execution of the request was different from the normal behavior of the system.
- Whether differences in the execution of the request were related to performance (whether some service calls took a longer or shorter time than usual).
Objectives
- Use kustomize manifest files to set up the infrastructure.
- Deploy the Online Boutique example application to Google Kubernetes Engine (GKE).
- Use Cloud Trace to review a user's journey in the example application.
Costs
In this document, you use the following billable components of Google Cloud:
To generate a cost estimate based on your projected usage,
use the pricing calculator.
When you finish this document, you can avoid continued billing by deleting the resources you created. For more information, see Cleaning up.
Before you begin
If you already set up a project by completing the previous document in this series, Interservice communication in a microservices setup, you can reuse the project. Complete the following steps to enable additional APIs and set environment variables.
-
In the Google Cloud console, on the project selector page, select or create a Google Cloud project.
-
Make sure that billing is enabled for your Google Cloud project.
-
In the Google Cloud console, activate Cloud Shell.
Enable the APIs for Compute Engine, GKE, Cloud SQL, Artifact Analysis, Trace, and Container Registry:
 gcloud services enable \
   compute.googleapis.com \
   sql-component.googleapis.com \
   servicenetworking.googleapis.com\
   container.googleapis.com \
   containeranalysis.googleapis.com \
   containerregistry.googleapis.com \
   sqladmin.googleapis.com
Distributed tracing
Distributed tracing attaches contextual metadata to each request and ensures that metadata is shared between requests. You use trace points to instrument distributed tracing. For example, you can instrument your services (frontend, recommendation, and ads) with two trace points to handle a client request to view a product's details: one trace point to send the request and another trace point to receive the response. The following diagram shows how this trace point instrumentation works:

Figure 2. Each interservice call has two trace points that consist of a request-response pair.
For trace points to understand which request to execute when the service is invoked, the originating service passes a trace ID along the execution flow. The process that passes the trace ID is called metadata propagation or distributed context propagation. Context propagation transfers metadata over network calls when services of a distributed application communicate with each other during the execution of a given request. The following diagram shows the metadata propagation:

Figure 3. Trace metadata is passed between services. The metadata includes information like which service calls which and their timestamps.
In the Online Boutique example, a trace begins when a user sends an initial request to fetch product details. A new trace ID is generated, and each successive request is decorated with headers that contain contextual metadata back to the original request.
Each individual operation that is invoked as part of fulfilling the end user's request is called a span. The originating service tags each span with its own unique ID and the trace ID of the parent span. The following diagram shows a Gantt chart visualization of a trace:

Figure 4. A parent span includes the response time of child spans.
Figure 4 shows a trace tree in which the frontend service calls the recommendation service and the ads service. The frontend service is the parent span, which describes the response time as observed by the end user. The child spans describe how the recommendation service and the ads service were called and responded, including response time information.
A service mesh like Istio enables distributed tracing of service-to-service traffic without the need for any dedicated instrumentation. However, there might be situations in which you want to have more control over the traces, or you might need to trace code that isn't running within a service mesh.
This document uses OpenTelemetry to enable instrumentation of distributed microservice applications to collect traces and metrics. OpenTelemetry lets you collect metrics and traces and then export them to backends, such as Prometheus, Cloud Monitoring, Datadog, Graphite, Zipkin, and Jaeger.
Instrumentation using OpenTelemetry
The following sections show how to use context propagation to allow spans from multiple requests to be appended to a single parent trace.
This example uses the OpenTelemetry Javascript, Python, and Go libraries to instrument trace implementation for the payment, recommendation, and frontend services. Depending on the verbosity of the instrumentation, tracing data can affect on the project's cost (Cloud Trace billing). To mitigate cost concerns, most tracing systems employ various forms of sampling to capture only a certain percentage of the observed traces. In your production environments, your organization might have reasons for both what they want to sample and why. You might want to customize your sampling strategy based on managing costs, focusing on interesting traces, or filtering out noise. To learn more about sampling see OpenTelemetry Sampling.
This document uses Trace to visualize distributed traces. You use an OpenTelemetry exporter to send traces to Trace.
Register trace exporters
This section shows how to register the trace exporter in each service by adding lines to the microservice code.
For the frontend service (written in Go), the following code sample registers the exporter:
[...]
exporter, err := otlptracegrpc.New(
        ctx,
        otlptracegrpc.WithGRPCConn(svc.collectorConn))
    if err != nil {
        log.Warnf("warn: Failed to create trace exporter: %v", err)
    }
tp := sdktrace.NewTracerProvider(
        sdktrace.WithBatcher(exporter),
        sdktrace.WithSampler(sdktrace.AlwaysSample()))
    otel.SetTracerProvider(tp)
For the recommendation service (written in Python), the following code sample registers the exporter:
if os.environ["ENABLE_TRACING"] == "1":
    trace.set_tracer_provider(TracerProvider())
    otel_endpoint = os.getenv("COLLECTOR_SERVICE_ADDR", "localhost:4317")
    trace.get_tracer_provider().add_span_processor(
        BatchSpanProcessor(
            OTLPSpanExporter(
            endpoint = otel_endpoint,
            insecure = True
            )
        )
    )
For the payment service (written in Javascript), the following code sample registers the exporter:
provider.addSpanProcessor(new SimpleSpanProcessor(new OTLPTraceExporter({url: collectorUrl})));
provider.register();
Set up context propagation
The tracing system needs to follow a trace context specification that defines the format to propagate tracing context between services. Propagation format examples include Zipkin's B3 format and X-Google-Cloud-Trace.
OpenTelemetry propagates context using the global TextMapPropagator. This example uses the Trace Context propagator, which uses the W3C traceparent format. Instrumentation libraries, such as OpenTelemetry's HTTP and gRPC libraries, use the global propagator to add trace context as metadata to HTTP or gRPC requests. For context propagation to succeed, the client and server must use the same propagation format.
Context propagation over HTTP
The frontend service injects a trace context into the HTTP request headers. The backend services extracts the trace context. The following code sample shows how the frontend service is instrumented to configure the trace context:
otel.SetTextMapPropagator(
    propagation.NewCompositeTextMapPropagator(
        propagation.TraceContext{}, propagation.Baggage{}))

if os.Getenv("ENABLE_TRACING") == "1" {
    log.Info("Tracing enabled.")
    initTracing(log, ctx, svc)
} else {
    log.Info("Tracing disabled.")
}

...

var handler http.Handler = r
handler = &logHandler{log: log, next: handler}     // add logging
handler = ensureSessionID(handler)                 // add session ID
handler = otelhttp.NewHandler(handler, "frontend") // add OpenTelemetry tracing
Context propagation over gRPC
Consider the flow in which the checkout service places the order based on the product that a user selects. These services communicate over gRPC.
The following code sample uses a gRPC call interceptor that intercepts the outgoing calls and injects the trace context:
var srv *grpc.Server

// Propagate trace context always
otel.SetTextMapPropagator(
    propagation.NewCompositeTextMapPropagator(
        propagation.TraceContext{}, propagation.Baggage{}))
srv = grpc.NewServer(
    grpc.UnaryInterceptor(otelgrpc.UnaryServerInterceptor()),
    grpc.StreamInterceptor(otelgrpc.StreamServerInterceptor()),
)
After receiving the request, the payment or product catalogue service (ListProducts) extracts the context
from the request headers and uses the parent trace metadata to spawn a child span.
The following sections provide details of how to set up and review distributed tracing for the example Online Boutique application.
Deploying the application
If you already have a running application from completing the previous document in this series, Interservice communication in a microservices setup, you can skip to the next section, Reviewing traces. Otherwise, complete the following steps to deploy the example Online Boutique example:
To set up infrastructure, in Cloud Shell clone the GitHub repository:
git clone https://github.com/GoogleCloudPlatform/microservices-demo.gitFor the new deployment, reset the environment variables:
PROJECT_ID=PROJECT_ID
REGION=us-central1
GSA_NAME=microservices-sa
GSA_EMAIL=$GSA_NAME@$PROJECT_ID.iam.gserviceaccount.com
Replace the following:
- PROJECT_ID: The identifier for your project ID.
Optional: Create a new cluster or reuse an existing cluster if it exists:
gcloud container clusters create-auto online-boutique --project=${PROJECT_ID}
  --region=${REGION}
Create a Google service account:
gcloud iam service-accounts create $GSA_NAME \
  --project=$PROJECT_ID
Enable the APIs:
gcloud services enable \
monitoring.googleapis.com \
cloudtrace.googleapis.com \
cloudprofiler.googleapis.com \
  --project ${PROJECT_ID}
Grant the roles required for Cloud Tracing to the GSA:
gcloud projects add-iam-policy-binding ${PROJECT_ID} \
--member "serviceAccount:${GSA_NAME}@${PROJECT_ID}.iam.gserviceaccount.com" \
--role roles/cloudtrace.agent

gcloud projects add-iam-policy-binding ${PROJECT_ID} \
--member "serviceAccount:${GSA_NAME}@${PROJECT_ID}.iam.gserviceaccount.com" \
--role roles/monitoring.metricWriter

gcloud projects add-iam-policy-binding ${PROJECT_ID} \
--member "serviceAccount:${GSA_NAME}@${PROJECT_ID}.iam.gserviceaccount.com" \
--role roles/cloudprofiler.agent

gcloud iam service-accounts add-iam-policy-binding ${GSA_EMAIL} \
--role roles/iam.workloadIdentityUser \
--member "serviceAccount:${PROJECT_ID}.svc.id.goog[default/default]"
Annotate your Kubernetes service account (
default/defaultfor the default namespace) to use the Google IAM service account:kubectl annotate serviceaccount default \ iam.gke.io/gcp-service-account=${GSA_EMAIL}Enable Cloud Operations for GKE configuration; that enables tracing:
cd ~/microservices-demo/kustomize && \
kustomize edit add component components/google-cloud-operations
This will update the
kustomize/kustomization.yamlfile which could be similar to:apiVersion: kustomize.config.k8s.io/v1beta1 kind: Kustomization resources: - base components: - components/google-cloud-operations [...]Deploy the microservices:
kubectl apply -k .Check the status of the deployment:
kubectl rollout status deployment/frontend
kubectl rollout status deployment/paymentservice
kubectl rollout status deployment/recommendationservice
kubectl rollout status deployment/adservice
The output for each command looks like the following:
Waiting for deployment "
" rollout to finish: 0 of 1 updated replicas are available... deployment " " successfully rolled out Get the IP Address of the deployed application:
kubectl get service frontend-external | awk '{print $4}'Wait for the load balancer's IP address to be published. To exit the command, press
Ctrl+C. Note the load balancer IP address and then access the application at the URLhttp://IP_ADDRESS. It might take some time for the load balancer to become healthy and start passing traffic.
Reviewing traces using Cloud Trace
A user's purchase journey in the Online Boutique application has the following flow:
- The user sees a product catalog on the landing page.
- To make a purchase, the user clicks Buy.
- The user is redirected to a product details page where they add the item to their cart.
- The user is redirected to a checkout page where they can make a payment to complete the order.
Consider a scenario in which you need to troubleshoot high response times when loading the product details page. As described earlier, the product details page is comprised of multiple microservices. To determine where and why the high latency is occurring, you can view distributed tracing graphs to review the performance of the entire request across the different services.
To review the distributed tracing graphs, do the following:
- Access the application and then click any product. The product details page is displayed.
- In the Google Cloud console, go to the Trace list page and review the timeline.
- To see the distributed trace results, click Frontend in the URI column.
The Trace Waterfall View displays the spans associated with the URI:
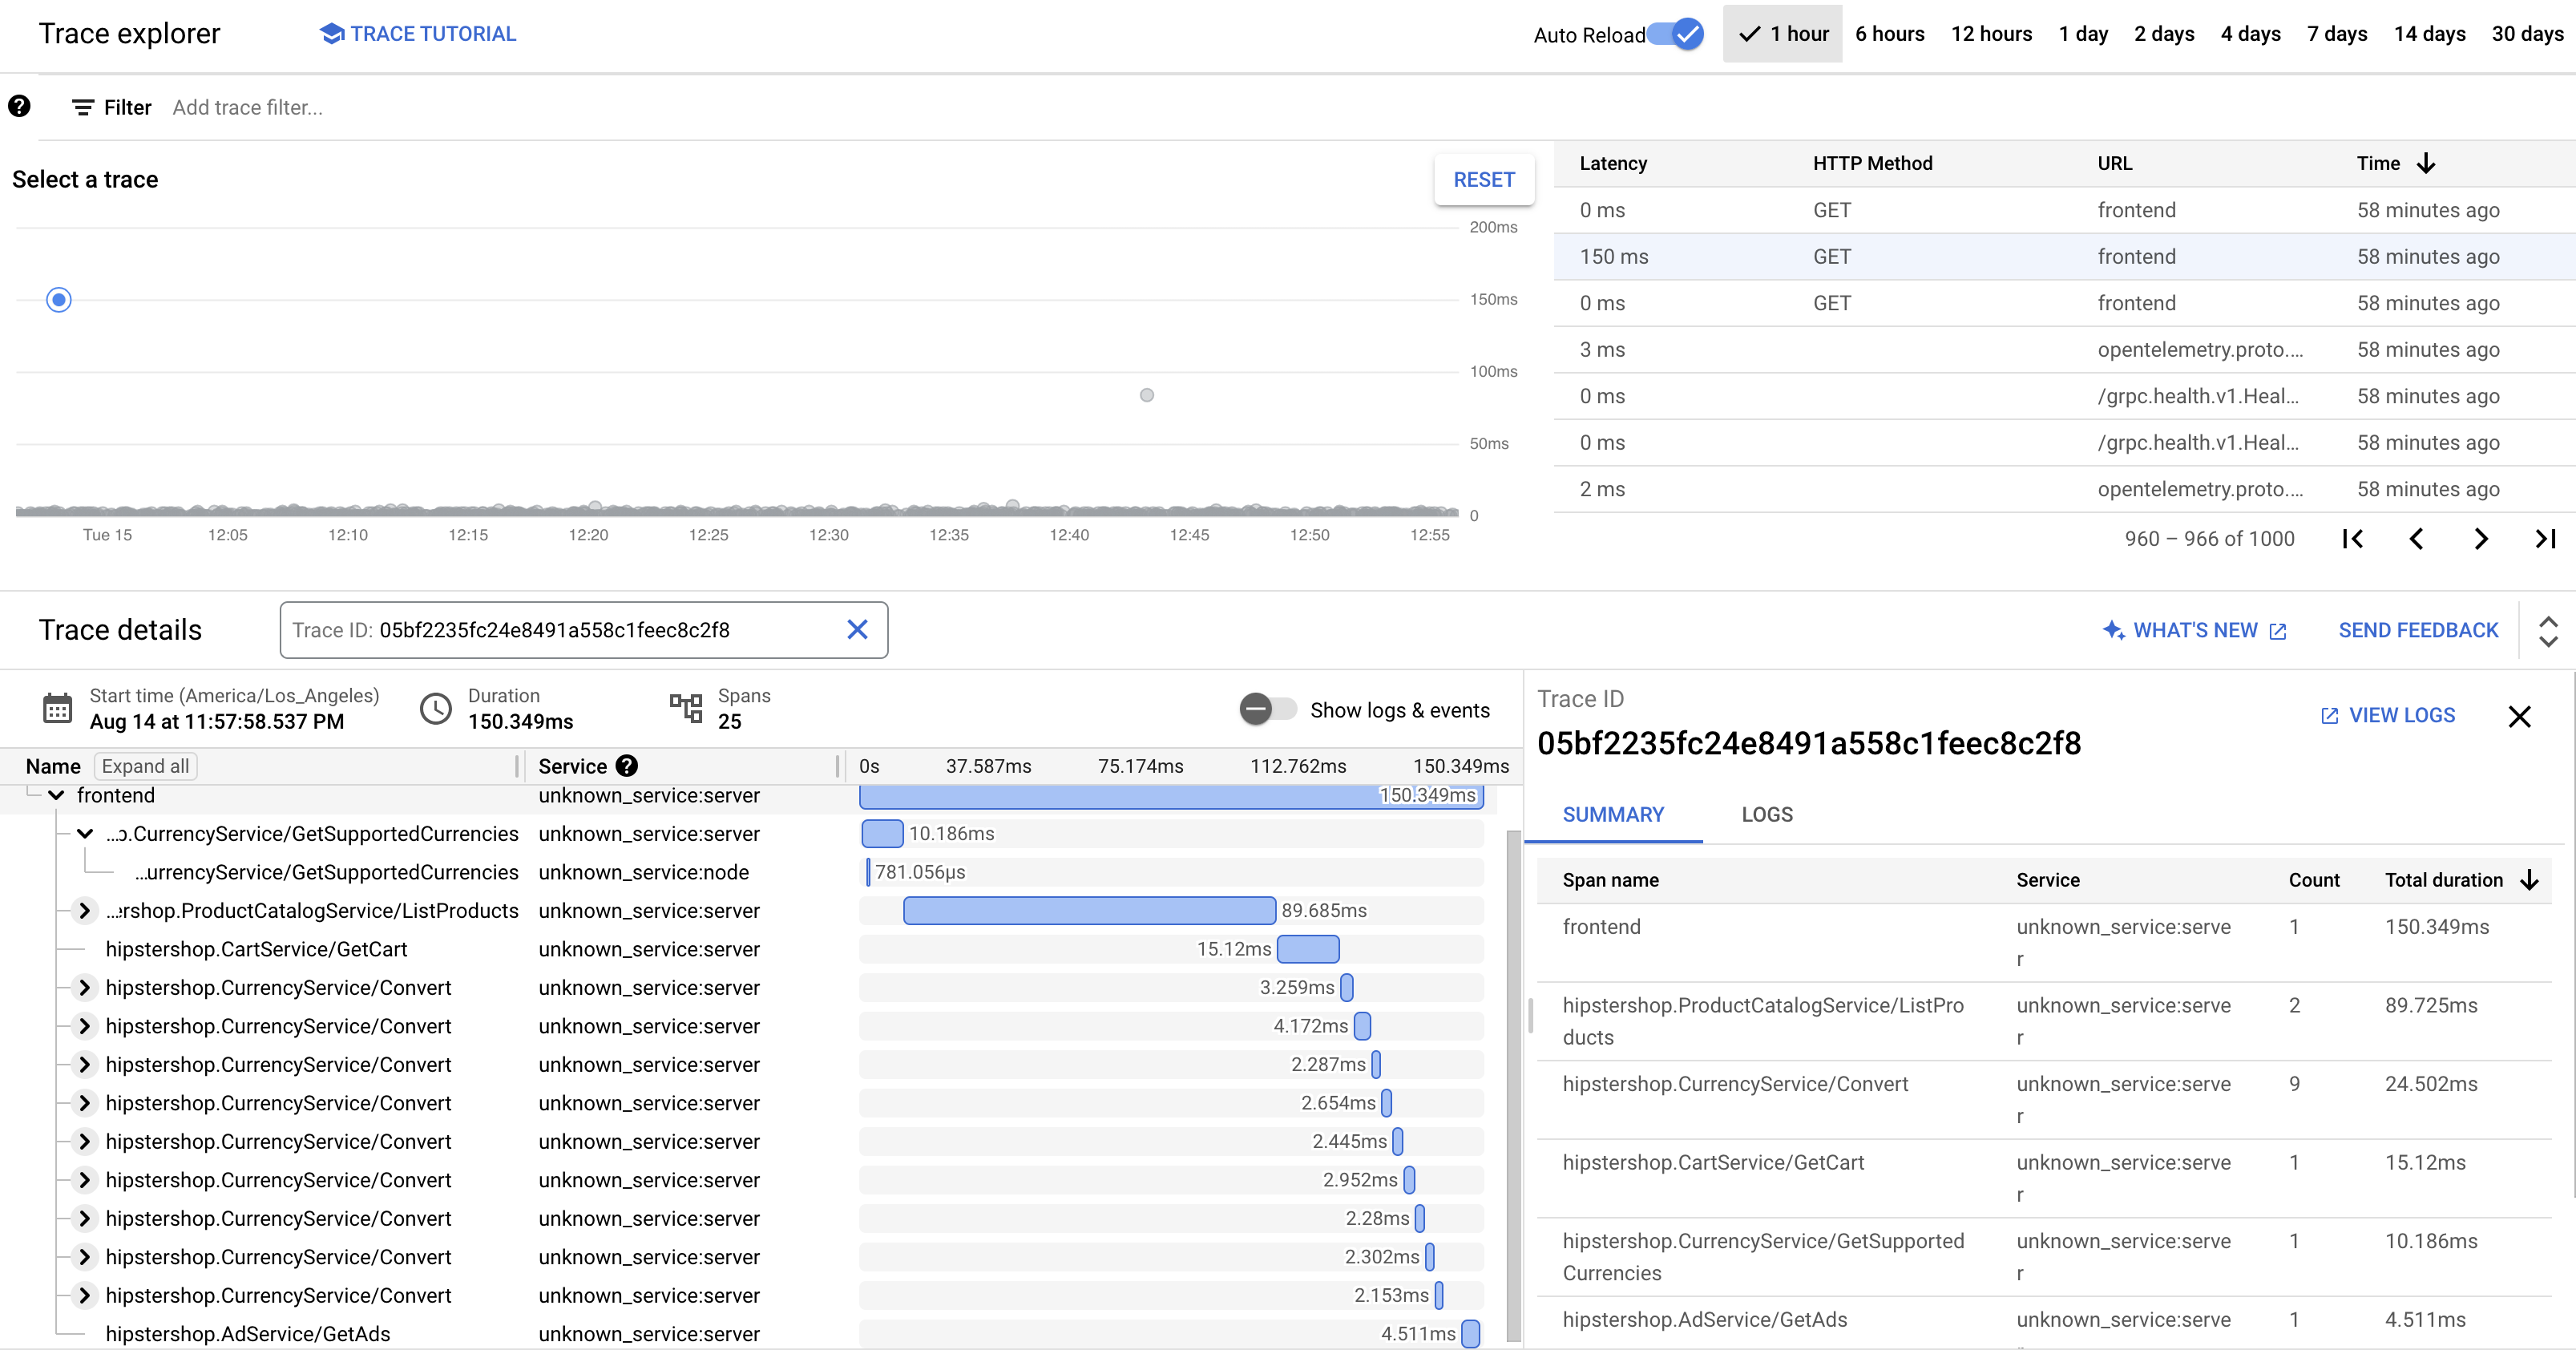
In the preceding screenshot, the trace for a product contains the following spans:
- The Frontend span captures the end-to-end latency (150.349 ms) that the client observes in loading the product details page.
- The Recommendation Service span captures the latency of the backend calls in fetching recommendations (4.246 ms) that are related to the product.
- The Ad Service span captures the latency of the backend calls in fetching ads (4.511 ms) that are relevant to the product page.
To troubleshoot high response times, you can review insights that include latency distribution graphs of any outlier requests when the service's dependencies aren't meeting their service level objectives (SLOs). You can also use Cloud Trace to get performance insights and create analysis reports from the sampled data.
Troubleshooting
If the traces in Application Performance Management don't appear, check Logs Explorer for a
permission denied error. The permission denied occurs when the service account
doesn't have access to export the traces. Review the steps on
granting the roles
required for Cloud Trace and make sure to annotate the service account
with the correct namespace. After that, restart the opentelemetrycollector:
```
kubectl rollout restart deployment opentelemetrycollector
```
Clean up
To avoid incurring charges to your Google Cloud account for the resources used in this tutorial, either delete the project that contains the resources, or keep the project and delete the individual resources.
Delete the project
- In the Google Cloud console, go to the Manage resources page.
- In the project list, select the project that you want to delete, and then click Delete.
- In the dialog, type the project ID, and then click Shut down to delete the project.
Delete the resources
If you want to keep the Google Cloud project that you used in this document, delete the individual resources:
In Cloud Shell, delete the resources:
gcloud container clusters delete online-boutique --project=${PROJECT_ID} --region=${REGION}
What's next
- Read the first document in this series to learn about microservices, their benefits, challenges, and use cases.
- Read the second document in this series to learn about application refactoring strategies to decompose microservices.
- Read the third document in this series to learn about interservice communication in a microservices setup.
- For more reference architectures, diagrams, and best practices, explore the Cloud Architecture Center.