This document in the Google Cloud Architecture Framework: Reliability section provides details about alerting around SLOs.
A mistaken approach to introducing a new observability system like SLOs is to use the system to completely replace an earlier system. Rather, you should see SLOs as a complementary system. For example, instead of deleting your existing alerts, we recommend that you run them in parallel with the SLO alerts introduced here. This approach lets you discover which legacy alerts are predictive of SLO alerts, which alerts fire in parallel with your SLO alerts, and which alerts never fire.
A tenet of SRE is to alert based on symptoms, not on causes. SLOs are, by their very nature, measurements of symptoms. As you adopt SLO alerts, you might find that the symptom alert fires alongside other alerts. If you discover that your legacy, cause-based alerts fire with no SLO or symptoms, these are good candidates to be turned off entirely, turned into ticketing alerts, or logged for later reference.
For more information, see SRE Workbook, Chapter 5.
SLO burn rate
An SLO's burn rate is a measurement of how quickly an outage exposes users to errors and depletes the error budget. By measuring your burn rate, you can determine the time until a service violates its SLO. Alerting based on the SLO burn rate is a valuable approach. Remember that your SLO is based on a duration, which might be quite long (weeks or even months). However, the goal is to quickly detect a condition that results in an SLO violation before that violation actually occurs.
The following table shows the time it takes to exceed an objective if 100% of requests are failing for the given interval, assuming queries per second (QPS) is constant. For example, if you have a 99.9% SLO measured over 30 days, you can withstand 43.2 minutes of full downtime during that 30 days. For example, that downtime can occur all at once, or spaced over several incidents.
| Objective | 90 days | 30 days | 7 days | 1 day |
|---|---|---|---|---|
| 90% | 9 days | 3 days | 16.8 hours | 2.4 hours |
| 99% | 21.6 hours | 7.2 hours | 1.7 hours | 14.4 minutes |
| 99.9% | 2.2 hours | 43.2 minutes | 10.1 minutes | 1.4 minutes |
| 99.99% | 13 minutes | 4.3 minutes | 1 minute | 8.6 seconds |
| 99.999% | 1.3 minutes | 25.9 seconds | 6 seconds | 0.9 seconds |
In practice, you cannot afford any 100%-outage incidents if you want to achieve high-success percentages. However, many distributed systems can partially fail or degrade gracefully. Even in those cases, you still want to know if a human needs to step in, even in such partial failures, and SLO alerts give you a way to determine that.
When to alert
An important question is when to act based on your SLO burn rate. As a rule, if you will exhaust your error budget in 24 hours, the time to page someone to fix an issue is now.
Measuring the rate of failure isn't always straightforward. A series of small errors might look terrifying in the moment but turn out to be short-lived and have an inconsequential impact on your SLO. Similarly, if a system is slightly broken for a long time, these errors can add up to an SLO violation.
Ideally, your team will react to these signals so that you spend almost all of your error budget (but not exceed it) for a given time period. If you spend too much, you violate your SLO. If you spend too little, you're not taking enough risk or possibly burning out your on-call team.
You need a way to determine when a system is broken enough that a human should intervene. The following sections discuss some approaches to that question.
Fast burns
One type of SLO burn is a fast SLO burn because it burns through your error budget quickly and demands that you intervene to avoid an SLO violation.
Suppose your service operates normally at 1000 queries per second (QPS), and you want to maintain 99% availability as measured over a seven-day week. Your error budget is about 6 million allowable errors (out of about 600 million requests). If you have 24 hours before your error budget is exhausted, for example, that gives you a limit of about 70 errors per second, or 252,000 errors in one hour. These parameters are based on the general rule that pageable incidents should consume at least 1% of the quarterly error budget.
You can choose to detect this rate of errors before that one hour has elapsed. For example, after observing 15 minutes of a 70-error-per-second rate, you might decide to page the on-call engineer, as the following diagram shows.
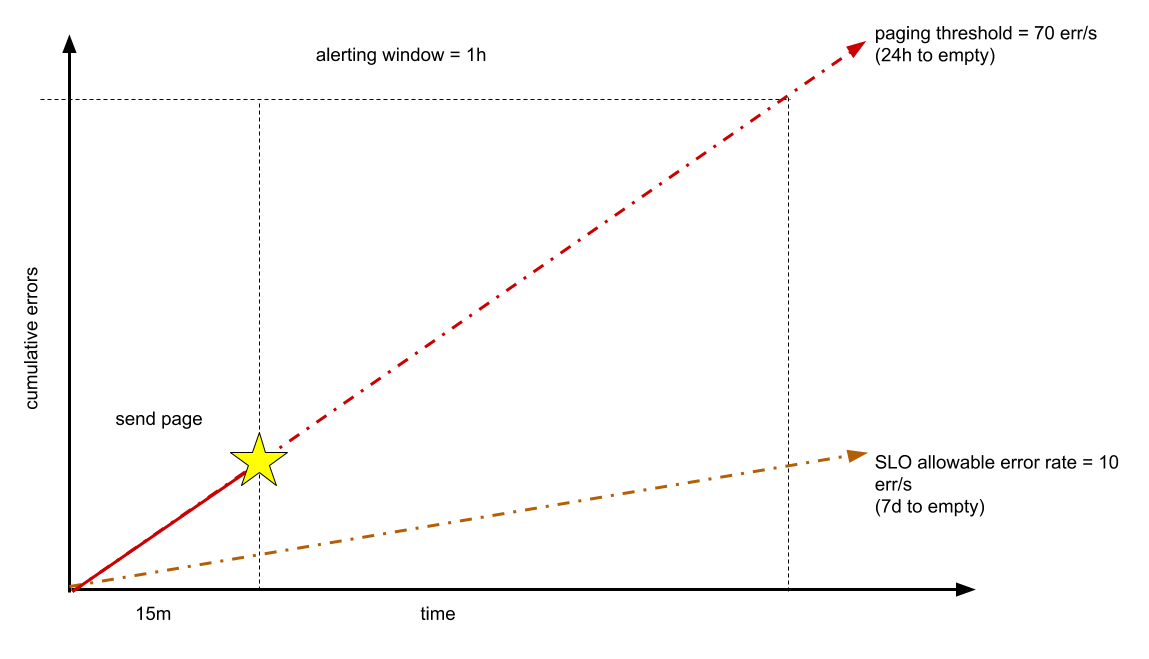
Ideally, the problem is solved before you expend one hour of your 24-hour budget. Choosing to detect this rate in a shorter window (for example, one minute) is likely to be too error-prone. If your target time to detect is shorter than 15 minutes, this number can be adjusted.
Slow burns
Another type of burn rate is a slow burn. Suppose you introduce a bug that burns your weekly error budget by day five or six, or your monthly budget by week two? What is the best response?
In this case, you might introduce a slow SLO burn alert that lets you know you're on course to consume your entire error budget before the end of the alerting window. Of course, that alert might return many false positives. For example, there might often be a condition where errors occur briefly but at a rate that would quickly consume your error budget. In these cases, the condition is a false positive because it lasts only a short time and does not threaten your error budget in the long term. Remember, the goal is not to eliminate all sources of error; it is to stay within the acceptable range to not exceed your error budget. You want to avoid alerting a human to intervene for events that are not legitimately threatening your error budget.
We recommend that you notify a ticket queue (as opposed to paging or emailing) for slow-burn events. Slow-burn events are not emergencies but do require human attention before the budget expires. These alerts shouldn't be emails to a team list, which quickly become a nuisance to be ignored. Tickets should be trackable, assignable, and transferrable. Teams should develop reports for ticket load, closure rates, actionability, and duplicates. Excessive, unactionable tickets are a great example of toil.
Using SLO alerts skillfully can take time and depend on your team's culture and expectations. Remember that you can fine-tune your SLO alerts over time. You can also have multiple alert methods, with varying alert windows, depending on your needs.
Latency alerts
In addition to availability alerts, you can also have latency alerts. With latency SLOs, you're measuring the percent of requests that are not meeting a latency target. By using this model, you can use the same alerting model that you use to detect fast or slow burns of your error budget.
As noted earlier about median latency SLOs, fully half your requests can be out of SLO. In other words, your users can suffer bad latency for days before you detect the impact on your long-term error budget. Instead, services should define tail latency objectives and typical latency objectives. We suggest using the historical 90th percentile to define typical and the 99th percentile for tail. After you set these targets, you can define SLOs based on the number of requests you expect to land in each latency category and how many are too slow. This approach is the same concept as an error budget and should be treated the same. Thus, you might end up with a statement like "90% of requests will be handled within typical latency and 99.9% within tail latency targets." These targets ensure that most users experience your typical latency and still let you track how many requests are slower than your tail latency targets.
Some services might have highly variant expected runtimes. For example, you might have dramatically different performance expectations for reading from a datastore system versus writing to it. Instead of enumerating every possible expectation, you can introduce runtime performance buckets, as the following tables show. This approach presumes that these types of requests are identifiable and pre-categorized into each bucket. You shouldn't expect to categorize requests on the fly.
| User-facing website | |
|---|---|
| Bucket | Expected maximum runtime |
| Read | 1 second |
| Write / update | 3 seconds |
| Data processing systems | |
|---|---|
| Bucket | Expected maximum runtime |
| Small | 10 seconds |
| Medium | 1 minute |
| Large | 5 minutes |
| Giant | 1 hour |
| Enormous | 8 hours |
By measuring the system as it is today, you can understand how long these requests typically take to run. As an example, consider a system for processing video uploads. If the video is very long, the processing time should be expected to take longer. We can use the length of the video in seconds to categorize this work into a bucket, as the following table shows. The table records the number of requests per bucket as well as various percentiles for runtime distribution over the course of a week.
| Video length | Number of requests measured in one week | 10% | 90% | 99.95% |
|---|---|---|---|---|
| Small | 0 | - | - | - |
| Medium | 1.9 million | 864 milliseconds | 17 seconds | 86 seconds |
| Large | 25 million | 1.8 seconds | 52 seconds | 9.6 minutes |
| Giant | 4.3 million | 2 seconds | 43 seconds | 23.8 minutes |
| Enormous | 81,000 | 36 seconds | 1.2 minutes | 41 minutes |
From such analysis, you can derive a few parameters for alerting:
- fast_typical: At most, 10% of requests are faster than this time. If too many requests are faster than this time, your targets might be wrong, or something about your system might have changed.
- slow_typical: At least 90% of requests are faster than this time. This limit drives your main latency SLO. This parameter indicates whether most of the requests are fast enough.
- slow_tail: At least 99.95% of requests are faster than this time. This limit ensures that there aren't too many slow requests.
- deadline: The point at which a user RPC or background processing times out and fails (a limit typically already hard-coded into the system). These requests won't actually be slow but will have actually failed with an error and instead count against your availability SLO.
A guideline in defining buckets is to keep a bucket's fast_typical, slow_typical, and slow_tail within an order of magnitude of each other. This guideline ensures that you don't have too broad of a bucket. We recommend that you don't attempt to prevent overlap or gaps between the buckets.
| Bucket | fast_typical | slow_typical | slow_tail | deadline |
|---|---|---|---|---|
| Small | 100 milliseconds | 1 second | 10 seconds | 30 seconds |
| Medium | 600 milliseconds | 6 seconds | 60 seconds (1 minute) | 300 seconds |
| Large | 3 seconds | 30 seconds | 300 seconds (5 minutes) | 10 minutes |
| Giant | 30 seconds | 6 minutes | 60 minutes (1 hour) | 3 hours |
| Enormous | 5 minutes | 50 minutes | 500 minutes (8 hours) | 12 hours |
This results in a rule like api.method: SMALL => [1s, 10s].
In this case, the SLO tracking system would see a request, determine its bucket
(perhaps by analysing its method name or URI and comparing the name to a lookup
table), then update the statistic based on the runtime of that request. If this
took 700 milliseconds, it is within the slow_typical target. If it is 3
seconds, it is within slow_tail. If it is 22 seconds, it is beyond
slow_tail, but not yet an error.
In terms of user happiness, you can think of missing tail latency as equivalent to being unavailable. (That is, the response is so slow that it should be considered a failure.) Due to this, we suggest using the same percentage that you use for availability, for example:
What you consider typical latency is up to you. Some teams within Google consider 90% to be a good target. This is related to your analysis and how you chose durations for slow_typical. For example:
Suggested alerts
Given these guidelines, the following table includes a suggested baseline set of SLO alerts.
| SLOs | Measurement window | Burn rate | Action |
|---|---|---|---|
|
Availability, fast burn Typical latency Tail latency |
1-hour window | Less than 24 hours to SLO violation | Page someone |
|
Availability, slow burn Typical latency, slow burn Tail latency, slow burn |
7-day window | Greater than 24 hours to SLO violation | Create a ticket |
SLO alerting is a skill that can take time to develop. The durations in this section are suggestions; you can adjust these according to your own needs and level of precision. Tying your alerts to the measurement window or error budget expenditure might be helpful, or you might add another layer of alerting between fast burns and slow burns.