To help with better utilization of resources, you can track the GPU usage rates of your virtual machine (VM) instances.
When you know the GPU usage rates, you can perform tasks such as setting up managed instance groups that can be used to autoscale resources.
To review GPU metrics using Cloud Monitoring, complete the following steps:
- On each VM, set up the GPU metrics reporting script. This script installs the GPU metrics reporting agent. This agent runs at intervals on the VM to collect GPU data, and sends this data to Cloud Monitoring.
- On each VM, run the script.
- On each VM, set GPU metrics reporting agent to automatically start on boot.
- View logs in Google Cloud Cloud Monitoring.
Required roles
To monitor GPU performance on Windows VMs, you need to grant the required Identity and Access Management (IAM) roles to the following principles:
- The service account that is used by the VM instance
- Your user account
To ensure that you and the VM's service account has the necessary permissions to monitor GPU performance on Windows VMs, ask your administrator to grant you and the VM's service account the following IAM roles on the project:
-
Compute Instance Admin (v1) (
roles/compute.instanceAdmin.v1) -
Monitoring Metric Writer (
roles/monitoring.metricWriter)
For more information about granting roles, see Manage access to projects, folders, and organizations.
Your administrator might also be able to give you and the VM's service account the required permissions through custom roles or other predefined roles.
Set up the GPU metrics reporting script
Requirements
On each of your VMs, check that you meet the following requirements:
- Each VM must have GPUs attached.
- Each VM must have a GPU driver installed.
Download the script
Open a PowerShell terminal as an administrator and use the
Invoke-WebRequest command to download the script.
Invoke-WebRequest is available on PowerShell 3.0 or later.
Google Cloud recommends that you use ctrl+v to paste the copied code blocks.
mkdir c:\google-scripts
cd c:\google-scripts
Invoke-Webrequest -uri https://raw.githubusercontent.com/GoogleCloudPlatform/compute-gpu-monitoring/main/windows/gce-gpu-monitoring-cuda.ps1 -outfile gce-gpu-monitoring-cuda.ps1
Run the script
cd c:\google-scripts
.\gce-gpu-monitoring-cuda.ps1
Configure the agent to automatically start on boot
To ensure that the GPU metrics reporting agent agent is set up to run on system boot, use the following command to add the agent to the Windows Task Scheduler.
$Trigger= New-ScheduledTaskTrigger -AtStartup
$Trigger.ExecutionTimeLimit = "PT0S"
$User= "NT AUTHORITY\SYSTEM"
$Action= New-ScheduledTaskAction -Execute "PowerShell.exe" -Argument "C:\google-scripts\gce-gpu-monitoring-cuda.ps1"
$settingsSet = New-ScheduledTaskSettingsSet
# Set the Execution Time Limit to unlimited on all versions of Windows Server
$settingsSet.ExecutionTimeLimit = 'PT0S'
Register-ScheduledTask -TaskName "MonitoringGPUs" -Trigger $Trigger -User $User -Action $Action -Force -Settings $settingsSet
Review metrics in Cloud Monitoring
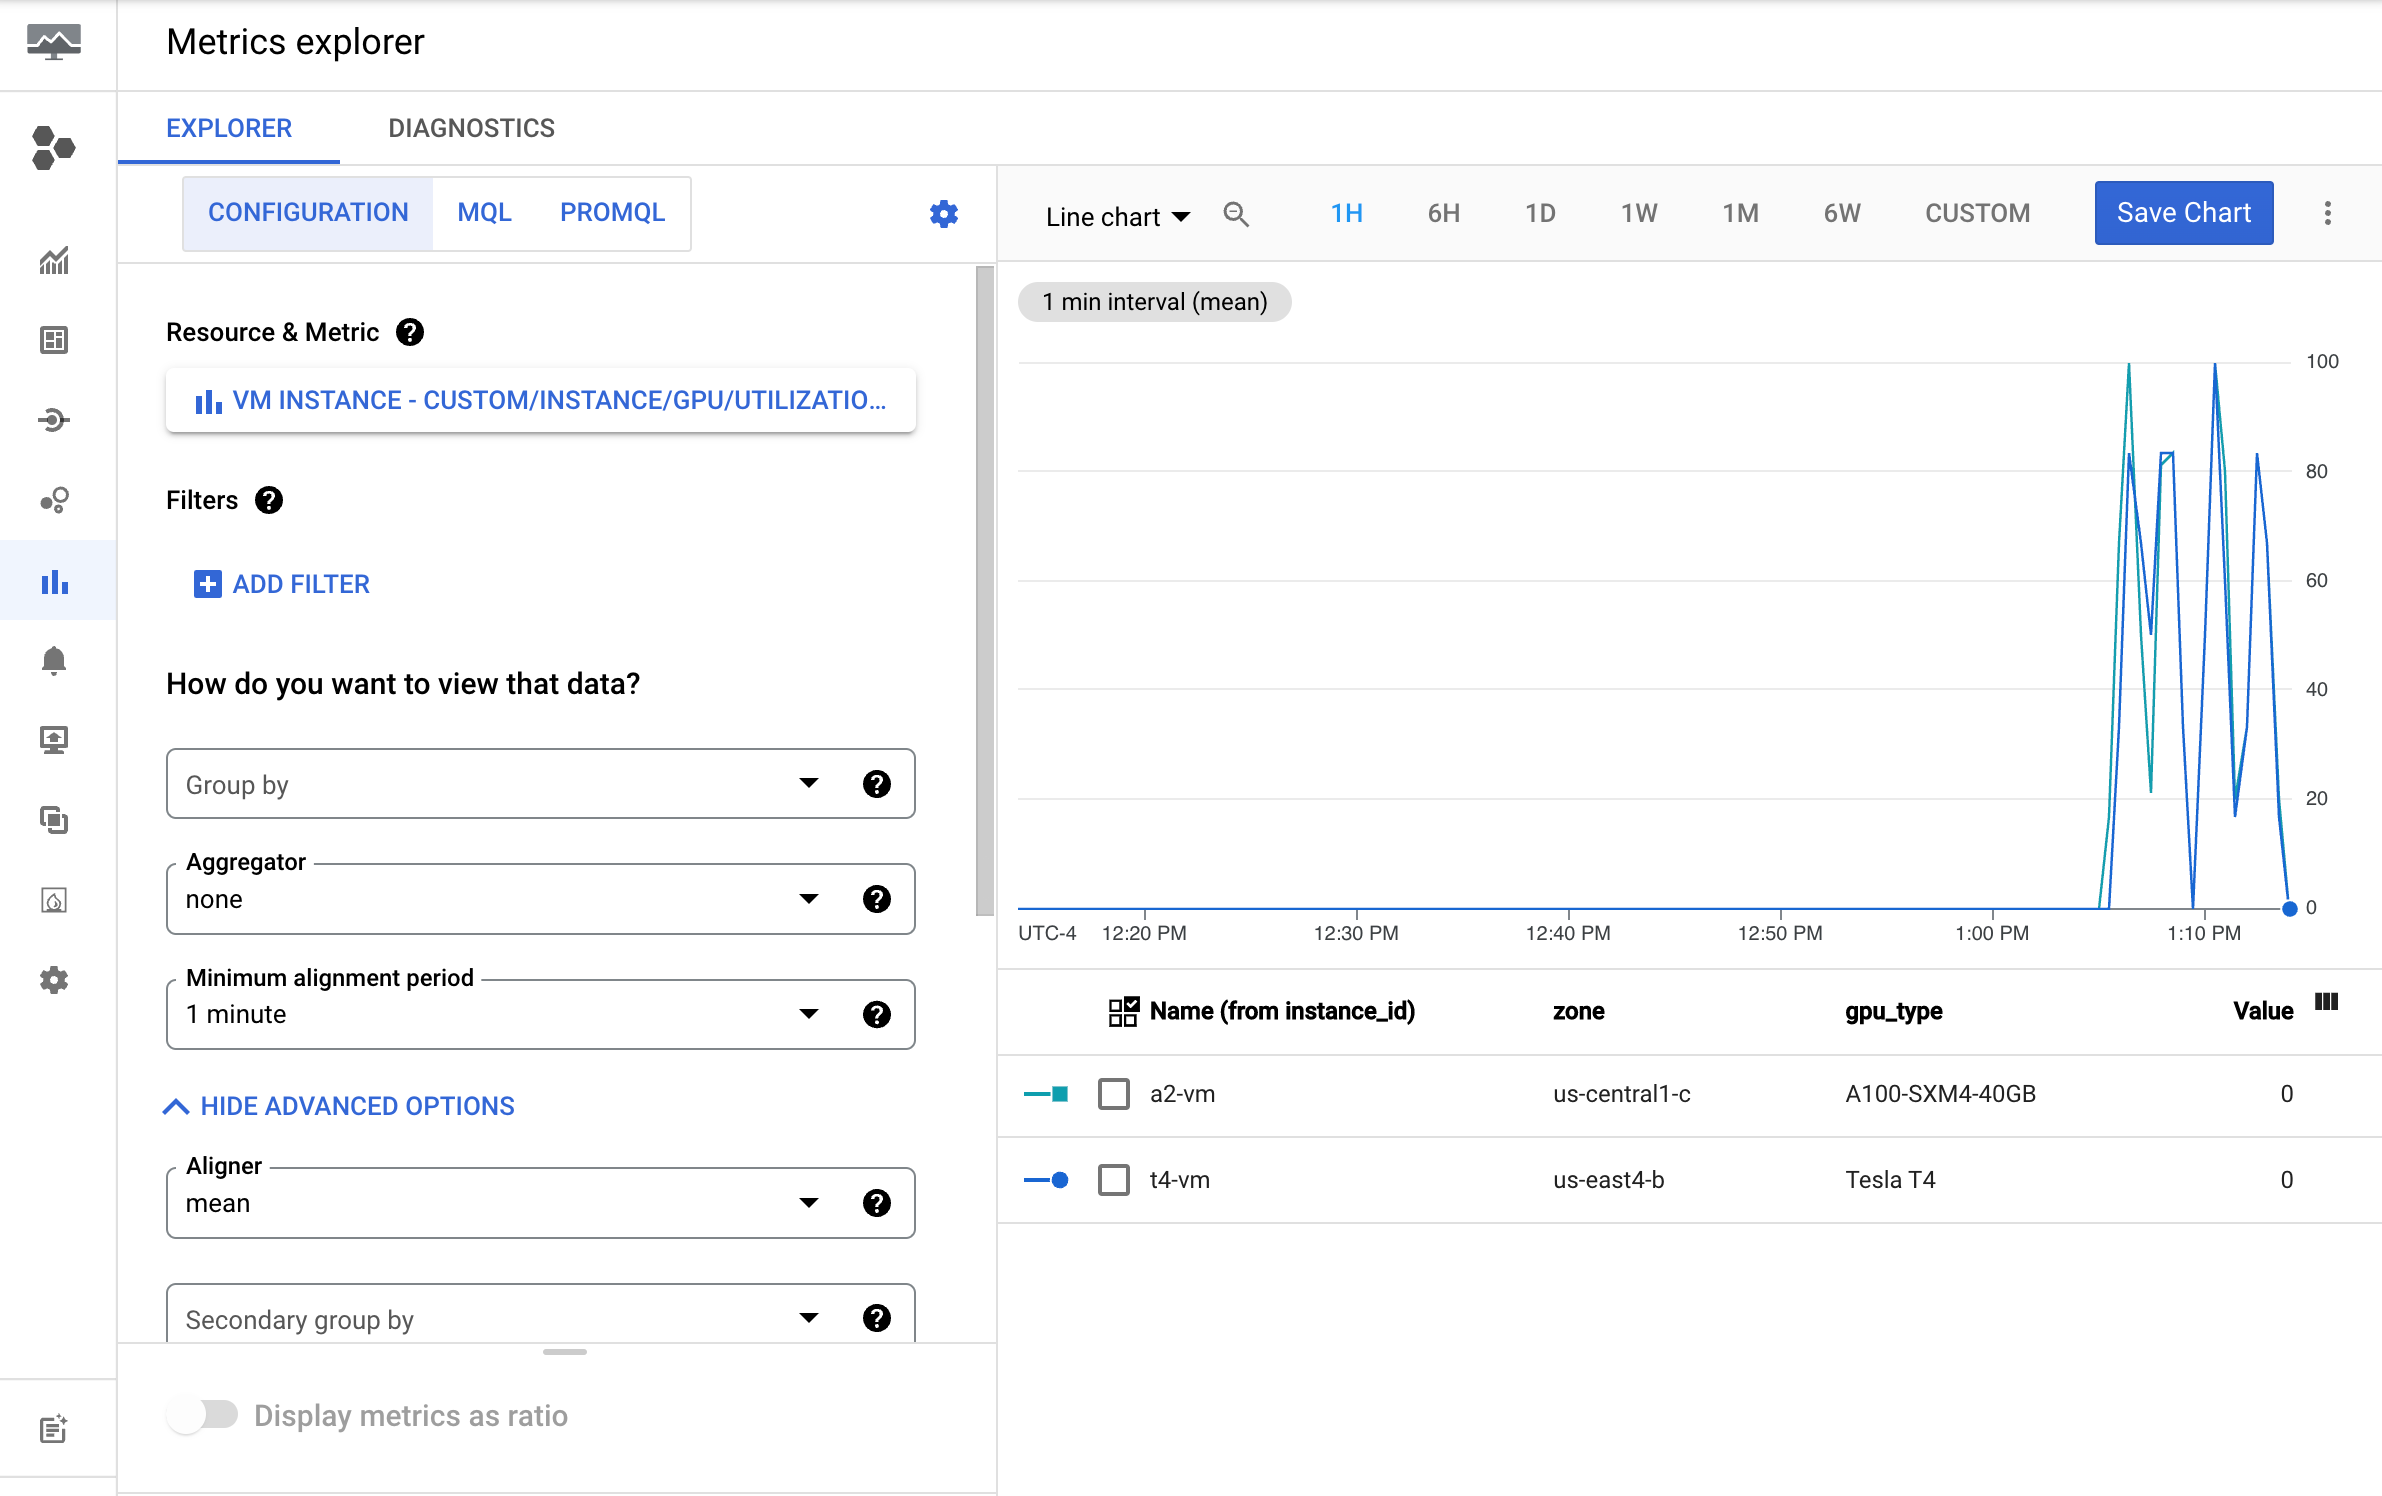
In the Google Cloud console, go to the Metrics Explorer page.
Expand the Select a metric menu.
In the Resource menu, select VM Instance.
In the Metric category menu, select Custom.
In the Metric menu, select the metric to chart. For example
custom/instance/gpu/utilization.Click Apply.
Your GPU utilization should resemble the following output:

Available metrics
| Metric name | Description |
|---|---|
instance/gpu/utilization |
Percent of time over the past sample period during which one or more kernels was executing on the GPU. |
instance/gpu/memory_utilization |
Percent of time over the past sample period during which global (device) memory was being read or written. |
instance/gpu/memory_total |
Total installed GPU memory. |
instance/gpu/memory_used |
Total memory allocated by active contexts. |
instance/gpu/memory_used_percent |
Percentage of total memory allocated by active contexts. Ranges from 0 to 100. |
instance/gpu/memory_free |
Total free memory. |
instance/gpu/temperature |
Core GPU temperature in Celsius (°C). |
What's next?
- To handle GPU host maintenance, see Handling GPU host maintenance events.
- To improve network performance, see Use higher network bandwidth.
