Monitor BigQuery reservations
As a BigQuery administrator, you can monitor reservations in your project by viewing the project and reservation slot usage and also view your capacity-based bill.
View project and reservation slot usage
You can view the project and reservation slot usage in the following ways:
INFORMATION_SCHEMAviews. To retrieve project and reservation usage information, query theINFORMATION_SCHEMA.JOBS*views.The
reservation_idfield in theINFORMATION_SCHEMA.JOBS*views contains the reservation name.Google Cloud console. The Google Cloud console includes charts that display slot usage. For more information, see Use administrative resource charts.
Audit logs. Use audit logs to view metrics about slot usage.
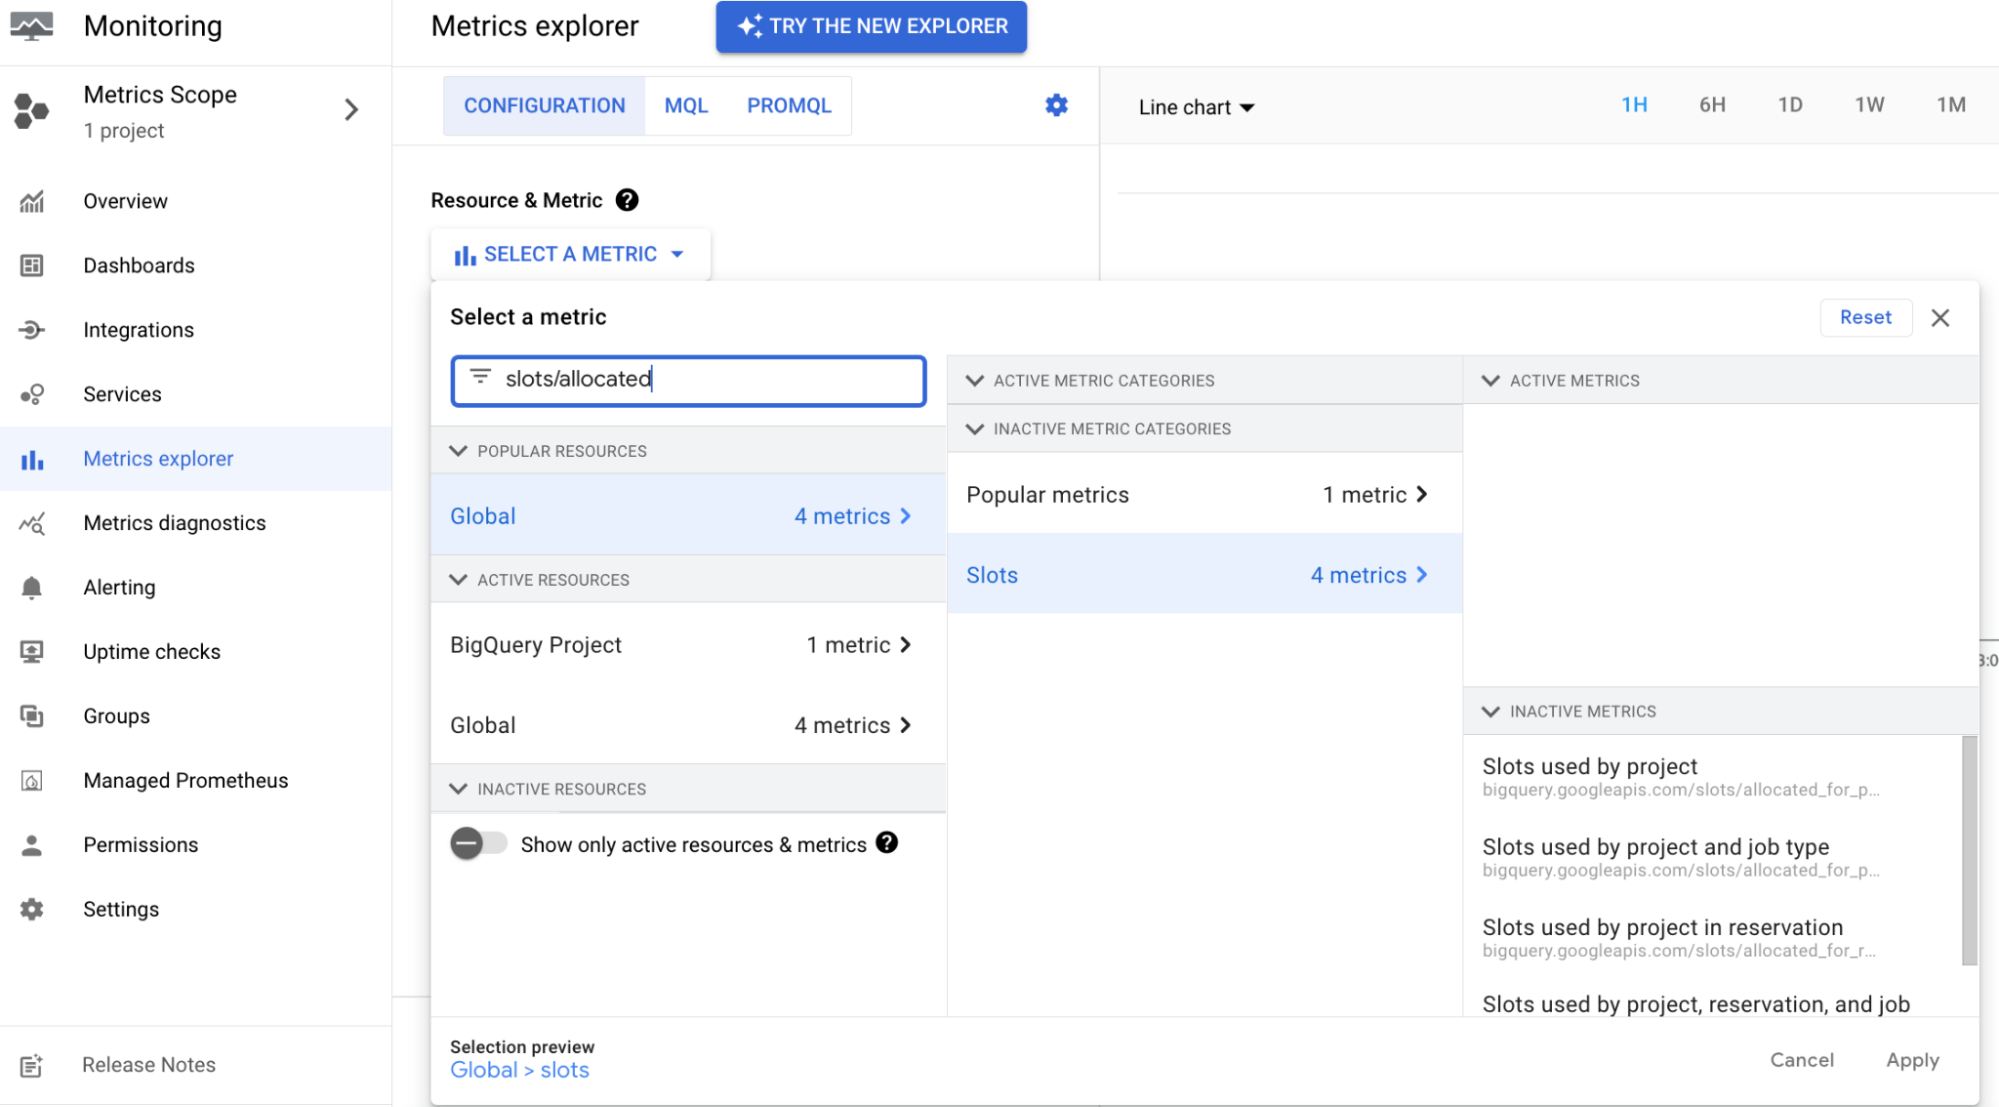
The
Jobsmethod. Use theJobsAPI method to view metrics about slot usage for a job.Cloud Monitoring. You can find the allocated slots in Cloud Monitoring. This metric information includes slot usage for each reservation and for each job type. The information can also be visualized by using the custom charts metric explorer.
View your capacity-based bill
To view your capacity-based bill in real time, follow these steps:
In the Google Cloud console, go to the Billing page.
Select the billing account project for which you want to view the bill.
Navigate to the Reports section and then in the Filters section, do the following:
- From the Services list, select BigQuery and select all that's applicable.
- Select All SKUs from the SKUs list.
Reservation cost attribution
This feature lets you attribute reservation fees back to the specific query usage across any projects that used the reservation. This results in more accurate net costs for each project basis.
All BigQuery Reservations API customers have an "Analysis Slots Attribution" line item in their Cloud Billing data, indicating the share of the reserved slots consumed in each project. This includes both the Billing page and the Cloud Billing export. The cost for this new item is zero. The changes don't affect your invoice totals.
Audit logs
Creating, deleting, and updating resources related to BigQuery reservations are recorded in the project owner's audit logs. For more information, see Audit log.
What's next
- Learn about capacity commitment plans.
- Learn how to use administrative resource charts.
- Learn about BigQuery pricing.