使用光柵資料分析溫度
本教學課程說明如何對點陣資料執行地理空間分析。
目標
- 在 BigQuery sharing (舊稱 Analytics Hub) 中,尋找可公開取得的 Google Earth Engine 資料。
- 使用
ST_REGIONSTATS函式計算每個國家/地區在特定時間點的平均溫度。 - 在 BigQuery Geo Viz 中以視覺化的方式呈現結果。BigQuery Geo Viz 是一個網頁工具,使用 Google Maps API 在 BigQuery 中顯示地理空間資料。
費用
在本教學課程中,您將使用 Google Cloud的下列計費元件:
事前準備
建議您為本教學課程建立 Google Cloud 專案。請確認您具備完成本教學課程所需的角色。
設定 Google Cloud 專案
- Sign in to your Google Cloud account. If you're new to Google Cloud, create an account to evaluate how our products perform in real-world scenarios. New customers also get $300 in free credits to run, test, and deploy workloads.
-
In the Google Cloud console, on the project selector page, select or create a Google Cloud project.
Roles required to select or create a project
- Select a project: Selecting a project doesn't require a specific IAM role—you can select any project that you've been granted a role on.
-
Create a project: To create a project, you need the Project Creator
(
roles/resourcemanager.projectCreator), which contains theresourcemanager.projects.createpermission. Learn how to grant roles.
-
Verify that billing is enabled for your Google Cloud project.
-
Enable the BigQuery, BigQuery sharing, and Google Earth Engine APIs.
Roles required to enable APIs
To enable APIs, you need the Service Usage Admin IAM role (
roles/serviceusage.serviceUsageAdmin), which contains theserviceusage.services.enablepermission. Learn how to grant roles. -
Earth Engine 資源檢視者 (
roles/earthengine.viewer) -
服務用量消費者 (
roles/serviceusage.serviceUsageConsumer) -
BigQuery 資料編輯者 (
roles/bigquery.dataEditor) -
earthengine.computations.create -
serviceusage.services.use -
bigquery.datasets.create 前往「Sharing (Analytics Hub)」頁面。
按一下「搜尋房源」。
在「Search for listings」(搜尋房源) 欄位中輸入
"ERA5-Land Daily Aggregated"。按一下結果。詳細資料窗格隨即開啟,顯示 ERA5-Land 氣候再分析資料集的相關資訊,包括說明、頻帶資訊連結、可用性、像素大小和使用條款。
按一下「訂閱」。
選用:更新「專案」。
將「連結的資料集名稱」更新為
era5_climate_tutorial。按一下 [儲存]。連結的資料集會新增至專案,並包含名為
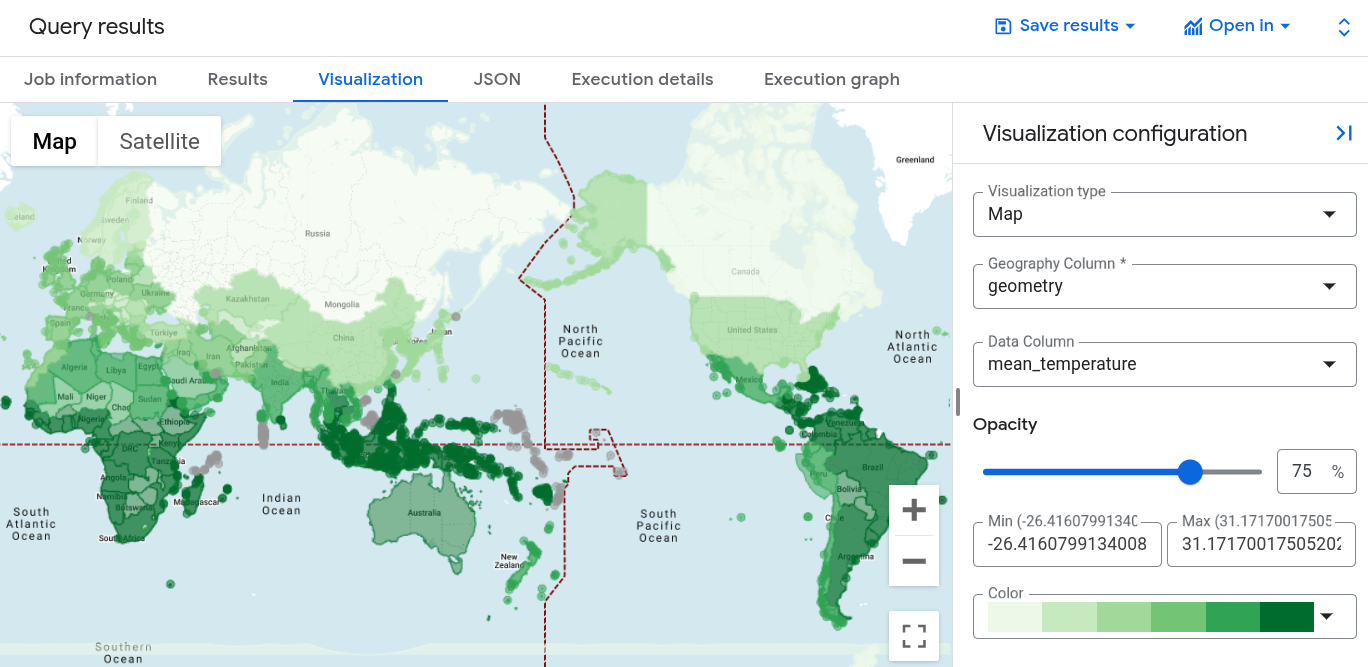
climate的單一資料表。在「查詢結果」窗格中,按一下「圖表」分頁標籤。
在「資料欄」部分,選取
mean_temperature。地圖會顯示各國的平均溫度,並以漸層色標示。
開啟 Geo Viz 網頁版工具。
或者,在「查詢結果」窗格中,依序點選「開啟方式」> GeoViz。
在步驟一「查詢」中,按一下「授權」。
在「Choose an account」(選擇帳戶) 對話方塊中,按一下您的 Google 帳戶。
在存取對話方塊中,按一下 [Allow] (允許) 以取得您 BigQuery 資料的 Geo Viz 存取權。
在第一步「Select data」(選取資料) 中,於「Project ID」(專案 ID) 欄位中輸入您的專案 ID。
在查詢視窗中,輸入下列 GoogleSQL 查詢。如果您是從查詢結果開啟 Geo Viz,這個欄位會預先填入查詢內容。
WITH SimplifiedCountries AS ( SELECT ST_SIMPLIFY(geometry, 10000) AS simplified_geometry, names.primary AS name FROM `bigquery-public-data.overture_maps.division_area` WHERE subtype = 'country' ) SELECT sc.simplified_geometry AS geometry, sc.name, ST_REGIONSTATS( sc.simplified_geometry, 'ee://ECMWF/ERA5_LAND/DAILY_AGGR/20250101', 'temperature_2m' ).mean - 273.15 AS mean_temperature FROM SimplifiedCountries AS sc ORDER BY mean_temperature DESC;按一下「執行」。
如要開啟「fillColor」面板,請按一下步驟 3「Style」。
將「以數據為準」切換鈕設為開啟。
在「Function」中選擇 [linear]。
在「Field」(欄位) 部分,選擇
mean_temperature。在「Domain」(網域) 部分,分別在第一個和第二個方塊中輸入
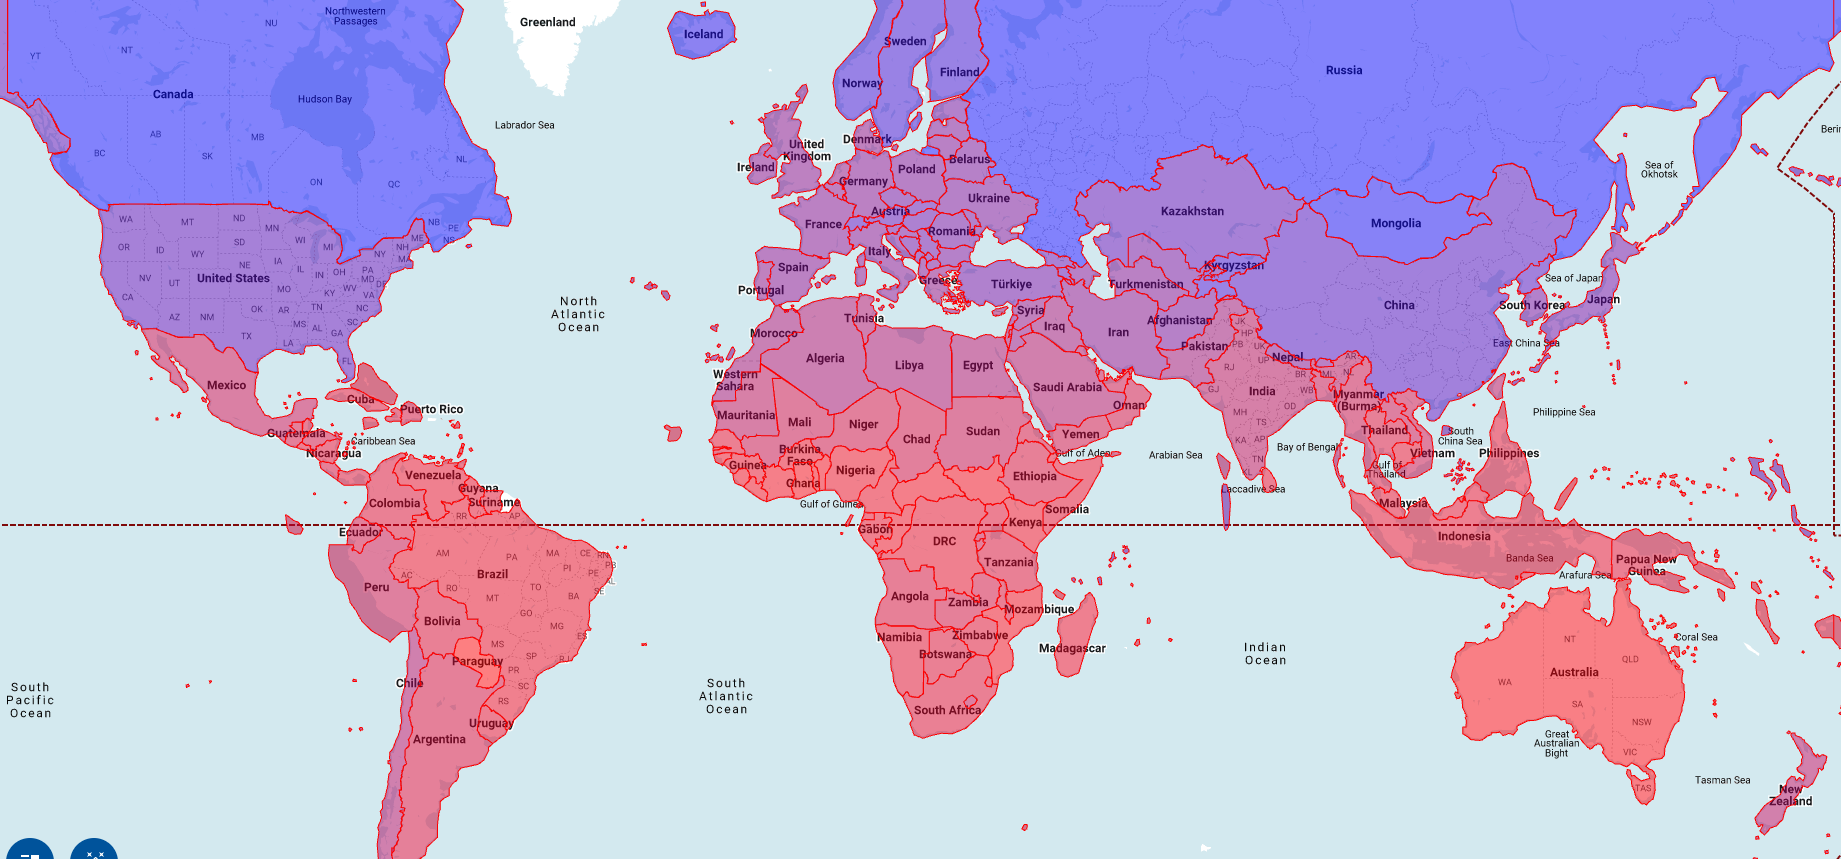
-20和32。針對「Range」(範圍),按一下第一個方塊,然後在「Hex」方塊中輸入
#0006ff;接著按一下第二個方塊,然後輸入#ff0000。這會根據各國家/地區在 2025 年 1 月 1 日的平均溫度,變更各國家/地區的顏色。藍色代表較低的溫度,紅色代表較高的溫度。按一下 [fillOpacity]。
在「Value」(值) 欄位中,輸入
.5。按一下「套用樣式」。
查看您的地圖。按一下國家/地區,即可查看該國家/地區的名稱、平均溫度和簡化幾何圖形。
- In the Google Cloud console, go to the Manage resources page.
- In the project list, select the project that you want to delete, and then click Delete.
- In the dialog, type the project ID, and then click Shut down to delete the project.
- 如要進一步瞭解地理空間分析的視覺化選項,請參閱「視覺化地理空間資料」。
- 如要使用點陣資料,請參閱「使用點陣資料」。
- 如要進一步瞭解地理空間分析中可使用的地理位置函式,請參閱 GoogleSQL 中的地理位置函式。
必要的角色
如要取得執行本教學課程中工作所需的權限,請要求管理員在專案中授予您下列 IAM 角色:
如要進一步瞭解如何授予角色,請參閱「管理專案、資料夾和機構的存取權」。
這些預先定義的角色具備執行本教學課程中工作所需的權限。如要查看確切的必要權限,請展開「必要權限」部分:
所需權限
如要執行本教學課程中的工作,必須具備下列權限:
訂閱資料集
如要找出本教學課程使用的資料集,請按照下列步驟操作:
找出點陣 ID
era5_climate_tutorial.climate 表格中的每一列都包含特定日期的點陣圖像中繼資料,當中含有氣候資料。執行下列查詢,擷取 2025 年 1 月 1 日的光柵圖像光柵 ID:
SELECT
  assets.image.href
FROM
  `era5_climate_tutorial.climate`
WHERE
  properties.start_datetime = '2025-01-01';
結果為 ee://ECMWF/ERA5_LAND/DAILY_AGGR/20250101。在下一節中,您會將這個值做為 ST_REGIONSTATS 函式的 raster_id 引數。
計算平均溫度
執行下列查詢,使用 ST_REGIONSTATS 函式計算 2025 年 1 月 1 日各國的平均溫度:
WITH SimplifiedCountries AS (
  SELECT
    ST_SIMPLIFY(geometry, 10000) AS simplified_geometry,
    names.primary AS name
  FROM
    `bigquery-public-data.overture_maps.division_area`
  WHERE
    subtype = 'country'
)
SELECT
  sc.simplified_geometry AS geometry,
  sc.name,
  ST_REGIONSTATS(
    sc.simplified_geometry,
    'ee://ECMWF/ERA5_LAND/DAILY_AGGR/20250101',
    'temperature_2m'
  ).mean - 273.15 AS mean_temperature
FROM
  SimplifiedCountries AS sc
ORDER BY
  mean_temperature DESC;
這項查詢會在公開的 division_area 表格上執行,該表格包含代表地球上各個區域 (包括國家/地區) 邊界的 GEOGRAPHY 值。ST_REGIONSTATS 函式會使用光柵圖片的 temerature_2m 頻帶,其中包含指定像素位置上方 2 公尺處的氣溫。
在 BigQuery 中以視覺化方式呈現查詢結果
如要在 BigQuery 中以視覺化的方式呈現結果,請按照下列步驟操作:
在 Geo Viz 中將查詢結果視覺化
您也可以使用 BigQuery Geo Viz 將結果視覺化。
啟用 Geo Viz 並進行身分驗證
在您使用 Geo Viz 之前,您必須在 BigQuery 中對資料進行身分驗證並授予存取權。
如要設定 Geo Viz,請按照下列步驟操作:
在 Geo Viz 中執行查詢
在您進行身分驗證並授予權限後,下一步是在 Geo Viz 中執行查詢。
如要執行查詢,請按照下列步驟操作:
套用樣式
「樣式」部分會提供視覺化樣式清單以供您自訂。如要進一步瞭解各項樣式,請參閱「設定資料視覺化格式」。
如要將地圖格式化,請按照下列步驟操作: