특정 쿼리를 평가하거나 리소스 경합이 발생하는지 평가하려면 Cloud Monitoring 또는 BigQuery 관리 리소스 차트를 사용하여 BigQuery 작업이 시간별로 리소스를 얼마나 소비하는지 모니터링하면 됩니다. 느리거나 리소스를 많이 사용하는 쿼리를 발견했다면 해당 쿼리의 성능 최적화에 집중할 수 있습니다.
일부 쿼리 패턴, 특히 비즈니스 인텔리전스 도구로 생성된 쿼리 패턴은 BigQuery BI Engine을 사용하여 가속화할 수 있습니다.
BI Engine은 가장 자주 사용하는 데이터를 지능적으로 캐시하여 BigQuery의 여러 SQL 쿼리를 가속화하는 빠른 메모리 내 분석 서비스입니다. BI Engine은 BigQuery에 내장되어 있으므로 쿼리를 수정하지 않고도 성능을 높일 수 있는 경우가 많습니다.
모든 시스템과 마찬가지로 성능을 최적화하는 경우 종종 반대급부가 발생합니다.
예를 들어 고급 SQL 구문을 사용하면 복잡성이 증가하고 SQL 전문가가 아닌 사용자의 쿼리 이해도가 저하될 수 있습니다.
중요도가 낮은 워크로드에 대한 마이크로 최적화에 시간을 투자하면 애플리케이션의 새로운 기능을 구축하거나 더 중요한 최적화를 식별하는 필요한 리소스가 전용될 수도 있습니다. 가장 큰 투자수익을 얻으려면 데이터 분석 파이프라인에 가장 중요한 워크로드 최적화에 집중하는 것이 좋습니다.
용량 및 동시 실행 최적화
BigQuery에서 쿼리에 적용하는 가격 책정 모델은 주문형 가격과 용량 기반 가격 2가지입니다. 주문형 모델은 공유 용량 풀을 제공하며 가격은 실행하는 각 쿼리에서 처리되는 데이터 양을 기준으로 합니다.
일관적인 월별 지출을 예산하려는 경우 또는 주문형 모델에서 사용할 수 있는 것보다 많은 용량이 필요한 경우 용량 기반 모델을 사용하는 것이 좋습니다.
용량 기반 가격 책정을 사용하는 경우 슬롯으로 측정되는 전용 쿼리 처리 용량을 할당합니다.
모든 바이트 처리 비용이 용량 기반 가격에 포함됩니다.
고정된 슬롯 약정 외에도 쿼리 워크로드에 따라 동적 용량을 제공하는 자동 확장 슬롯을 사용할 수 있습니다.
동일한 데이터로 반복적으로 실행되는 쿼리 성능은 달라질 수 있으며, 일반적으로 슬롯 예약을 사용하는 쿼리보다 주문형 슬롯을 사용하는 쿼리의 변화가 더 큽니다.
SQL 쿼리를 처리하는 동안 BigQuery는 쿼리의 각 단계를 실행하는 데 필요한 연산 능력을 슬롯으로 나눕니다. BigQuery는 다음과 같이 동시에 실행할 수 있는 쿼리 수를 자동으로 결정합니다.
주문형 모델: 프로젝트에서 사용 가능한 슬롯 수
용량 기반 모델: 예약에서 사용 가능한 슬롯 수
사용 가능한 슬롯보다 더 많은 슬롯이 필요한 쿼리는 처리 리소스를 사용할 수 있을 때까지 큐에 추가됩니다. 쿼리 실행이 시작된 후 BigQuery는 스테이지 크기와 복잡성 및 사용 가능한 슬롯 수를 기준으로 각 쿼리 스테이지에서 사용하는 슬롯 수를 계산합니다. BigQuery는 공정 예약이라는 기술을 사용하여 각 쿼리를 진행하기에 충분한 용량이 있는지 확인합니다.
슬롯 용량이 많다고 해서 항상 쿼리 성능이 더 빨라지는 것은 아닙니다. 그러나 슬롯 풀이 클수록 크거나 복잡한 쿼리의 성능과 동시 워크로드의 성능이 향상될 수 있습니다. 쿼리 성능을 향상시키려면 슬롯 예약을 수정하거나 슬롯 자동 확장에 더 높은 한도를 설정하면 됩니다.
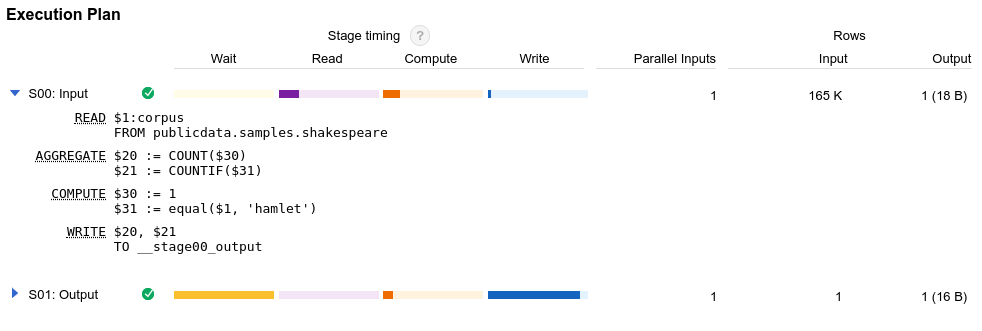
쿼리 계획 및 타임라인
BigQuery는 쿼리를 실행할 때마다 쿼리 계획을 생성합니다.
효과적인 쿼리 최적화를 위해서는 이 계획을 이해하는 것이 매우 중요합니다.
쿼리 계획에는 읽은 바이트 및 사용된 슬롯 시간과 같은 실행 통계가 포함됩니다. 쿼리 계획에는 쿼리 성능을 진단하고 개선하는 데 도움이 되는 여러 실행 단계에 대한 세부정보도 포함되어 있습니다. 쿼리 실행 그래프는 쿼리 계획을 보고 쿼리 성능 문제를 진단하기 위한 그래픽 인터페이스를 제공합니다.
BigQuery는 쿼리 작업을 실행할 때 선언적 SQL 문을 실행 그래프로 변환합니다. 그리고 이 그래프를 일련의 쿼리 스테이지로 세분화합니다. 각 쿼리 스테이지에는 더 세분화된 실행 단계 조합이 있습니다. BigQuery는 크게 분산된 병렬 아키텍처를 사용하여 이러한 쿼리를 실행합니다. BigQuery 스테이지는 많은 잠재적 작업자들이 동시에 실행할 수 있는 작업 단위를 모델링합니다. 스테이지는 빠른 분산 셔플 아키텍처를 통해 서로 통신합니다.
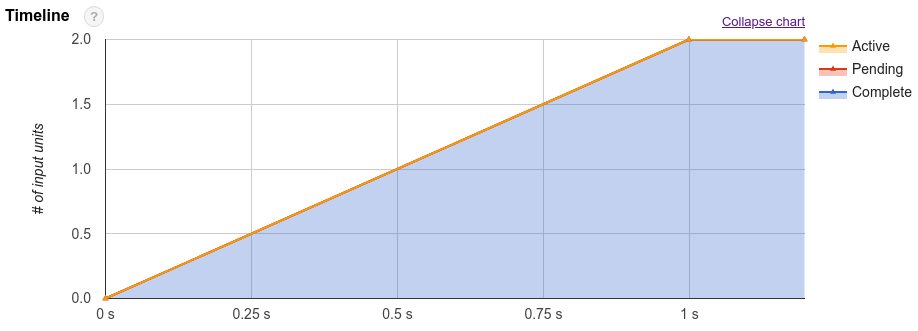
쿼리 작업에는 쿼리 계획 외에 실행 타임라인도 제공됩니다.
이 타임라인은 쿼리 작업자의 완료, 보류, 활성 상태 작업 단위에 대한 설명을 제공합니다. 쿼리에는 활성 작업자를 포함한 여러 스테이지가 동시에 있을 수 있으므로 쿼리의 전반적인 진행 상황을 보여주기 위한 용도로 타임라인이 사용됩니다.
쿼리의 계산 비용을 추정하려면 쿼리에서 소요되는 총 슬롯 시간(초)을 살펴보면 됩니다. 슬롯 시간(초)은 짧을수록 좋습니다. 그래야 동일한 프로젝트에서 동시에 실행되는 다른 쿼리에서 더 많은 리소스를 사용할 수 있기 때문입니다.
쿼리 계획과 타임라인 통계는 BigQuery가 쿼리를 어떻게 실행하며, 어떤 스테이지에 리소스 사용이 집중되는지 이해하는 데 유용할 수 있습니다. 예를 들어 입력 행보다 훨씬 많은 출력 행을 생성하는 JOIN 스테이지는 쿼리에서 일찍 필터링하는 것이 좋습니다.
그러나 서비스의 관리 특성으로 인해 일부 세부정보의 직접적인 조치 가능 여부에는 제한이 있습니다. 쿼리 실행 및 성능을 개선하기 위한 권장사항과 기법은 쿼리 계산 최적화를 참조하세요.
[[["이해하기 쉬움","easyToUnderstand","thumb-up"],["문제가 해결됨","solvedMyProblem","thumb-up"],["기타","otherUp","thumb-up"]],[["이해하기 어려움","hardToUnderstand","thumb-down"],["잘못된 정보 또는 샘플 코드","incorrectInformationOrSampleCode","thumb-down"],["필요한 정보/샘플이 없음","missingTheInformationSamplesINeed","thumb-down"],["번역 문제","translationIssue","thumb-down"],["기타","otherDown","thumb-down"]],["최종 업데이트: 2025-09-04(UTC)"],[[["\u003cp\u003eOptimizing query performance in BigQuery involves reducing the amount of work a query does, which leads to faster execution, lower resource consumption, and reduced costs.\u003c/p\u003e\n"],["\u003cp\u003eEvaluating query performance in BigQuery includes factors such as input data, communication between nodes, computation, outputs, capacity and concurrency, and query patterns.\u003c/p\u003e\n"],["\u003cp\u003eBigQuery BI Engine can accelerate certain query patterns by using an in-memory analysis service that caches frequently used data, often without requiring query modifications.\u003c/p\u003e\n"],["\u003cp\u003eBigQuery offers on-demand and capacity-based pricing models, with capacity-based pricing providing dedicated query processing capacity and being recommended for consistent monthly expenditures or higher capacity needs.\u003c/p\u003e\n"],["\u003cp\u003eUnderstanding the query plan and timeline generated by BigQuery is critical for query optimization, as it provides execution statistics, stage details, and resource utilization insights.\u003c/p\u003e\n"]]],[],null,["# Introduction to optimizing query performance\n============================================\n\nThis document provides an overview of optimization techniques that can improve\nquery performance in BigQuery. In general, queries that do less work\nperform better. They run faster and consume fewer resources, which can result in\nlower costs and fewer failures.\n\nQuery performance\n-----------------\n\nEvaluating query performance in BigQuery involves several factors:\n\n- [Input data and data sources (I/O)](/bigquery/docs/best-practices-performance-compute#reduce-data-processed): How many bytes does your query read?\n- [Communication between nodes (shuffling)](/bigquery/docs/best-practices-performance-compute#reduce-data-processed): How many bytes does your query pass to the next stage? How many bytes does your query pass to each slot?\n- [Computation](/bigquery/docs/best-practices-performance-compute#optimize-query-operations): How much CPU work does your query require?\n- [Outputs (materialization)](/bigquery/docs/best-practices-performance-compute#reduce-query-output): How many bytes does your query write?\n- [Capacity and concurrency](#capacity-and-concurrency): How many slots are available and how many other queries are running at the same time?\n- [Query patterns](/bigquery/docs/best-practices-performance-patterns): Are your queries following SQL best practices?\n\nTo evaluate specific queries or whether you are experiencing resource contention,\nyou can use [Cloud Monitoring](/bigquery/docs/monitoring) or the [BigQuery administrative resource charts](/bigquery/docs/admin-resource-charts) to monitor how your BigQuery jobs consume\nresources over time. If you identify a slow or resource-intensive query, you can\nfocus your performance optimizations on that query.\n\nSome query patterns, especially those generated by business intelligence tools,\ncan be accelerated by using [BigQuery BI Engine](/bigquery/docs/bi-engine-query).\nBI Engine is a fast, in-memory analysis service that accelerates many\nSQL queries in BigQuery by intelligently caching the data you use\nmost frequently. BI Engine is built into BigQuery,\nwhich means you can often get better performance without any query modifications.\n\nAs with any systems, optimizing for performance sometimes involves tradeoffs.\nFor example, using advanced SQL syntax can sometimes introduce complexity and\nreduce the queries' understandability for people who aren't SQL experts.\nSpending time on micro-optimizations for noncritical workloads could also divert\nresources away from building new features for your applications or from identifying\nmore important optimizations. To help you achieve the highest possible return on\ninvestment, we recommend that you focus your optimizations on the workloads that\nmatter most to your data analytics pipelines.\n\nOptimization for capacity and concurrency\n-----------------------------------------\n\nBigQuery offers two pricing models for queries:\n[on-demand](/bigquery/pricing#on_demand_pricing) pricing and\n[capacity-based](/bigquery/pricing#capacity_compute_analysis_pricing)\npricing. The on-demand model provides a shared pool of capacity, and pricing is\nbased on the amount of data that is processed by each query you run.\n\nThe [capacity-based](/bigquery/docs/reservations-workload-management) model is\nrecommended if you want to budget a consistent, monthly expenditure\nor if you need more capacity than is available with the on-demand model.\nWhen you use capacity-based pricing, you allocate dedicated query processing\ncapacity that is measured in [slots](/bigquery/docs/slots).\nThe cost of all bytes processed is included in the capacity-based price.\nIn addition to fixed [slot commitments](/bigquery/docs/reservations-workload-management#slot_commitments),\nyou can use [autoscaling slots](/bigquery/docs/slots-autoscaling-intro),\nwhich provide dynamic capacity based on your query workload.\n\nThe performance of queries that are run repeatedly on the same data can vary,\nand the variation is generally larger for queries using on-demand slots than\nit is for queries using slot reservations.\n\nDuring SQL query processing, BigQuery breaks down the\ncomputational capacity required to execute each stage of a query into\nslots. BigQuery automatically determines the\nnumber of queries that can run concurrently as follows:\n\n- On-demand model: number of slots available in the project\n- Capacity-based model: number of slots available in the reservation\n\nQueries that require more slots than are available are [queued](/bigquery/docs/query-queues)\nuntil processing resources become available. After a query begins execution,\nBigQuery calculates how many slots each query stage\nuses based on the stage size and complexity and the number of slots\navailable. BigQuery uses a technique called [fair scheduling](/bigquery/docs/slots#fair_scheduling_in_bigquery)\nto ensure that each query has enough capacity to progress.\n\nAccess to more slots doesn't always result in faster performance for a query. However, a\nlarger pool of slots can improve the performance of large or complex\nqueries, and the performance of highly concurrent workloads. To\nimprove query performance, you can [modify your slot reservations](/bigquery/docs/reservations-tasks)\nor set a higher limit for [slots autoscaling](/bigquery/docs/slots-autoscaling-intro).\n\nQuery plan and timeline\n-----------------------\n\nBigQuery generates a [query plan](/bigquery/query-plan-explanation) each time that you run a query.\nUnderstanding this plan is critical for effective query optimization.\nThe query plan includes execution statistics such as bytes read and slot time\nconsumed. The query plan also includes details about the different stages of execution, which can help you\ndiagnose and improve query performance. The [query execution graph](/bigquery/docs/query-insights)\nprovides a graphical interface for viewing the query plan and diagnosing query performance issues.\n\nYou can also use the [`jobs.get` API method](/bigquery/docs/reference/rest/v2/jobs/get)\nor the [`INFORMATION_SCHEMA.JOBS` view](/bigquery/docs/information-schema-jobs)\nto retrieve the query plan and timeline information. This information is used by\n[BigQuery Visualiser](https://github.com/GoogleCloudPlatform/professional-services/tree/master/tools/bq-visualizer),\nan open source tool that visually represents the flow of execution stages in a\nBigQuery job.\n\nWhen BigQuery executes a query job, it converts the declarative\nSQL statement into a graph of execution. This graph is broken up into a series\nof query stages, which themselves are composed of more granular sets of\nexecution steps. BigQuery uses a heavily distributed parallel\narchitecture to run these queries. The BigQuery stages model the\nunits of work that\nmany potential workers might execute in parallel. Stages communicate with one\nanother through a\n[fast, distributed shuffle architecture](/blog/products/gcp/in-memory-query-execution-in-google-bigquery).\n\nIn addition to the query plan, query jobs also expose a timeline of execution.\nThis timeline provides an accounting of units of work completed, pending, and\nactive within query workers. A query might have multiple stages with active\nworkers simultaneously, so the timeline is intended to show overall progress of\nthe query.\n\nTo estimate how computationally expensive a query is, you can look at the\ntotal number of slot seconds the query consumes. The lower the number of slot\nseconds, the better, because it means more resources are available to other\nqueries running in the same project at the same time.\n\nThe query plan and timeline statistics can help you understand how\nBigQuery executes queries and if certain stages dominate resource\nutilization. For example, a `JOIN` stage that generates far more output rows than\ninput rows might indicate an opportunity to filter earlier in the query.\nHowever, the managed nature of the service limits whether some details are\ndirectly actionable. For best practices and techniques to improve query\nexecution and performance, see\n[Optimize query computation](/bigquery/docs/best-practices-performance-compute).\n\nWhat's next\n-----------\n\n- Learn how to troubleshoot query execution issues using the [BigQuery audit logs](/bigquery/docs/reference/auditlogs).\n- Learn other [cost-controlling techniques](/bigquery/docs/controlling-costs) for BigQuery.\n- View near real-time metadata about BigQuery jobs using the [`INFORMATION_SHEMA.JOBS` view](/bigquery/docs/information-schema-jobs).\n- Learn how to monitor your BigQuery usage using the [BigQuery System Tables Reports](https://github.com/GoogleCloudPlatform/bigquery-utils/tree/master/dashboards/system_tables)."]]