Monitoraggio delle prestazioni della GPU sulle VM Linux
Mantieni tutto organizzato con le raccolte
Salva e classifica i contenuti in base alle tue preferenze.
Linux
Puoi monitorare metriche come l'utilizzo e la memoria GPU dalle tue istanze di macchine virtuali (VM) utilizzando Ops Agent, la soluzione di raccolta dati di telemetria consigliata da Google per Compute Engine.
Con Ops Agent puoi gestire le VM GPU come segue:
Visualizza l'integrità del tuo parco risorse di GPU NVIDIA con le nostre dashboard preconfigurate.
Ottimizza i costi identificando le GPU sottoutilizzate e consolidando i workload.
Pianifica la scalabilità osservando le tendenze per decidere quando espandere la capacità delle GPU o eseguire l'upgrade delle GPU esistenti.
Utilizza le metriche di profilazione di NVIDIA Data Center GPU Manager (DCGM) per identificare i colli di bottiglia e i problemi di prestazioni delle GPU.
Ricevi avvisi sulle metriche delle tue GPU NVIDIA.
Questo documento illustra le procedure per il monitoraggio delle GPU sulle VM Linux tramite Ops Agent. In alternativa, su GitHub è disponibile uno script per la generazione di report che può essere configurato anche per monitorare l'utilizzo della GPU sulle VM Linux. Visualizza lo script di monitoraggio compute-gpu-monitoring.
Questo script non è più sviluppato attivamente.
Ops Agent, versione 2.38.0 o successive, può monitorare automaticamente la memoria utilizzata della GPU e i tassi di utilizzo della memoria GPU sulle VM Linux su cui è installato l'agente. Queste metriche, ottenute dalla NVIDIA Management Library (NVML), vengono monitorate per singola GPU e processo per qualsiasi processo che utilizza le GPU.
Per visualizzare le metriche monitorate da Ops Agent, consulta Metriche Agent: gpu.
Puoi anche configurare l'integrazione di NVIDIA Data Center GPU Manager (DCGM) con Ops Agent. Questa integrazione consente a Ops Agent di monitorare le metriche utilizzando i contatori hardware sulla GPU. DCGM fornisce l'accesso alle metriche a livello di dispositivo GPU. Sono incluse le metriche su utilizzo dei blocchi del multiprocessore streaming (SM), occupazione SM, utilizzo della pipe SM, frequenza del traffico PCIe e frequenza del traffico NVLink. Per visualizzare le metriche monitorate da Ops Agent, consulta Metriche delle applicazioni di terze parti: NVIDIA Data Center GPU Manager (DCGM).
Per esaminare le metriche della GPU utilizzando Ops Agent, completa i seguenti passaggi:
Su ogni VM, verifica di aver soddisfatto i requisiti.
Il sistema operativo e la versione di Linux per ogni VM devono supportare Ops Agent. Consulta l'elenco dei sistemi operativi Linux che supportano Ops Agent.
Assicurati di disporre dell'accesso sudo per ogni VM.
Installa Ops Agent
Per installare Ops Agent, completa i seguenti passaggi:
Se in precedenza utilizzavi lo compute-gpu-monitoring script di monitoraggio per monitorare l'utilizzo della GPU, disattiva il servizio prima di installare Ops Agent.
Per disattivare lo script di monitoraggio, esegui questo comando:
(Facoltativo) Configura l'integrazione di NVIDIA Data Center GPU Manager (DCGM)
Ops Agent fornisce inoltre l'integrazione di NVIDIA Data Center GPU Manager (DCGM) per raccogliere le metriche GPU avanzate chiave, come utilizzo dei blocchi del multiprocessore streaming (SM) l'occupazione SM, l'utilizzo della pipe SM, la frequenza di traffico PCIe e la frequenza di traffico NVLink.
Queste metriche avanzate della GPU non vengono raccolte dai modelli NVIDIA P100 e P4.
Nel campo filter_listFiltro, digita NVIDIA. Viene visualizzata la dashboard Panoramica del monitoraggio delle GPU NVIDIA (GCE e GKE).
Se hai configurato l'integrazione di NVIDIA Data Center GPU Manager (DCGM), viene visualizzata anche la dashboard Metriche DCGM avanzate per il monitoraggio delle GPU NVIDIA (solo GCE).
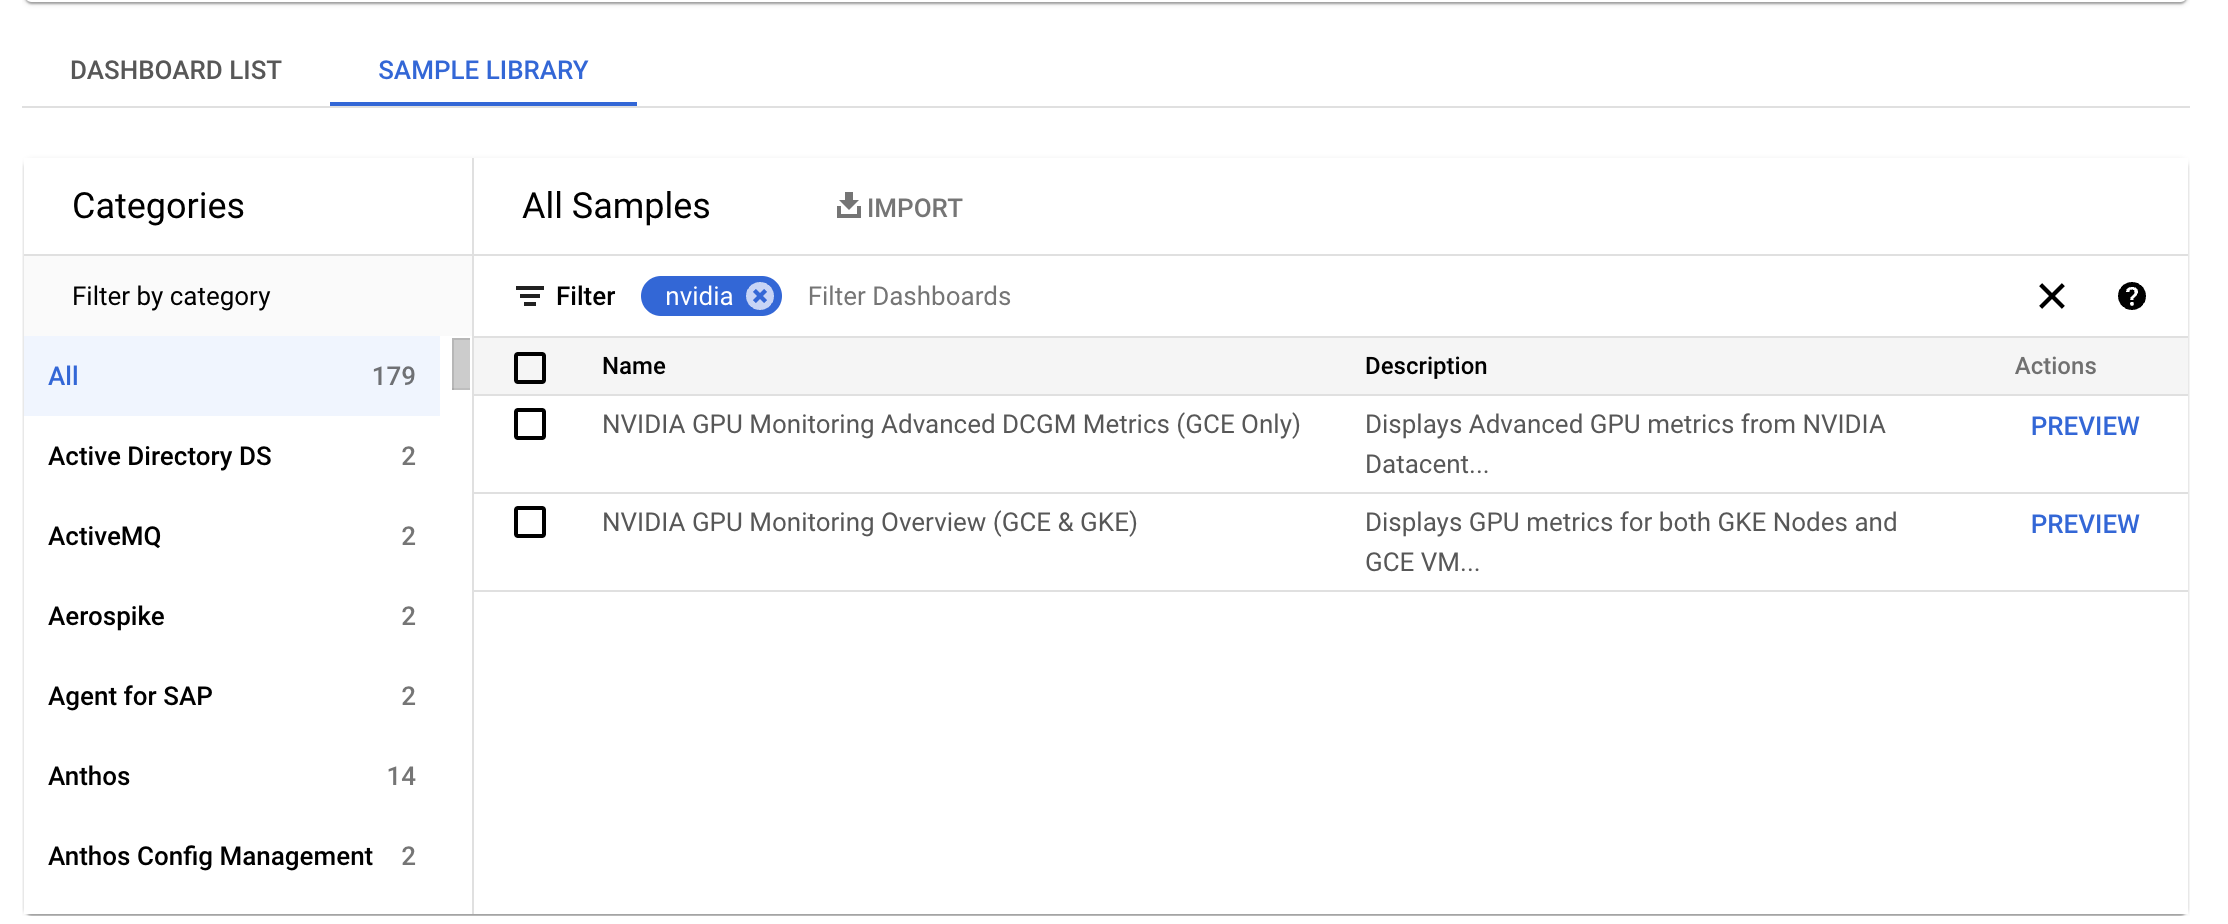
Per la dashboard richiesta, fai clic su Anteprima. Viene visualizzata la pagina Anteprima dashboard di esempio.
Nella pagina Anteprima dashboard di esempio, fai clic su Importa dashboard di esempio.
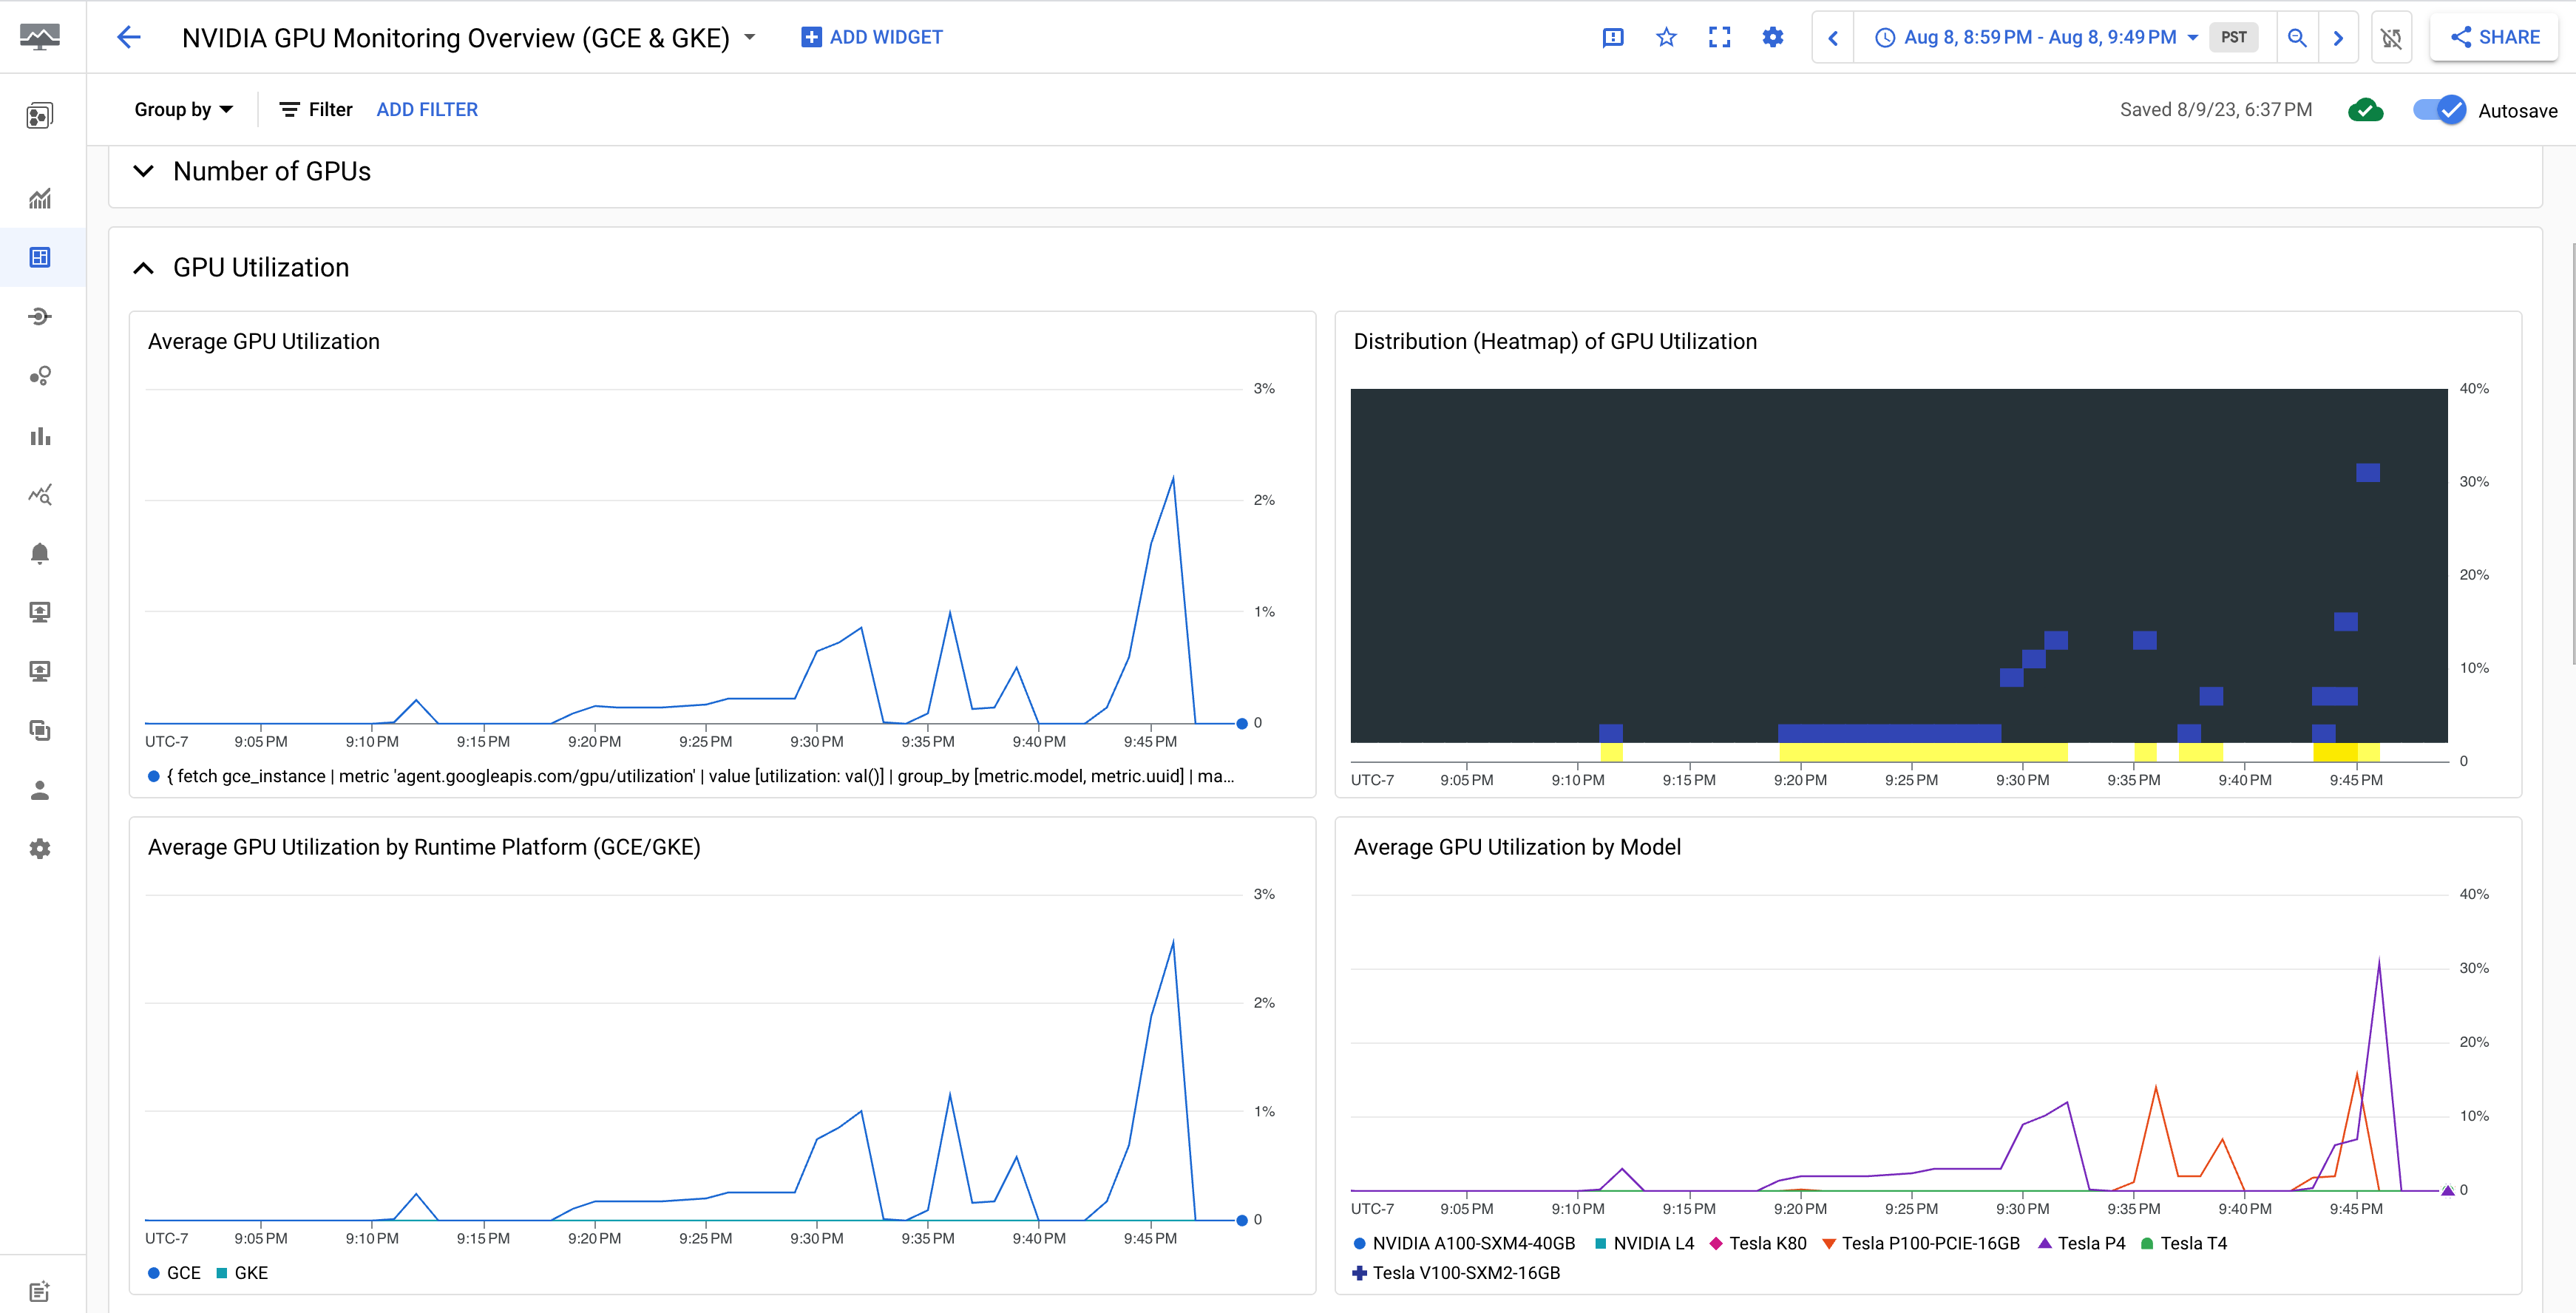
La dashboard Panoramica del monitoraggio delle GPU NVIDIA (GCE e GKE) mostra le metriche della GPU, come l'utilizzo della GPU, la frequenza del traffico NIC e l'utilizzo della memoria GPU.
La visualizzazione dell'utilizzo della GPU è simile al seguente output:
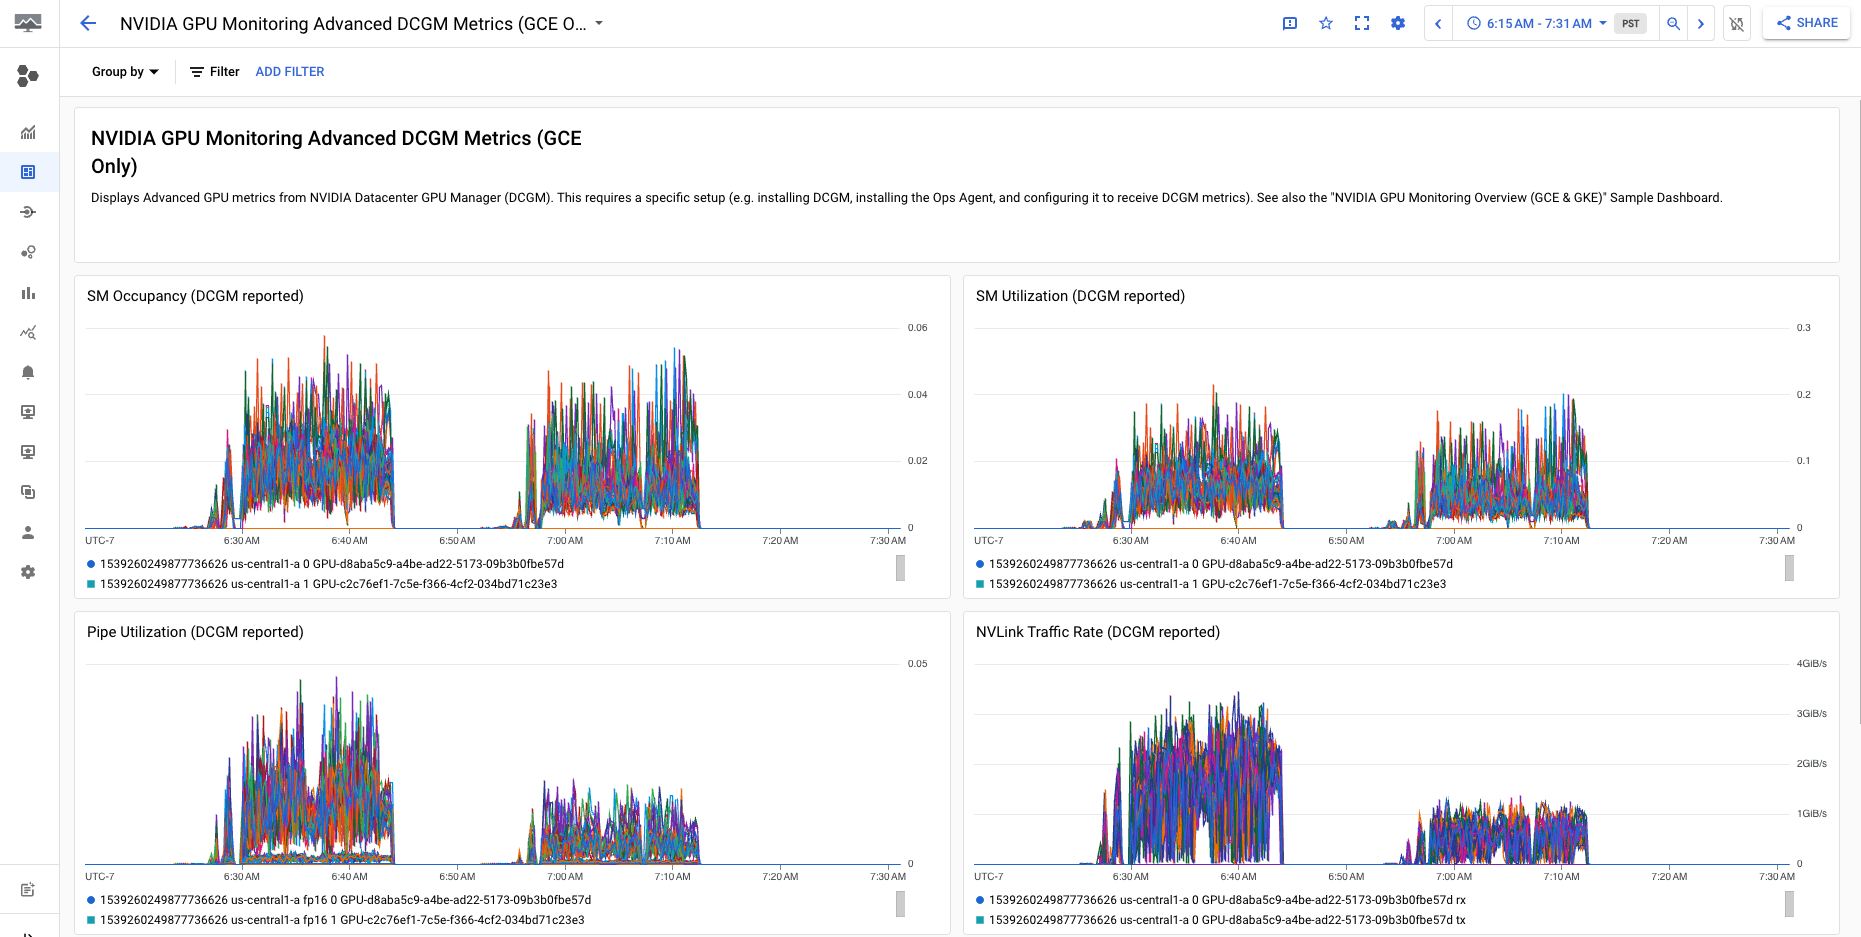
La dashboard Metriche DCGM avanzate per il monitoraggio delle GPU NVIDIA (solo GCE) mostra metriche avanzate chiave come utilizzo SM, occupazione SM, utilizzo della pipe SM, frequenza del traffico PCIe e frequenza del traffico NVLink.
La visualizzazione delle metriche DCGM avanzate è simile al seguente output:
[[["Facile da capire","easyToUnderstand","thumb-up"],["Il problema è stato risolto","solvedMyProblem","thumb-up"],["Altra","otherUp","thumb-up"]],[["Difficile da capire","hardToUnderstand","thumb-down"],["Informazioni o codice di esempio errati","incorrectInformationOrSampleCode","thumb-down"],["Mancano le informazioni o gli esempi di cui ho bisogno","missingTheInformationSamplesINeed","thumb-down"],["Problema di traduzione","translationIssue","thumb-down"],["Altra","otherDown","thumb-down"]],["Ultimo aggiornamento 2025-08-04 UTC."],[[["\u003cp\u003eThe Ops Agent, version 2.38.0 or later, is Google's recommended solution for tracking GPU utilization and memory on Linux virtual machines (VMs) and can manage your GPU VMs.\u003c/p\u003e\n"],["\u003cp\u003eUsing the Ops Agent, you can visualize GPU fleet health, optimize costs, plan scaling, identify bottlenecks with NVIDIA Data Center GPU Manager (DCGM) profiling metrics, and set alerts.\u003c/p\u003e\n"],["\u003cp\u003eThe Ops Agent collects metrics from the NVIDIA Management Library (NVML) and, with optional DCGM integration, can track advanced GPU metrics such as Streaming Multiprocessor utilization and PCIe traffic rate.\u003c/p\u003e\n"],["\u003cp\u003eTo use the Ops Agent, users must ensure their VMs have attached GPUs, installed GPU drivers, and support the Ops Agent with their Linux operating system, in addition to installing the agent.\u003c/p\u003e\n"],["\u003cp\u003eYou can review NVML metrics within the Compute Engine's Observability tab and review DCGM metrics in the Monitoring section, with provided dashboards.\u003c/p\u003e\n"]]],[],null,["# Monitoring GPU performance on Linux VMs\n\nLinux\n\n*** ** * ** ***\n\n| **Tip:** If you want to monitor A4 or A3 Ultra machine types that are deployed using the features provided by Cluster Director, see [Monitor VMs and clusters](/ai-hypercomputer/docs/monitor) in the AI Hypercomputer documentation instead.\n\nYou can track metrics such as GPU utilization and GPU memory from your\nvirtual machine (VM) instances by using the\n[Ops Agent](/stackdriver/docs/solutions/agents/ops-agent), which is\nGoogle's recommended telemetry collection solution for Compute Engine.\nBy using the Ops Agent, you can manage your GPU VMs as follows:\n\n- Visualize the health of your NVIDIA GPU fleet with our pre-configured dashboards.\n- Optimize costs by identifying underutilized GPUs and consolidating workloads.\n- Plan scaling by looking at trends to decide when to expand GPU capacity or upgrade existing GPUs.\n- Use NVIDIA Data Center GPU Manager (DCGM) profiling metrics to identify bottlenecks and performance issues within your GPUs.\n- Set up [managed instance groups (MIGs)](/compute/docs/instance-groups#managed_instance_groups) to autoscale resources.\n- Get alerts on metrics from your NVIDIA GPUs.\n\nThis document covers the procedures for monitoring GPUs on Linux VMs by using\nthe Ops Agent. Alternatively, a reporting script is available on GitHub that can\nalso be setup for monitoring GPU usage on Linux VMs, see\n[`compute-gpu-monitoring` monitoring script](https://github.com/GoogleCloudPlatform/compute-gpu-monitoring/tree/main/linux).\nThis script is not actively maintained.\n\nFor monitoring GPUs on Windows VMs, see\n[Monitoring GPU performance (Windows)](/compute/docs/gpus/monitor-gpus-windows).\n\nOverview\n--------\n\nThe Ops Agent, version 2.38.0 or later, can automatically track GPU\nutilization and GPU memory usage rates on your Linux VMs that have the agent\ninstalled. These metrics, obtained from the NVIDIA Management Library (NVML),\nare tracked per GPU and per process for any process that uses GPUs.\nTo view the metrics that are monitored by the Ops Agent,\nsee [Agent metrics: gpu](/monitoring/api/metrics_opsagent#agent-gpu).\n\nYou can also set up the NVIDIA Data Center GPU Manager (DCGM) integration with\nthe Ops Agent. This integration allows the Ops Agent to track metrics\nusing the hardware counters on the GPU. DCGM provides access to the\nGPU device-level metrics. These include Streaming Multiprocessor (SM)\nblock utilization, SM occupancy, SM pipe utilization, PCIe traffic rate,\nand NVLink traffic rate. To view the metrics monitored by the Ops Agent, see\n[Third-party application metrics: NVIDIA Data Center GPU Manager (DCGM)](/monitoring/api/metrics_opsagent#opsagent-dcgm).\n\nTo review GPU metrics by using the Ops Agent, complete the following steps:\n\n1. On each VM, check that you have met [the requirements](#requirements).\n2. On each VM, [install the Ops Agent](#install-ops-agent).\n3. Optional: On each VM, set up the [NVIDIA Data Center GPU Manager (DCGM) integration](#dcgm).\n4. Review [metrics in Cloud Monitoring](#review-metrics-dashboard).\n\nLimitations\n-----------\n\n- The Ops Agent doesn't track GPU utilization on VMs that use Container-Optimized OS.\n\nRequirements\n------------\n\nOn each of your VMs, check that you meet the following requirements:\n\n- Each VM must have [GPUs attached](/compute/docs/gpus/create-vm-with-gpus).\n- Each VM must have a [GPU driver installed](/compute/docs/gpus/install-drivers-gpu#verify-driver-install).\n- The Linux operating system and version for each of your VM must support the Ops Agent. See the list of [Linux operating systems](/stackdriver/docs/solutions/agents/ops-agent#linux_operating_systems) that support the Ops Agent.\n- Ensure you have `sudo` access to each VM.\n\nInstall the Ops Agent\n---------------------\n\nTo install the Ops Agent, complete the following steps:\n\n1. If you were previously using the\n [`compute-gpu-monitoring` monitoring script](https://github.com/GoogleCloudPlatform/compute-gpu-monitoring/tree/main/linux)\n to track GPU utilization, disable the service before installing the Ops Agent.\n To disable the monitoring script, run the following command:\n\n ```\n sudo systemctl --no-reload --now disable google_gpu_monitoring_agent\n ```\n2. Install the latest version of the Ops Agent. For detailed instructions, see\n [Installing the Ops Agent](/stackdriver/docs/solutions/agents/ops-agent/install-index).\n\n3. After you have installed the Ops agent, if you need to install or upgrade your\n GPU drivers by using the\n [installation scripts provided by Compute Engine](/compute/docs/gpus/install-drivers-gpu#installation_scripts),\n review the *limitations* section.\n\nReview NVML metrics in Compute Engine\n-------------------------------------\n\nYou can review the NVML metrics that the Ops Agent collects from the\n**Observability** tabs for Compute Engine Linux VM instances.\n\nTo view the metrics for a single VM do the following:\n\n1. In the Google Cloud console, go to the **VM instances** page.\n\n [Go to VM instances](https://console.cloud.google.com/compute/instances)\n2. Select a VM to open the **Details** page.\n\n3. Click the **Observability** tab to display information about the VM.\n\n4. Select the **GPU** quick filter.\n\nTo view the metrics for multiple VMs, do the following:\n\n1. In the Google Cloud console, go to the **VM instances** page.\n\n [Go to VM instances](https://console.cloud.google.com/compute/instances)\n2. Click the **Observability** tab.\n\n3. Select the **GPU** quick filter.\n\nOptional: Set up NVIDIA Data Center GPU Manager (DCGM) integration\n------------------------------------------------------------------\n\nThe Ops Agent also provides integration for NVIDIA Data Center GPU Manager\n(DCGM) to collect key advanced GPU metrics such as Streaming Multiprocessor (SM)\nblock utilization, SM occupancy, SM pipe utilization, PCIe traffic rate,\nand NVLink traffic rate.\n\nThese advanced GPU metrics are not collected from NVIDIA P100 and P4 models.\n\nFor detailed instructions on how to setup and use this integration on each VM,\nsee [NVIDIA Data Center GPU Manager (DCGM)](/stackdriver/docs/solutions/agents/ops-agent/third-party-nvidia).\n\nReview DCGM metrics in Cloud Monitoring\n---------------------------------------\n\n1. In the Google Cloud console, go to the **Monitoring \\\u003e Dashboards** page.\n\n [Go to Monitoring](https://console.cloud.google.com/monitoring/dashboards)\n2. Select the **Sample Library** tab.\n\n3. In the filter_list **Filter** field,\n type **NVIDIA** . The\n **NVIDIA GPU Monitoring Overview (GCE and GKE)**\n dashboard displays.\n\n If you have set up the NVIDIA Data Center GPU Manager (DCGM) integration, the\n **NVIDIA GPU Monitoring Advanced DCGM Metrics (GCE Only)**\n dashboard also displays.\n\n4. For the required dashboard, click **Preview** . The **Sample dashboard preview**\n page displays.\n\n5. From the **Sample dashboard preview** page, click **Import sample dashboard**.\n\n - The **NVIDIA GPU Monitoring Overview (GCE and GKE)**\n dashboard displays the GPU metrics such as GPU utilization, NIC traffic rate,\n and GPU memory usage.\n\n Your GPU utilization display is similar to the following output:\n\n - The\n **NVIDIA GPU Monitoring Advanced DCGM Metrics (GCE Only)**\n dashboard displays key advanced metrics such as SM utilization, SM occupancy,\n SM pipe utilization, PCIe traffic rate, and NVLink traffic rate.\n\n Your Advanced DCGM Metric display is similar to the following output:\n\nWhat's next?\n------------\n\n- To handle GPU host maintenance, see [Handling GPU host maintenance events](/compute/docs/gpus/gpu-host-maintenance).\n- To improve network performance, see [Use higher network bandwidth](/compute/docs/gpus/optimize-gpus)."]]