Investigate an asset
To investigate an asset in Google Security Operations using Asset view:
Enter the hostname, client IP address, or MAC address for the asset you want to investigate:
- Hostname: Either short (for example,
mattu) or fully qualified (for example,mattu.ads.altostrat.com). - Internal IP address: Internal IP address for the client (for example,
10.120.89.92). Both IPv4 and IPv6 are supported. - MAC address: MAC address for any device within your enterprise (for
example,
00:53:00:4a:56:07).
- Hostname: Either short (for example,
Enter a timestamp for the asset (current UTC time and date by default).
Click Search.
Asset view
Asset view provides information about the events and details of an asset within your environment to gain insights. The default settings in Asset view can be different based on the context of usage. For example, when you open Asset view from a specific alert, only the information related to that alert is visible.
You can adjust Asset view to hide benign activity and help highlight the data relevant to an investigation. The following descriptions refer to the user interface elements in Asset view.
TIMELINE sidebar list
When you search for an asset, activity returns a default time window of 2 hours. Hovering over the header categories row displays the sorting control for each column, letting you sort alphabetically or by time depending on the category. Adjust the time window using the time slider or by scrolling the mouse wheel while the cursor is over the Prevalence Graph. See also the Time Slider and Prevalence Graph.
DOMAINS sidebar list
Use this list to see the first lookup of each distinct domain within a given time window, helping to hide noise caused by assets frequently connecting to domains.
Time slider
The Time Slider lets you adjust the time period under examination. You can adjust the slider to view between one minute and one day of events (you can also adjust this using the scroll wheel of your mouse over the Prevalence Graph).
Asset information section
This section provides additional information about the asset, including the client IP and MAC address associated with a given hostname for the specified time period. It also provides information on when the asset was first observed in your enterprise and the time data was last collected.
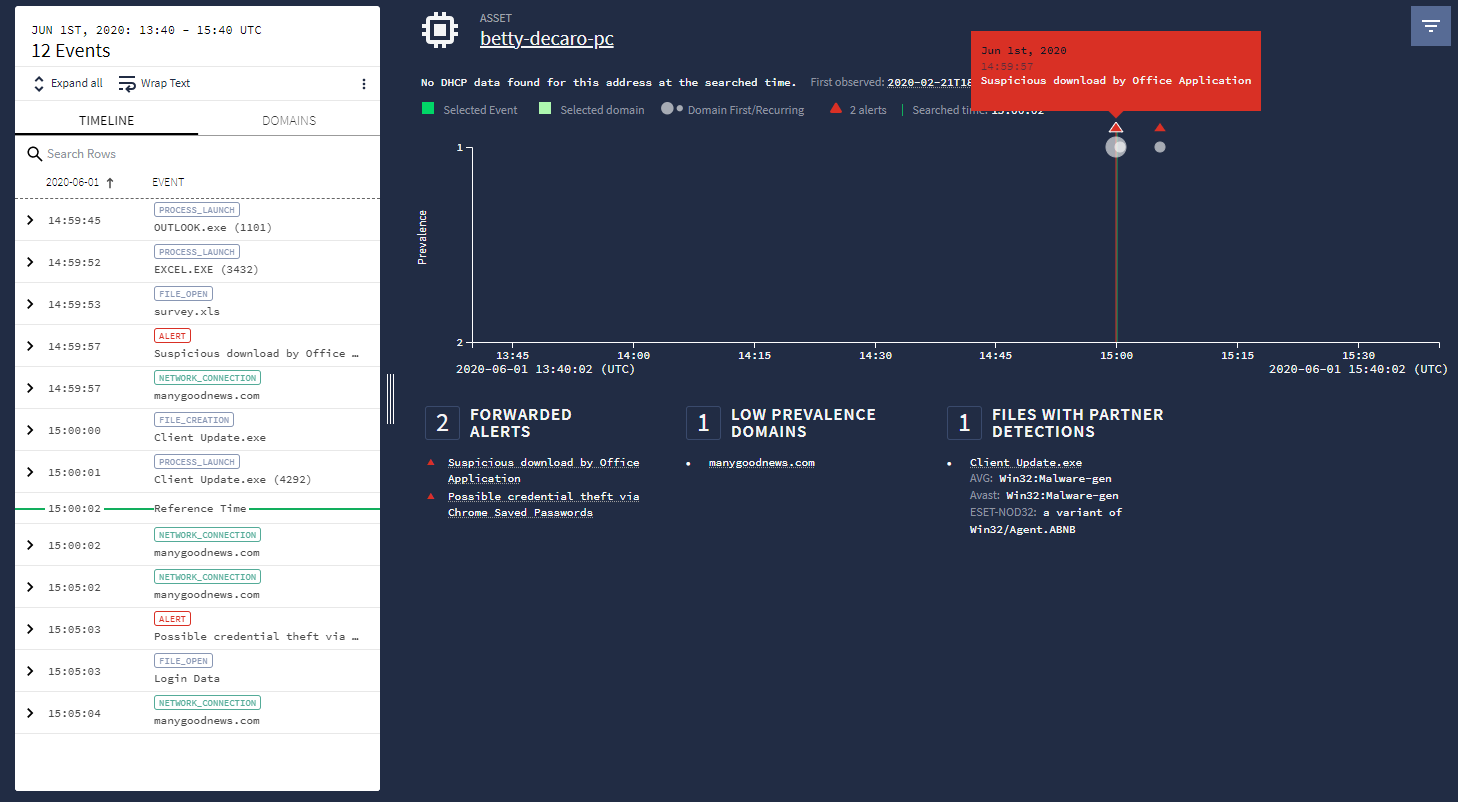
Prevalence graph
The Prevalence graph shows the maximum number of assets in the enterprise that have recently connected to the displayed network domain. Large gray circles indicate first connections to domains. Small gray circles indicate subsequent connections to the same domain. Frequently accessed domains fall to the bottom of the graph while infrequently accessed domains rise to the top. The red triangles displayed on the graph are associated with security alerts at the time specified under the prevalence graph.
Asset insight blocks
The Asset Insight blocks highlight the domains and alerts that you might want to investigate further. They provide additional context as to what might have triggered an alert and can help you determine if a device is compromised. The Asset Insight blocks are a reflection of the displayed events and vary depending on their threat relevance.
Forwarded alerts block
Alerts from your existing security infrastructure. These alerts are labeled with a red triangle in Google SecOps and might warrant further investigation.
Newly registered domains block
- Leverages WHOIS registration metadata to determine if the asset queried domains that have been recently registered (in the past 30 days from the start of the search time window).
- Recently registered domains typically have a higher threat relevance since
they might have been explicitly created to avoid existing security filters.
Appears for the Fully Qualified Domain Name (FQDN) at the current view's
timestamp. For example:
- John's asset connected to bar.example.com on May 29, 2018.
- example.com was registered on May 4, 2018.
- bar.example.com appears as a newly registered domain when you investigate John's asset on May 29, 2018.
Domains new to the enterprise block
- Examines your company's DNS data to determine whether an asset queried
domains that have never been visited before by anyone at your company. For
example:
- Jane's asset connected to bad.altostrat.com on May 25, 2018.
- A few other assets visited phishing.altostrat.com on May 10, 2018, but there is no other activity for altostrat.com or any of its subdomains in your organization before May 10, 2018.
- bad.altostrat.com is displayed under the Domains New to the Enterprise insights block when investigating Jane's asset on May 25, 2018.
Low prevalence domains block
- Summary of the domains a particular asset queried having low prevalence.
- Insight for a Fully Qualified Domain Name is based on the prevalence of its
Top Private Domain (TPD) where prevalence is less than or equal to 10. The
TPD takes into account the public suffix
list{target="console"}
For example:
- Mike's asset connected test.sandbox.altostrat.com on May 26, 2018.
- Since sandbox.altostrat.com has a prevalence of 5, test.sandbox.altostrat.com is displayed under the Low Prevalence Domain insight block.
ET Intelligence Rep List block
- Proofpoint, Inc.{target="console"} publishes the Emerging Threats (ET) Intelligence Rep List composed of suspicious IP addresses and domains.
- Domains are matched against the asset-to-indicator lists for the current time range.
US DHS AIS block
- United States (US) Department of Homeland Security (DHS) Automated Indicator Sharing (AIS).
- Cyber threat indicators compiled by DHS, including malicious IP addresses and the sender addresses of phishing emails.
Alerts
The following figure shows third-party alerts that are correlated to the asset under investigation. These alerts can come from popular security products (such as anti-virus software, intrusion detection systems, and hardware firewalls). They provide you with additional context when investigating an asset.
 Alerts
in Asset view
Alerts
in Asset view
Filtering the data
You can filter the data using either default filtering or procedural filtering.
Default filtering
The time period of an Asset view is set to two hours by default. When an asset is involved in an alert investigation and you view the asset from the alerts investigation, the Asset view is automatically filtered to display only the events that apply to that investigation.
Procedural filtering
In procedural filtering, you can filter on fields such as event type, log source, auth type, network connection status, and PID. You can adjust the time period and the prevalence graph settings for your investigation. The prevalence graph makes it easier to identify outliers in events such as domain connections and login events.
To open the Procedural Filtering menu, click the ![]() icon in the top-right
corner of the Google SecOps user interface.
icon in the top-right
corner of the Google SecOps user interface.
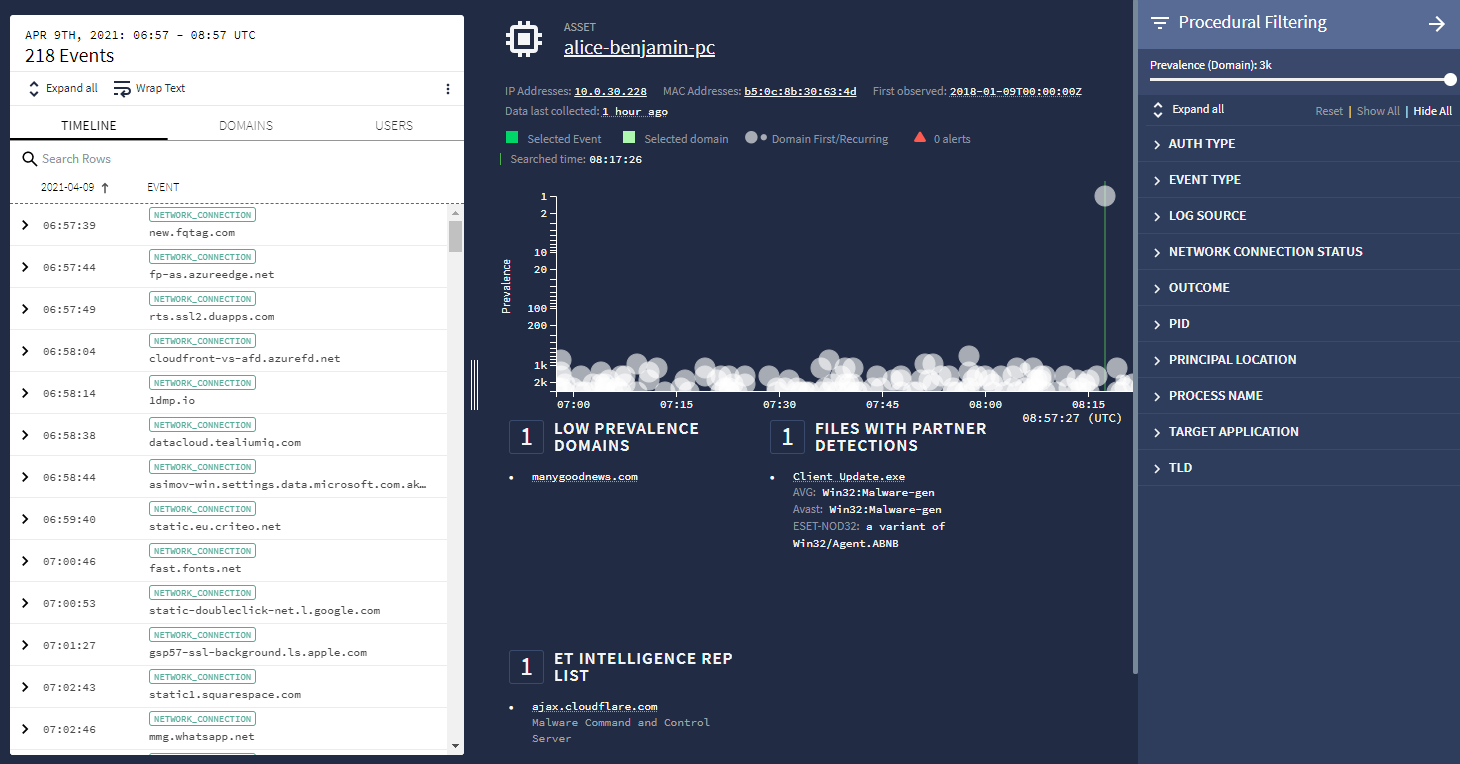 Procedural Filtering menu
The Procedural Filtering menu, shown in the following figure, lets you further filter information pertaining to an asset, including:
- Prevalence
- Event type
- Log source
- Network connection status
- Top Level Domain (TLD)
Prevalence measures the number of assets within your enterprise connected to a specific domain over the past seven days. More assets connecting to a domain means that the domain has greater prevalence within your enterprise. High prevalence domains, such as google.com, are unlikely to require investigation.
You can use the Prevalence slider to filter out the high prevalence domains and focus on the domains which fewer assets across your enterprise have accessed. The minimum Prevalence value is 1, meaning you could focus on the domains which are linked to a single asset within your enterprise. The maximum value varies depending on the number of assets you have within your enterprise.
Hovering over an item brings up controls that let you include, exclude, or view only the data relevant to that item. As shown in the following figure, you can set the control to view only the top-level domains (TLDs) by clicking the O icon.
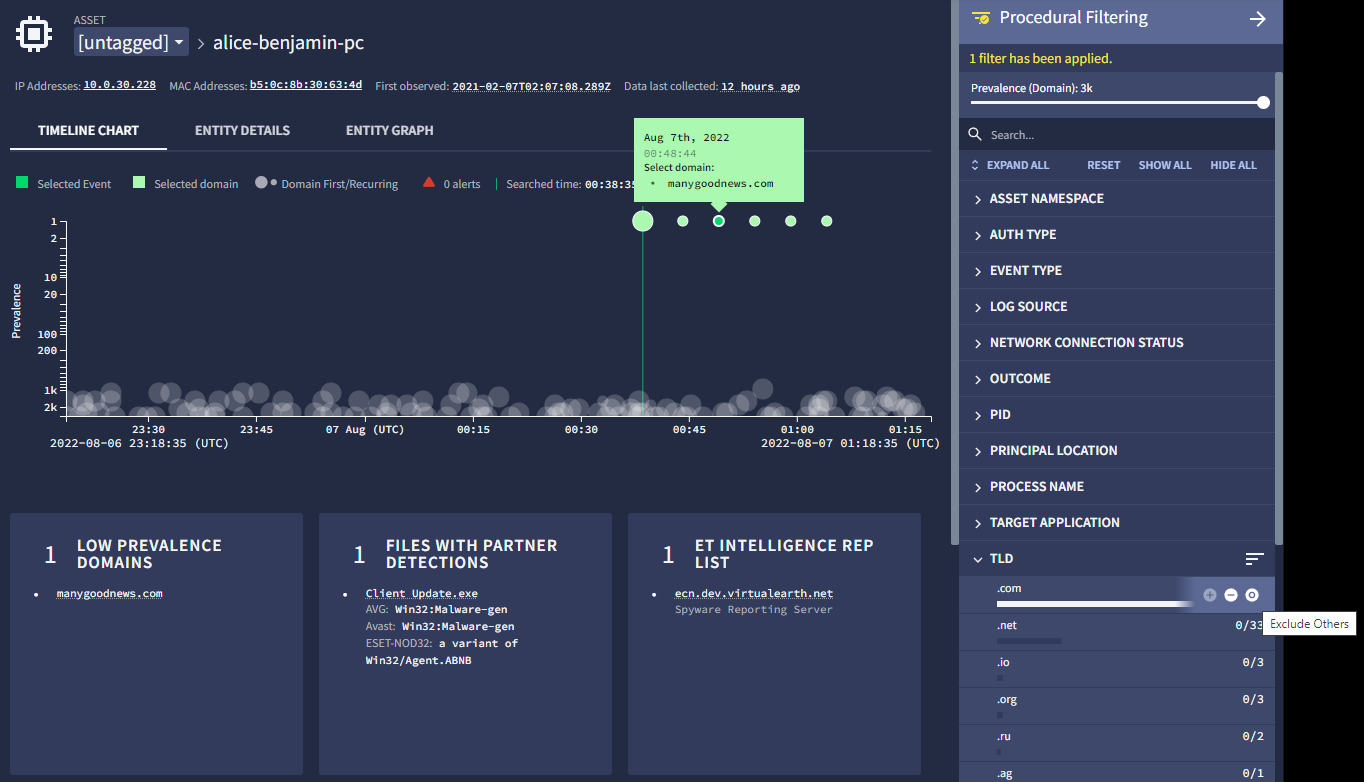 Procedural filtering on a single TLD.
The Procedural Filtering menu is also available from Enterprise Insights view.
Viewing security vendor data in the timeline
You can use procedural filtering to view events from specific security vendors for an asset in Asset view. For example, you can use the Log Source filter to focus on events from a security vendor such as Tanium.
You can then view the Tanium events from the Timeline sidebar.
To learn about creating asset namespaces, go to the main Asset namespace article.
Considerations
Asset view has the following limitations:
- Only 100k events can be displayed in this view.
- You can only filter events that appear in this view.
- Only DNS, EDR, Webproxy, Alert, and User event types are populated in this view. The first seen and last seen information populated in this view is also limited to these event types.
- Generic events don't appear in any of the curated views. They appear only in raw log and UDM searches.
Need more help? Get answers from Community members and Google SecOps professionals.