Investigate an alert
Alerts are tied to data identified as a threat by your security systems. Investigating alerts gives you context about the alert and related entities.
When you click an alert, you are directed to a page that contains alert details organized into the following three tabs:
- Overview: provides a summary of important details about the alert, including alert status and detection window.
- Graph: visualizes alerts that are generated from a YARA-L rule. It
provides a graph of the alert's relationship to other entities. When an
alert is triggered, entities associated with the alert are displayed on the
graph and on the left side of the screen, each with its own card. The alert
graph uses the following entities in a UDM event:
principal,target,src,observer,intermediary, andabout. - Alert history: lists all the changes that have happened to this alert, including when the status of an alert has changed or a note has been added.
Below the graph that visualizes the relationships between the entities and the alert are the following three subtabs that provide more context about the alert:
- Events: contains details about the events related to the alert.
- Entities: contains details about each entity associated with the alert.
- Alert context: provides additional context about the alert.
Before you begin
To populate the alert graph, you need to create a YARA-L rule that generates alerts. The quality of the alert graph is tied to the context that is built into the YARA-L rule. The outcome section of a rule provides context to the detections triggered by the rule.
We recommend adding the following UDM
nouns to the
outcome section, because they are used in the alert graph:
principal, target, src, observer, intermediary, and about
. For these
UDM nouns, the following fields are used in the alert graph:
artifact.ipasset.asset_idasset.hostnameasset.ipasset.macasset.product_object_idasset_iddomain.namefile.md5file.sha1file.sha256hostnameipmacprocess.file.md5process.file.sha1process.file.sha256resource.nameurluser.email_addressesuser.employee_iduser.product_object_iduser.useriduser.windows_sid
The values in the preceding list of UDM fields also link to UDM search from the Alert context subtab. For more information, see View context about the alert.
In the following YARA-L rule, an alert is generated when a significant number of Google Cloud service APIs have been disabled within a short time frame (1 hour).
rule gcp_multiple_service_apis_disabled {

  meta:
    author = "Google Cloud Security"
    description = "Detect when multiple Google Cloud Service APIs are disabled in a short period of time."
    severity = "High"
    priority = "High"

  events:
    $gcp.metadata.event_type = "USER_RESOURCE_UPDATE_CONTENT"
    $gcp.metadata.log_type = "GCP_CLOUDAUDIT"
    $gcp.metadata.product_event_type = "google.api.serviceusage.v1.ServiceUsage.DisableService"
    $gcp.security_result.action = "ALLOW"
    $gcp.target.application = "serviceusage.googleapis.com"
    $gcp.principal.user.userid = $userid

  match:
    $userid over 1h

  outcome:
    $risk_score = max(75)
    $network_http_user_agent = array_distinct($gcp.network.http.user_agent)
    $principal_ip = array_distinct($gcp.principal.ip)
    $principal_user_id = array_distinct($gcp.principal.user.userid)
    $principal_user_display_name = array_distinct($gcp.principal.user.user_display_name)
    $target_resource_name = array_distinct($gcp.target.resource.name)
    $dc_target_resource_name = count_distinct($gcp.target.resource.name)

  condition:
    $gcp and $dc_target_resource_name > 5
}
After an alert is generated, you can navigate to the Alert graph page to obtain more context about the alert and to further investigate it.
Navigate to the Alert graph
You can access the Graph from the Alerts and IOCs page or the UDM Search page.
Access the Alert graph from Alerts and IOCs
The Alerts and Indicators of Compromise (IOC) page enables you to filter and view all the alerts and IOCs that are currently affecting your enterprise. To learn more about this page and how to view IOC matches, visit View Alerts and IOCs.
To view more information about an alert from the Alerts and IOCs page, complete the following steps:
- From the navigation bar, click Detections > Alerts and IOCs.
- Find the alert you want to investigate in the alerts table.
- In that alert's row, click the text in the name column to open Alert graph.
Access the Alert graph from UDM Search
- At the top of the navigation bar, select Search.
- Load a search with Search Manager or create a new search. Learn more
about conducting a search in UDM in UDM
Search.
- Three tabs are displayed: Overview, Entity, and Alerts. Click Alerts.
- Click the alert you want to investigate. The Alert viewer is displayed.
- Click View details to open Alert view.
- Click the Graph tab to display Alert graph.
View details about an alert
In Alert view, the Overview tab displays the following information with regards to the alert:
- Alert Details: Alert status, creation date, severity, priority, and risk score.
- Detection Summary: Detection rule that generated the alert. You can view other alerts from the same detection rule.
- Events: Events associated with this alert.
Inputs: Details the data sources that generated the alert. The contents vary depending on the following alert types.
Standard detection: Displays the events and associated entities that triggered the rule.
Composite detection: Displays the events, entities, and the underlying detections that served as inputs to the rule.
An alert is a composite detection when:
The Inputs column shows Detection as a source.
The Detection type column displays an Alert or Detection label with a number next to it (for example,
Alert (3)).
This indicates that a detection, or a chain of detections, triggered the alert, rather than raw events or entities alone.
You can view and analyze these underlying detections in the Detections table by using the following features:
Expand the rows to view nested detections, associated event data, and related entity information.
Customize your view by using the column manager to select and arrange columns in the table.
In addition to viewing important information, you can adjust the alert status.
Change the alert status
- Click Change alert status in the upper right hand corner.
- In the window that appears, update the severity and priority levels accordingly.
- Click Save.
Close the alert
- Click Close alert.
- In the window that appears, you have the option to leave a note to add more context about why you closed the alert.
- Enter your information and press Save.
View entity relationships
The Graph shows you how different alerts and entities are connected. This feature gives you a visual, interactive graph that you can use to expand relationship information about existing entities to surface unknown relationships. You can also expand your search by increasing the time range and expanding past point-in-time alerts for richer alert paths.
You can also expand your search by clicking the + icon in the upper right hand side of any node. Doing this displays all the nodes related to that entity.
Graph icons
Different entities are represented by different icons.
| Icon | Entity the icon represents | Explanation |
| User | A user is a person or other entity that requests access to and uses information from your network. Examples: janedoe, cloudysanfrancisco@gmail.com | |
| database | Resource | Resources are a generic term for entities that have their own unique resource name. Examples: BigQuery table, database, and project. |
| IP Address | ||
| description | File | |
| Domain name | ||
| URL | ||
| device_unknown | Unknown entity type | An entity type not recognized by Google SecOps's software. |
| memory | Asset | An asset is anything that produces value for your organization. This can include hostnames, MAC addresses, and internal IP addresses. Examples: 10.120.89.92 (internal IP address), 00:53:00:4a:56:07 (MAC address) |
If two or more alerts come from the same rule, they are grouped together in a group icon. Indicators that represent the same entity are consolidated into one icon.
To learn more about each of these icons, review the following documents:
- Investigate a user
- Resource-oriented design
- Investigate an asset
- Investigate a Domain
- Investigate a file
- Investigate an IP address
Navigate the alert graph
When you click Alert graph, the graph shows all results 12 hours before and after the alert. If there are no entities for the alert, only the original alert appears on the graph.
The main alert is highlighted in a red circle. Alerts are connected to entities with a solid line and other alerts with a dotted line. If you hold the pointer over an edge (the line connecting two nodes), it shows you the outcome variable or match variable that connects it to a node on the graph.
On the left-hand side, there are cards for each node that include details about associated rules, detection windows, severity and priority status, and more.
Directly above the graph is a button labeled Graph options. When you click Graph options, two options appear: Non-alerting detections and Risk score. Both are toggled on by default and can be toggled on or off based on your preference.
To move the nodes, simply drag the nodes around the graph. When you release the node, it is pinned where you left it until you click Refresh.
Add and remove nodes
If you click a node, a table appears at the bottom of the screen. You can do the following actions on each node:
Alert
- See related entities, alerts, and events
- See outcomes and matches from the alert
- Remove any subgraph
- Add or remove related entities and alerts from the graph by checking boxes in the On Graph column
Entity
- See all related alerts
- Remove any subgraph
- Add or remove related alerts from the graph by checking or unchecking boxes in the On Graph column
Group
- See all the entities or alerts that make up that group
- Ungroup individual nodes by clicking On Graph on the table at the bottom of the page.
To add or remove the risk score from the nodes, check or uncheck the Risk Score box above the table.
Expand the alert graph
To see more related nodes, click the + icon at the bottom of the alert. The entities and alerts related to the icon you selected pop up. Each new alert has a card on the side with more details.
Reset the graph
If you want to clear the graph, you can adjust the time range in the right hand window. The maximum range is 90 days. Resetting the time range also resets the graph to its original state. Updating the time range clears the graph of any additional nodes and resets the graph to its original state.
To move the nodes back to the default position, click refresh.
View context about the alert
The Alert context section contains a list of values that provide additional context about the alert.
The alert context has a Type column that tells you which part of the rule generated the alert that you selected—outcome or match. The next column is called Variable. These variable names are based on the names of the match and outcome variables defined in the rule. Finally, the far right column is UDM Field. Variables that have a UDM field listed are also linked in the Values column.
In addition to the UDM fields listed in the Before you begin section, the following UDM fields are also linked to the UDM search page:
file.full_pathprocess.command_lineprocess.file.full_pathprocess.parent_process.product_specific_process_idprocess.pidprocess.product_specific_process_idresource.product_object_id
The specific UDM nouns that are associated with these fields are
principal, target, src, observer, intermediary, and about
. If
you click a value, a UDM
search is triggered, passing the
value along with the time range of the past day.
In the example YARA-L rule featured in the Before you begin section, the following UDM fields will be linked to the UDM search page:
principal.ipprincipal.user.useridprincipal.user.user_display_nametarget.resource.name
View alert history
The Alert History tab allows you to see a full history of all of the actions that have taken place for this alert. This includes:
- When the alert first appeared
- Any notes people on your team have left about this alert
- If the severity has changed
- If priority has been changed
- If the alert has been closed
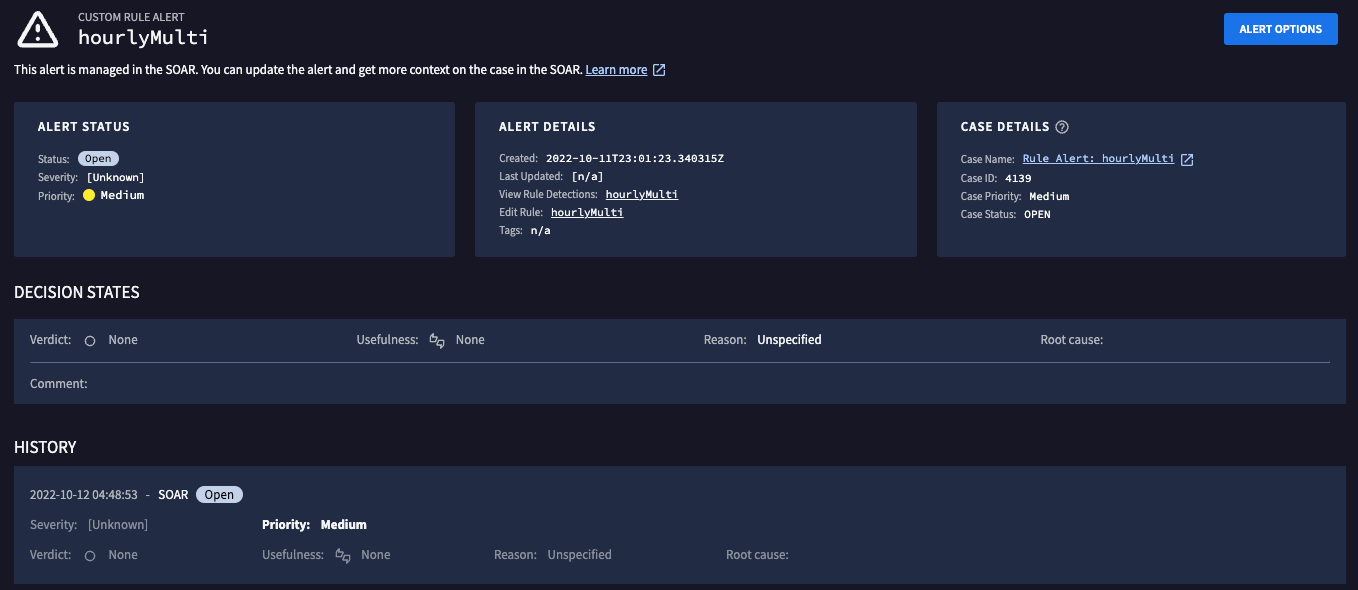
Alerts from Google Security Operations SOAR
Alerts from Google Security Operations SOAR include additional information about the Google Security Operations SOAR case. These alerts also provides a link to open the case in Google Security Operations SOAR. For more information, see the Google Security Operations SOAR cases overview.
Alert for Google Security Operations SOAR case
Need more help? Get answers from Community members and Google SecOps professionals.