Visualiza datos geoespaciales
Las estadísticas geoespaciales te permiten visualizar los datos de ubicación geográfica con los siguientes elementos:
BigQuery Studio
BigQuery Studio ofrece un visualizador de datos geográficos integrado. Cuando los resultados de tu consulta contienen una o más columnas de tipo GEOGRAPHY, puedes ver los resultados en un mapa interactivo.
Para ver el mapa, en el panel Resultados de la consulta, haz clic en la pestaña Visualización.
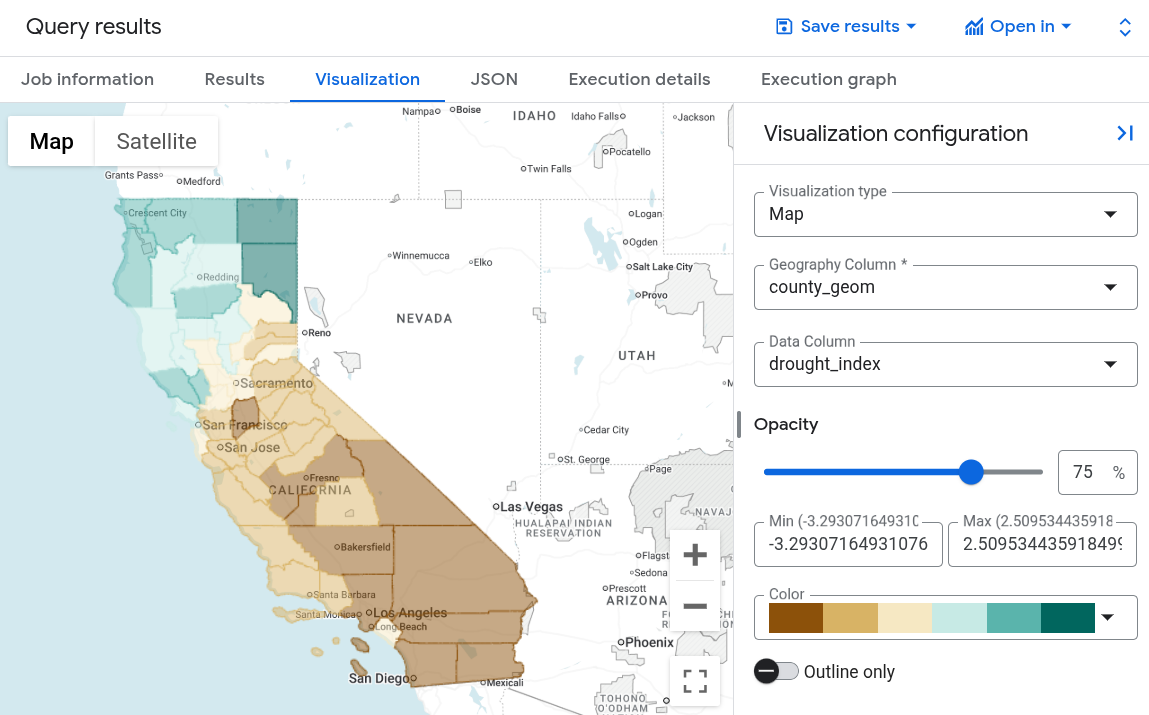
La visualización en BigQuery es ideal para inspecciones rápidas y el desarrollo iterativo de consultas. Puedes confirmar visualmente la alineación de los datos con las expectativas, identificar valores atípicos y evaluar la exactitud de tus datos espaciales. También es útil para el análisis ad hoc, ya que permite explorar los resultados y extraer conclusiones inmediatas de las consultas geoespaciales.
Si deseas ver un ejemplo de cómo usar el visualizador de geografía integrado, consulta Comienza a usar las estadísticas geoespaciales.
Limitaciones de BigQuery Studio
- Solo puedes visualizar una columna de
GEOGRAPHYa la vez. - El rendimiento está sujeto a las capacidades del navegador y no está diseñado para renderizar conjuntos de datos extremadamente grandes o complejos. BigQuery renderiza hasta aproximadamente un millón de vértices, 20,000 filas o 128 MB de resultados.
Looker Studio
Looker Studio es un servicio automático de visualización de informes y datos sin costo de Google Marketing Platform que se conecta a BigQuery y cientos de otras fuentes de datos. El servicio admite una variedad de tipos de campos geográficos y mapas de coropletas de polígonos de GEOGRAPHY de BigQuery. Con la visualización basada en Google Maps, puedes visualizar tus datos geográficos y, además, interactuar con ellos como lo haces con Google Maps: desplazarte lateralmente, acercar la imagen y visitar un lugar con Street View.

Para obtener una explicación de las estadísticas geoespaciales en Looker Studio, consulta Visualiza polígonos de GEOGRAPHY de BigQuery con Looker Studio.
BigQuery Geo Viz
BigQuery Geo Viz es una herramienta web para la visualización de datos geoespaciales en BigQuery con las API de Google Maps. Puedes ejecutar una consulta en SQL y mostrar los resultados en un mapa interactivo. Las características de estilo flexible te permiten analizar y explorar tus datos.
BigQuery Geo Viz no es una herramienta de visualización de análisis de datos geoespaciales con todas las funciones. Geo Viz ofrece una forma rápida de visualizar los resultados de una consulta de análisis de datos geoespaciales en un mapa, una consulta a la vez.
Si deseas ver un ejemplo del uso de Geo Viz a fin de visualizar datos geoespaciales, consulta Comienza con el análisis de datos geoespaciales.
Para explorar Geo Viz, dirígete a la herramienta web de Geo Viz:
Limitaciones de Geo Viz
- Geo Viz es compatible con los datos de entrada geométricos (puntos, líneas y polígonos) que se recuperan como una columna
GEOGRAPHY. Puedes usar las funciones de geografía de BigQuery para convertir la latitud y la longitud enGEOGRAPHY. - La cantidad de resultados que Geo Viz puede mostrar en un mapa está limitada por la memoria del navegador. Puedes disminuir la resolución y reducir el tamaño de los datos geoespaciales que se muestran en la consulta mediante la función
ST_Simplify. - El navegador controla de forma local el análisis interactivo en tiempo real, que está sujeto a las capacidades del navegador.
- Geo Viz admite el uso compartido de visualizaciones solo con usuarios autorizados a ejecutar consultas en el mismo proyecto de BigQuery.
- Geo Viz no admite la descarga de una visualización para la edición sin conexión.
Notebooks de Colab
También puedes realizar visualizaciones geoespaciales en notebooks de Colab. Si deseas obtener un instructivo para compilar un notebook de Colab para visualizar datos, consulta Visualización geoespacial de BigQuery en Colab.
Para ver y ejecutar un notebook compilado previamente, consulta Visualización geoespacial de BigQuery en Colab en GitHub.
Google Earth Engine
También puedes visualizar los datos geoespaciales mediante Google Earth Engine. Para usar Google Earth Engine, exporta tus datos de BigQuery a Cloud Storage y, luego, impórtalos en Google Earth Engine. Puedes usar las herramientas de Google Earth Engine para visualizar tus datos.
Si deseas obtener más información sobre cómo usar Google Earth Engine, consulta los siguientes instructivos: