Forecast hierarchical time series with an ARIMA_PLUS univariate model
This tutorial teaches you how to use an
ARIMA_PLUS univariate time series model
to forecast hierarchical time series. It forecasts the future value
for a given column, based on the historical values for that column,
and also calculates roll-up values for that column for one or more dimensions of
interest.
Forecasted values are calculated for each time point, for each value in one or more columns that specify the dimensions of interest. For example, if you wanted to forecast daily traffic incidents and specified a dimension column containing state data, the forecasted data would contain values for each day for State A, then values for each day for State B, and so forth. If you wanted to forecast daily traffic incidents and specified dimension columns containing state and city data, the forecasted data would contain values for each day for State A and City A, then values for each day for State A and City B, and so forth. In hierarchical time series models, hierarchical reconciliation is used to roll up and reconcile each child time series with its parent. For example, the sum of the forecasted values for all of the cities in State A must be equal to the forecasted value for State A.
In this tutorial, you create two time series models over the same data, one that uses hierarchical forecasting and one that doesn't. This lets you compare the results returned by the models.
This tutorial uses data from the public
bigquery-public-data.iowa_liquor.sales.sales
table. This table contains information for over 1 million liquor products in
different stores using public Iowa liquor sales data.
Before reading this tutorial, we highly recommend that you read Forecast multiple time series with a univariate model.
Required Permissions
To create the dataset, you need the
bigquery.datasets.createIAM permission.To create the model, you need the following permissions:
bigquery.jobs.createbigquery.models.createbigquery.models.getDatabigquery.models.updateData
To run inference, you need the following permissions:
bigquery.models.getDatabigquery.jobs.create
For more information about IAM roles and permissions in BigQuery, see Introduction to IAM.
Objectives
In this tutorial, you use the following:
- Creating a multiple time series model and a multiple hierarchical time
series model to forecast bottle sales values by using the
CREATE MODELstatement. - Retrieving the forecasted bottle sales values from the models by using the
ML.FORECASTfunction.
Costs
This tutorial uses billable components of Google Cloud, including the following:
- BigQuery
- BigQuery ML
For more information about BigQuery costs, see the BigQuery pricing page.
For more information about BigQuery ML costs, see BigQuery ML pricing.
- Sign in to your Google Cloud account. If you're new to Google Cloud, create an account to evaluate how our products perform in real-world scenarios. New customers also get $300 in free credits to run, test, and deploy workloads.
-
In the Google Cloud console, on the project selector page, select or create a Google Cloud project.
Roles required to select or create a project
- Select a project: Selecting a project doesn't require a specific IAM role—you can select any project that you've been granted a role on.
-
Create a project: To create a project, you need the Project Creator
(
roles/resourcemanager.projectCreator), which contains theresourcemanager.projects.createpermission. Learn how to grant roles.
-
Verify that billing is enabled for your Google Cloud project.
-
In the Google Cloud console, on the project selector page, select or create a Google Cloud project.
Roles required to select or create a project
- Select a project: Selecting a project doesn't require a specific IAM role—you can select any project that you've been granted a role on.
-
Create a project: To create a project, you need the Project Creator
(
roles/resourcemanager.projectCreator), which contains theresourcemanager.projects.createpermission. Learn how to grant roles.
-
Verify that billing is enabled for your Google Cloud project.
- BigQuery is automatically enabled in new projects.
To activate BigQuery in a pre-existing project, go to
Enable the BigQuery API.
Roles required to enable APIs
To enable APIs, you need the Service Usage Admin IAM role (
roles/serviceusage.serviceUsageAdmin), which contains theserviceusage.services.enablepermission. Learn how to grant roles.
Create a dataset
Create a BigQuery dataset to store your ML model.
Console
In the Google Cloud console, go to the BigQuery page.
In the Explorer pane, click your project name.
Click View actions > Create dataset
On the Create dataset page, do the following:
For Dataset ID, enter
bqml_tutorial.For Location type, select Multi-region, and then select US (multiple regions in United States).
Leave the remaining default settings as they are, and click Create dataset.
bq
To create a new dataset, use the
bq mk command
with the --location flag. For a full list of possible parameters, see the
bq mk --dataset command
reference.
Create a dataset named
bqml_tutorialwith the data location set toUSand a description ofBigQuery ML tutorial dataset:bq --location=US mk -d \ --description "BigQuery ML tutorial dataset." \ bqml_tutorial
Instead of using the
--datasetflag, the command uses the-dshortcut. If you omit-dand--dataset, the command defaults to creating a dataset.Confirm that the dataset was created:
bq ls
API
Call the datasets.insert
method with a defined dataset resource.
{
  "datasetReference": {
     "datasetId": "bqml_tutorial"
  }
}
BigQuery DataFrames
Before trying this sample, follow the BigQuery DataFrames setup instructions in the BigQuery quickstart using BigQuery DataFrames. For more information, see the BigQuery DataFrames reference documentation.
To authenticate to BigQuery, set up Application Default Credentials. For more information, see Set up ADC for a local development environment.
Create a time series model
Create a time series model, using the Iowa liquor sales data.
The following GoogleSQL query creates a model that forecasts the daily total number of bottles sold in 2015 in Polk, Linn and Scott counties.
In the following query, the
OPTIONS(model_type='ARIMA_PLUS', time_series_timestamp_col='date', ...)
clause indicates that you are creating an
ARIMA-based
time series model. You use the
TIME_SERIES_ID option
of the CREATE MODEL statement to specify one or more columns in the input data
for which you want to get forecasts. The
auto_arima_max_order option
of the CREATE MODEL statement controls the
search space for hyperparameter tuning in the auto.ARIMA algorithm. The
decompose_time_series option
of the CREATE MODEL statement defaults to TRUE, so that information about
the time series data is returned when you evaluate the model in the next step.
The OPTIONS(model_type='ARIMA_PLUS', time_series_timestamp_col='date', ...)
clause indicates that you are creating an
ARIMA-based
time series model. By default,
auto_arima=TRUE,
so the auto.ARIMA algorithm automatically tunes the hyperparameters in
ARIMA_PLUS models. The algorithm fits dozens of candidate models and chooses
the best model, which is the model with the lowest
Akaike information criterion (AIC).
Setting the
holiday_region option
to US allows a more accurate modeling on those United States holidays time
points if there are United States holiday patterns in the time series.
Follow these steps to create the model:
In the Google Cloud console, go to the BigQuery page.
In the query editor, paste in the following query and click Run:
CREATE OR REPLACE MODEL `bqml_tutorial.liquor_forecast`
  OPTIONS (
    MODEL_TYPE = 'ARIMA_PLUS',
    TIME_SERIES_TIMESTAMP_COL = 'date',
    TIME_SERIES_DATA_COL = 'total_bottles_sold',
    TIME_SERIES_ID_COL = ['store_number', 'zip_code', 'city', 'county'],
    HOLIDAY_REGION = 'US')
AS
SELECT
  store_number,
  zip_code,
  city,
  county,
  date,
  SUM(bottles_sold) AS total_bottles_sold
FROM
  `bigquery-public-data.iowa_liquor_sales.sales`
WHERE
  date BETWEEN DATE('2015-01-01') AND DATE('2015-12-31')
  AND county IN ('POLK', 'LINN', 'SCOTT')
GROUP BY store_number, date, city, zip_code, county;
The query takes approximately 37 seconds to complete, after which the
liquor_forecastmodel appears in the Explorer pane. Because the query uses aCREATE MODELstatement to create a model, there are no query results.
Use the model to forecast data
Forecast future time series values by using the ML.FORECAST
function.
In the following query, the
STRUCT(20 AS horizon, 0.8 AS confidence_level) clause indicates that the
query forecasts 20 future time points, and generates a prediction interval
with a 80% confidence level.
Follow these steps to forecast data with the model:
In the Google Cloud console, go to the BigQuery page.
In the query editor, paste in the following query and click Run:
SELECT *
FROM
  ML.FORECAST(
    MODEL `bqml_tutorial.liquor_forecast`,
    STRUCT(20 AS horizon, 0.8 AS confidence_level))
ORDER BY store_number, county, city, zip_code, forecast_timestamp;
The results should look similar to the following:
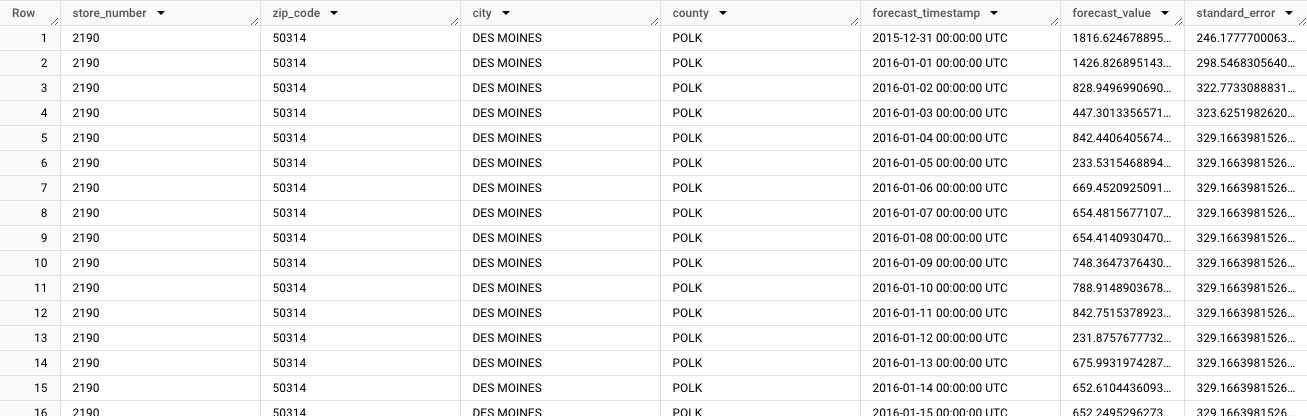
The output starts with the forecasted data for the first time series;
store_number=2190,zip_code=50314,city=DES MOINES,county=POLK. As you scroll through the data, you see the forecasts for each subsequent unique time series. In order to generate forecasts that aggregate totals for different dimensions, such as forecasts for a specific county, you must generate a hierarchical forecast.
Create a hierarchical time series model
Create a hierarchical time series forecast, using the Iowa liquor sales data.
The following GoogleSQL query creates a model that generates hierarchical forecasts for the daily total number of bottles sold in 2015 in Polk, Linn and Scott counties.
In the following query, the HIERARCHICAL_TIME_SERIES_COLS option in the
CREATE MODEL statement indicates that you are creating a hierarchical forecast
based on a set of columns that you specify. Each of these columns is rolled up
and aggregated. For example, from the earlier query, this means that the
store_number column value is rolled up to show forecasts for each county,
city and zip_code value. Separately, both zip_code and store_number
values are also rolled up to show forecasts for each county and city value.
The column order is important because it defines the structure of the hierarchy.
Follow these steps to create the model:
In the Google Cloud console, go to the BigQuery page.
In the query editor, paste in the following query and click Run:
CREATE OR REPLACE MODEL `bqml_tutorial.liquor_forecast_hierarchical`
  OPTIONS (
    MODEL_TYPE = 'ARIMA_PLUS',
    TIME_SERIES_TIMESTAMP_COL = 'date',
    TIME_SERIES_DATA_COL = 'total_bottles_sold',
    TIME_SERIES_ID_COL = ['store_number', 'zip_code', 'city', 'county'],
    HIERARCHICAL_TIME_SERIES_COLS = ['zip_code', 'store_number'],
    HOLIDAY_REGION = 'US')
AS
SELECT
  store_number,
  zip_code,
  city,
  county,
  date,
  SUM(bottles_sold) AS total_bottles_sold
FROM
  `bigquery-public-data.iowa_liquor_sales.sales`
WHERE
  date BETWEEN DATE('2015-01-01') AND DATE('2015-12-31')
  AND county IN ('POLK', 'LINN', 'SCOTT')
GROUP BY store_number, date, city, zip_code, county;
The query takes approximately 45 seconds to complete, after which the
bqml_tutorial.liquor_forecast_hierarchicalmodel appears in the Explorer pane. Because the query uses aCREATE MODELstatement to create a model, there are no query results.
Use the hierarchical model to forecast data
Retrieve hierarchical forecast data from the model by using the ML.FORECAST
function.
Follow these steps to forecast data with the model:
In the Google Cloud console, go to the BigQuery page.
In the query editor, paste in the following query and click Run:
SELECT
  *
FROM
  ML.FORECAST(
    MODEL `bqml_tutorial.liquor_forecast_hierarchical`,
    STRUCT(30 AS horizon, 0.8 AS confidence_level))
WHERE city = 'LECLAIRE'
ORDER BY county, city, zip_code, store_number, forecast_timestamp;
The results should look similar to the following:
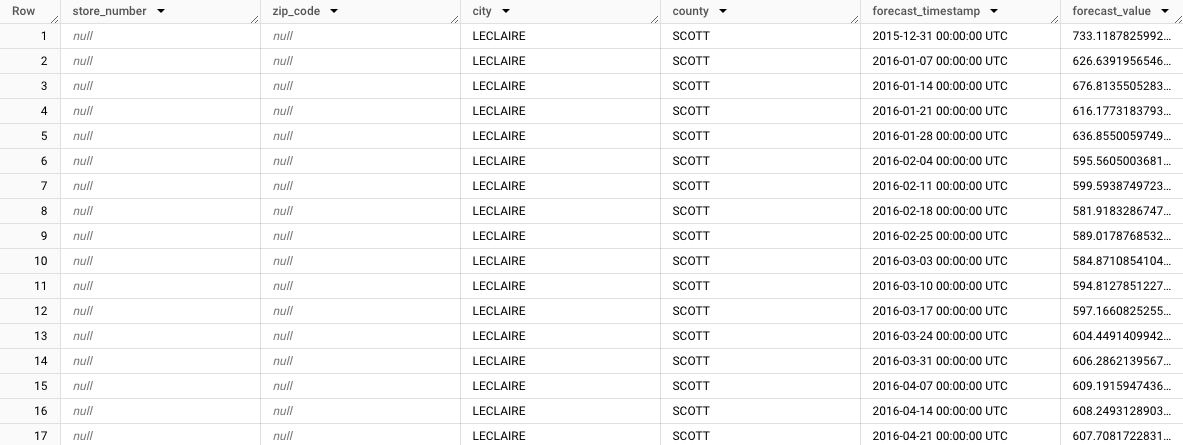
Notice how the aggregated forecast is displayed for the city of LeClaire,
store_number=NULL,zip_code=NULL,city=LECLAIRE,county=SCOTT. As you look at the rest of the rows, notice the forecasts for the other subgroups. For example, the following image shows the forecasts aggregated for the zip code52753,store_number=NULL,zip_code=52753,city=LECLAIRE,county=SCOTT: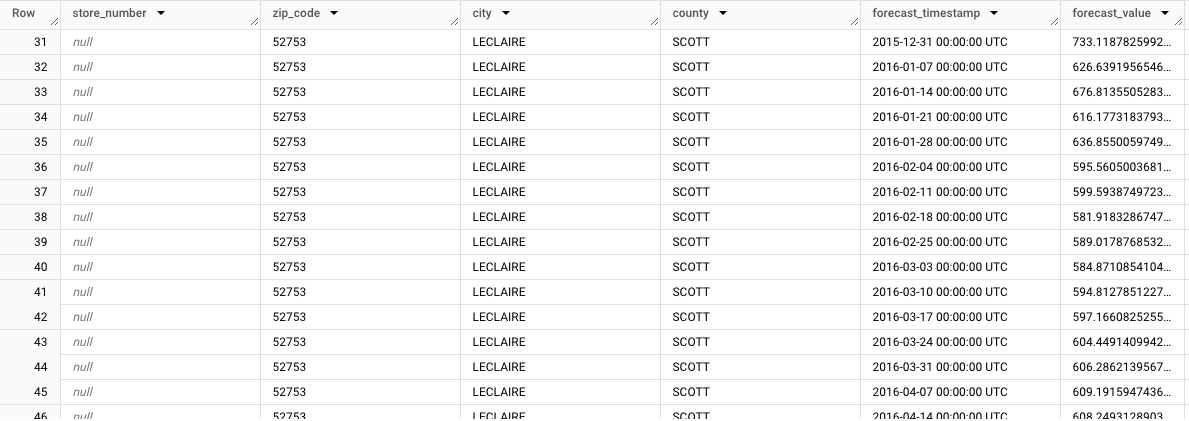
Clean up
To avoid incurring charges to your Google Cloud account for the resources used in this tutorial, either delete the project that contains the resources, or keep the project and delete the individual resources.
- You can delete the project you created.
- Or you can keep the project and delete the dataset.
Delete your dataset
Deleting your project removes all datasets and all tables in the project. If you prefer to reuse the project, you can delete the dataset you created in this tutorial:
If necessary, open the BigQuery page in the Google Cloud console.
In the navigation, click the bqml_tutorial dataset you created.
Click Delete dataset on the right side of the window. This action deletes the dataset, the table, and all the data.
In the Delete dataset dialog, confirm the delete command by typing the name of your dataset (
bqml_tutorial) and then click Delete.
Delete your project
To delete the project:
- In the Google Cloud console, go to the Manage resources page.
- In the project list, select the project that you want to delete, and then click Delete.
- In the dialog, type the project ID, and then click Shut down to delete the project.
What's next
- Learn how to forecast a single time series with a univariate model
- Learn how to forecast multiple time series with a univariate model
- Learn how to scale a univariate model when forecasting multiple time series over many rows.
- Learn how to forecast a single time series with a multivariate model
- For an overview of BigQuery ML, see Introduction to AI and ML in BigQuery.