Vertex Explainable AI には、画像データ用の可視化機能が組み込まれています。カスタム トレーニング済みの画像モデルの可視化を構成できます。
画像分類モデルの説明をリクエストすると、予測クラスと、予測に貢献したピクセルまたは領域を示すイメージ オーバーレイが表示されます。
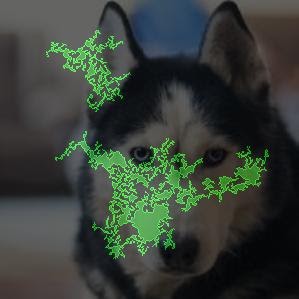
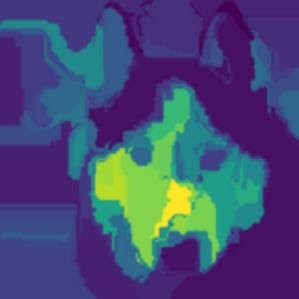
次の画像はハスキー犬の画像の可視化です。左側の可視化では統合勾配方式を使用し、正のアトリビューション領域がハイライト表示されています。右側の可視化では XRAI 方式を使用し、正の予測に影響力が小さい領域(青色)と大きい領域(黄色)がカラー グラデーションで表示されています。
扱うデータの種類によって、説明の可視化に統合勾配方式を使用するか、XRAI 方式を使用するかが変ります。
- XRAI は自然な画像の処理を得意とする傾向があり、正のアトリビューションは犬の顔の形に関連するなど、優れた上位レベルの分析情報の概要を提示します。
- 統合勾配(IG)は、ピクセルレベルの詳細を提供する傾向があるので、より粒度が細かいアトリビューションの検出に効果を発揮します。
Vertex Explainable AI のアトリビューション方式の詳細については、概要ページをご覧ください。
始める
可視化は、Vertex Explainable AI をサポートする Model リソースを作成するとき、または Model の ExplanationSpec をオーバーライドするときに構成します。
モデルの可視化を構成するには、可視化する特徴に対応する InputMetadata メッセージの visualization フィールドを入力します。この構成メッセージには、使用するオーバーレイのタイプ、ハイライト表示する属性、色などのオプションを含めることができます。どの設定も省略可能です。
可視化オプション
デフォルト設定と推奨設定は、アトリビューション方式(統合勾配または XRAI)によって異なります。以下のリストに、構成オプションとその使用方法を示します。オプションの一覧については、Visualization メッセージの API リファレンスをご覧ください。
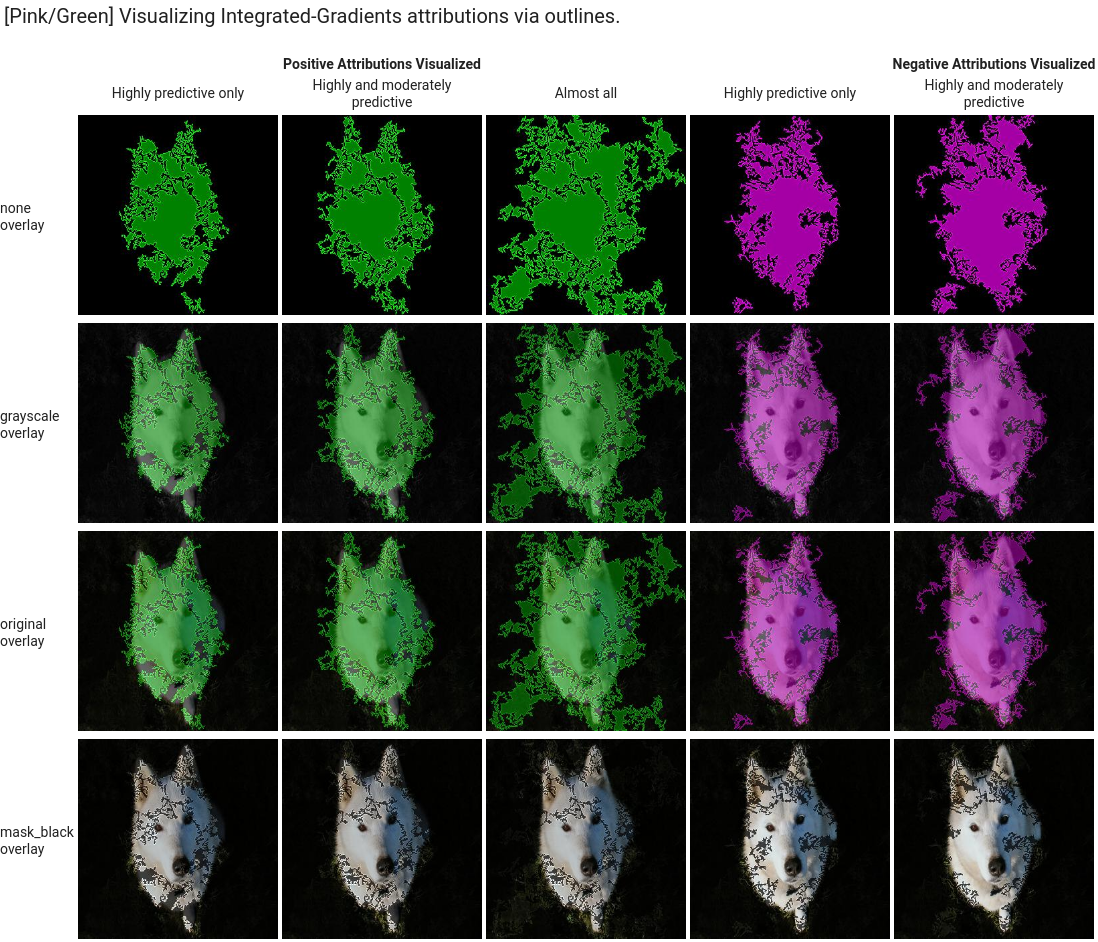
type: 使用された可視化のタイプ(OUTLINESまたはPIXELS)。typeフィールドはデフォルトでOUTLINESになり、アトリビューションの領域が表示されます。ピクセル単位のアトリビューションを表示するには、このフィールドをPIXELSに設定します。polarity: ハイライト表示されるアトリビューションの方向性。デフォルトでpositiveが設定されており、最も高い正のアトリビューションの領域がハイライト表示されます。これは、モデルの正の予測に最も影響を与えたピクセルをハイライト表示することを意味します。polarity をnegativeに設定すると、モデルに陽性クラスの予測を行わせなかった領域がハイライト表示されます。負の polarity を使用すると、偽陰性領域を特定してモデルをデバッグできます。また、正と負のアトリビューションを表示するbothに設定することもできます。clip_percent_upperbound: 指定したパーセンタイルを上回るアトリビューションをハイライト表示の領域から除外します。クリップ パラメータを一緒に使用することで、不要な情報を取り除き、アトリビューションの強い領域が見やすくなります。clip_percent_lowerbound: 指定したパーセンタイルを下回るアトリビューションをハイライト表示の領域から除外します。color_map: ハイライト表示される領域の配色。統合勾配では、pink_greenがデフォルト値です。正のアトリビューションが緑、負のアトリビューションがピンクで表示されます。XRAI の可視化の場合、カラーマップはグラデーションです。XRAI のデフォルトはviridisで、最も影響力の大きい部分が黄色、最も影響力の小さい部分が青でハイライト表示されます。使用可能な値の一覧については、
Visualizationメッセージの API リファレンスをご覧ください。overlay_type: 可視化で元の画像がどのように表示されるか。元の画像によって可視化が見づらくなった場合、オーバーレイを調整すると、明瞭さが向上します。使用可能な値の一覧については、
Visualizationメッセージの API リファレンスをご覧ください。
構成例
以下に、出発点として使用できるサンプル Visualization 構成と、適用される設定の範囲を表す画像を示します。
統合勾配
統合勾配では、アトリビューション エリアに不要な情報が多い場合に、クリップ値を調整する必要が生じることがあります。
visualization: {
  "type": "OUTLINES",
  "polarity": "positive",
  "clip_percent_lowerbound": 70,
  "clip_percent_upperbound": 99.9,
  "color_map": "pink_green",
  "overlay_type": "grayscale"
}
次の可視化では、outlines と pixels の両方のタイプを使用します。「高予測のみ」、「概ねの予測」、「ほぼすべて」とラベル付けされた列は、可視化をフォーカスするための異なるレベルのクリッピングの例です。
![]()
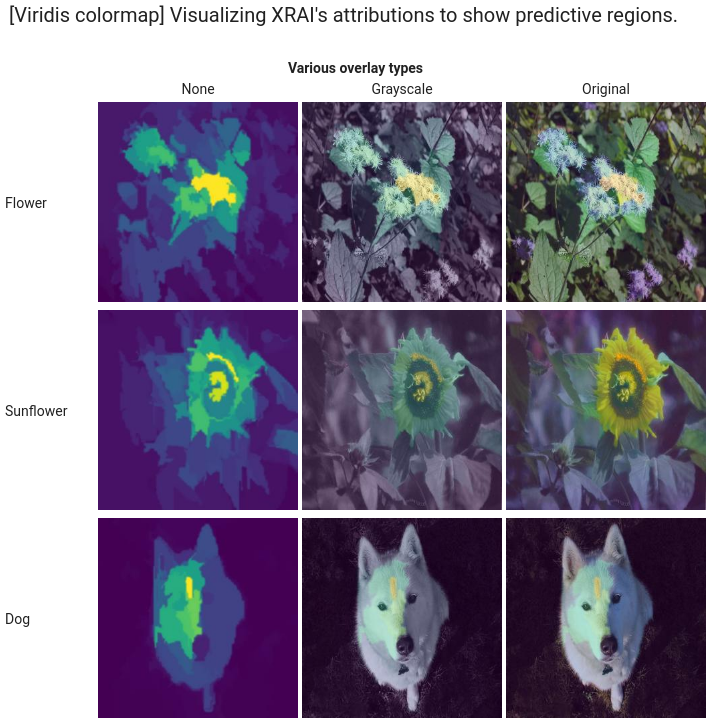
XRAI
XRAI の可視化の場合、最初は XRAI のクリップ値を使用しないことをおすすめします。オーバーレイはグラデーションを使用してアトリビューションの高い部分と低い部分を表示するからです。
visualization: {
  "type": "PIXELS",
  "polarity": "positive",
  "clip_percent_lowerbound": 0,
  "clip_percent_upperbound": 100,
  "color_map": "viridis",
  "overlay_type": "grayscale"
}
次の画像は、デフォルトの viridis カラーマップとさまざまなオーバーレイ タイプの範囲を使用する XRAI の可視化です。黄色の領域は、正の予測に最も影響力のある部分を示しています。
次のステップ
- Vertex Explainable AI の構成オプションの詳細については、カスタム トレーニング モデルの説明の構成をご覧ください。