This tutorial shows how to use HammerDB to perform load testing on a Compute Engine SQL Server instance. You can learn how to install a SQL Server instance by using the following tutorials:
There are a number of load-testing tools available. Some are free and open source, while others require licenses. HammerDB is an open source tool that generally works well to demonstrate the performance of your SQL Server database. This tutorial covers the basic steps to use HammerDB, but there are other tools available, and you should select the tools that align best to your specific workloads.
Objectives
This tutorial covers the following objectives:- Configuring SQL Server for load testing
- Installing and running HammerDB
- Collecting runtime statistics
- Running the Transaction Processing Benchmark derived from the TPC "C" specification (TPROC-C) load test
Costs
In addition to any existing SQL Server instances running on Compute Engine, this tutorial uses billable components of Google Cloud, including:
- Compute Engine
- Windows Server
The Pricing Calculator can generate a cost estimate based on your projected usage. The provided link shows the cost estimate for the products used in this tutorial, which can average 16 dollars (US) per day.
Before you begin
- Sign in to your Google Cloud account. If you're new to Google Cloud, create an account to evaluate how our products perform in real-world scenarios. New customers also get $300 in free credits to run, test, and deploy workloads.
-
In the Google Cloud console, on the project selector page, select or create a Google Cloud project.
Roles required to select or create a project
- Select a project: Selecting a project doesn't require a specific IAM role—you can select any project that you've been granted a role on.
-
Create a project: To create a project, you need the Project Creator
(
roles/resourcemanager.projectCreator), which contains theresourcemanager.projects.createpermission. Learn how to grant roles.
-
Verify that billing is enabled for your Google Cloud project.
-
In the Google Cloud console, on the project selector page, select or create a Google Cloud project.
Roles required to select or create a project
- Select a project: Selecting a project doesn't require a specific IAM role—you can select any project that you've been granted a role on.
-
Create a project: To create a project, you need the Project Creator
(
roles/resourcemanager.projectCreator), which contains theresourcemanager.projects.createpermission. Learn how to grant roles.
-
Verify that billing is enabled for your Google Cloud project.
- If you aren't using Windows on your local machine, install a third-party Remote Desktop Protocol (RDP) client. For more information, see Microsoft Remote Desktop clients.
Configuring the SQL Server instance for load testing
Before you start, you should double check that your Windows firewall rules are set up to allow traffic from the IP address of the new Windows instance you created. Then, create a new database for TPCC load testing and configure a user account using the following steps:
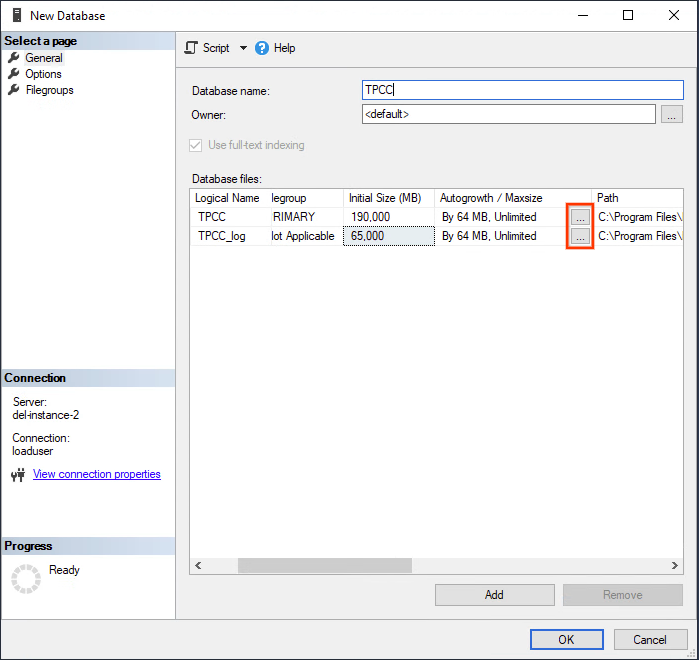
- Right-click the Databases folder in SQL Server Management Studio, and then choose New Database.
- Name the new database "TPCC".
- Set the initial size of the data file to 190,000 MB and the log file to 65,000 MB.
Set the Autogrowth limits to higher values by clicking the ellipsis buttons, as shown in the following screenshot:

Set the data file to grow by 64 MB to unlimited size.
Set the log file to disable auto-growth.
Click OK.
In the New Database dialog, in the left pane, choose the Options page.
Set Compatibility level to SQL Server 2022 (160).
Set the Recovery model to Simple, so that the loading doesn't fill up the transaction logs.

Click OK to create the TPCC database, which can take a few minutes to complete.
The preconfigured SQL Server image comes with only Windows Authentication enabled, so you will need to enable mixed mode authentication within SSMS, by following this guide.
Follow these steps to create a new SQL Server user account on your database server that has the DBOwner permission. Name the account "loaduser" and give it a secure password.
Take note of your SQL Server internal IP address by using the
Get-NetIPAddresscommandlet, because it's important for performance and security to use the internal IP.
Installing HammerDB
You can run HammerDB directly on your SQL Server instance. However, for a more accurate test, create a new Windows instance and test the SQL Server instance remotely.
Creating an instance
Follow these steps to create a new Compute Engine instance:
In the Google Cloud console, go to the Create an instance page.
For Name, enter
hammerdb-instance.In the Machine configuration section, select the machine type with at least half the number of CPUs as your database instance.
In the Boot disk section, click Change, and then do the following:
- On the Public images tab, choose a Windows Server operating system.
- In the Version list, click Windows Server 2022 Datacenter.
- In the Boot disk type list, select Standard persistent disk.
- To confirm your boot disk options, click Select.
To create and start the VM, click Create.
Installing the software
When it's ready, use an RDP client to connect to your new Windows Server instance and install the following software:
Running HammerDB
After you install HammerDB, run the hammerdb.bat file. HammberDB does
not show up in the Start menu's applications list. Use the following command
to run HammerDB:
C:\Program Files\HammerDB-VERSION\hammerdb.batReplace VERSION with the version of the installed
HammerDB.
Creating the connection and schema
When the application is running, the first step is to configure the connection to build the schema.
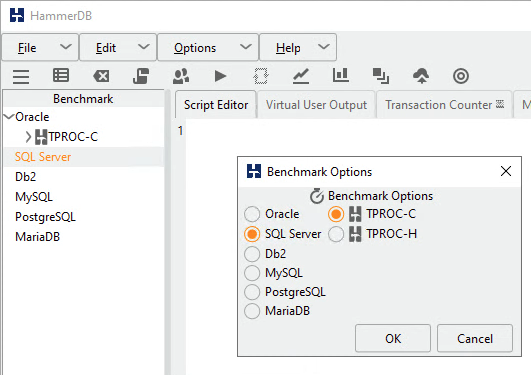
- Double-click SQL Server in the Benchmark panel.
- Select TPROC-C.
From the HammerDB site:
TPROC-C is the OLTP workload implemented in HammerDB derived from the TPROC-C specification with modification to make running HammerDB straightforward and cost-effective on any of the supported database environments. The HammerDB TPROC-C workload is an open source workload derived from the TPROC-C Benchmark Standard and as such is not comparable to published TPROC-C results, as the results comply with a subset rather than the full TPROC-C Benchmark Standard. The name for the HammerDB workload TPROC-C means "Transaction Processing Benchmark derived from the TPC "C" specification".
Click OK

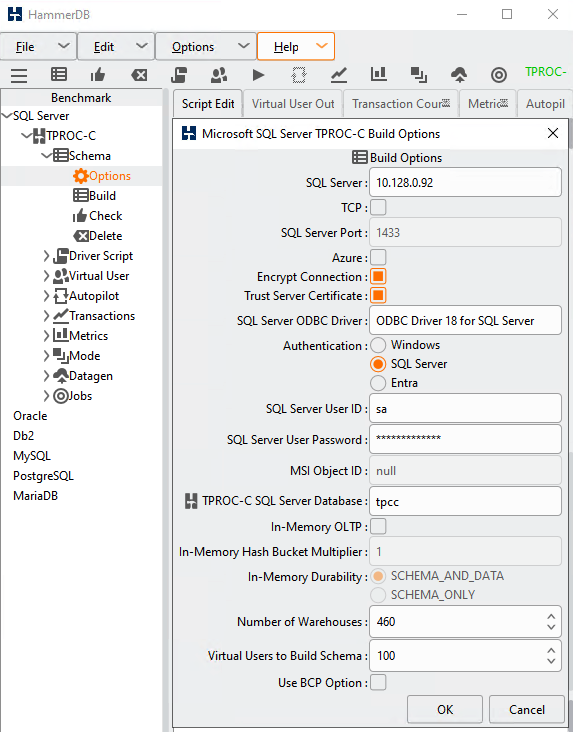
Click Schema and then double-click Options.
Fill out the form using your IP address, username, and password as shown in the following image:

Set the SQL Server ODBC Driver to OBDC Driver 18 for SQL Server
In this case, the Number of Warehouses (the scale) is set to 460, but you can choose a different value. Some guidelines suggest 10 to 100 warehouses per CPU. For this tutorial, set this value to 10 times the number of cores: 160 for a 16-core instance.
For Virtual Users to Build Schema, choose a number that is between 1- and 2-times the number of client vCPUs. You can click the grey bar next to the slider to increment the number.
Clear the Use BPC Option
Click OK
Double-click the Build option below the Schema Build section to create the schema and load the tables. When that completes, click the red flash light icon in the top center of the screen to destroy the virtual user and move to the next step.
If you created your database with the Simple recovery model, you might
want to change it back to Full at this point to get a more accurate test of a
production scenario. This change doesn't take effect until after you take a
full or differential backup to trigger the start of the new log chain.
Creating the driver script
HammerDB uses the driver script to orchestrate the flow of SQL statements to the database to generate the required load.
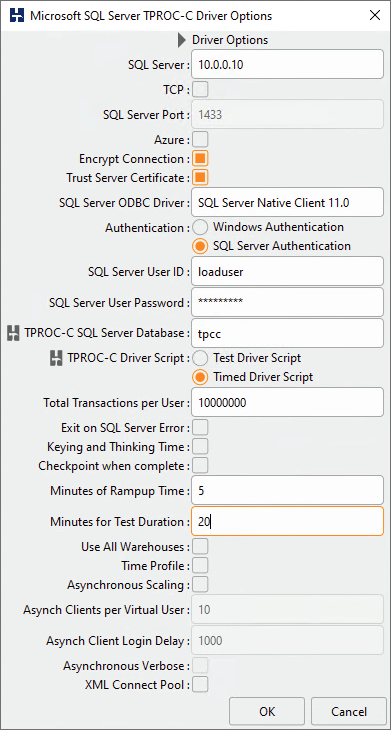
- In the Benchmark panel, expand the Driver Script section and double-click Options.
- Verify the settings match what you used in the Schema Build dialog.
- Choose Timed Driver Script.
- The Checkpoint when complete option forces the database to write everything to disk at the end of the test, so check this only if you plan on running multiple tests in a row.
- To ensure a thorough test, set Minutes of Rampup Time to 5 and Minutes for Test Duration to 20.
- Click OK to exit the dialog.
- Double-click Load in the Driver Script section of the Benchmark panel to activate the driver script.

Creating virtual users
Creating a realistic load typically requires running scripts as multiple different users. Create some virtual users for the test.
- Expand the Virtual Users section and double-click Options.
- If you set your warehouse count (scale) to 160, then set the Virtual Users to 16, because the TPROC-C guidelines recommend a 10x ratio to prevent row locking. Select the Show Output checkbox to enable error messages in the console.
- Click OK
Collecting runtime statistics
HammerDB and SQL Server don't easily collect detailed runtime statistics for
you. Although the statistics are available deep within SQL Server, they need to
be captured and calculated on a regular basis. If you do not already have a
procedure or tool to help capture this data, you can use the procedure in this
section to capture some useful metrics during your testing. The results will be
written to a CSV file in the Windows temp directory. You can copy the data to
a Google Sheet using the Paste Special > Paste CSV option.
To use this procedure, you first must temporarily enable OLE Automation Procedures to write the file to disk. Remember to disable it after testing:
sp_configure 'show advanced options', 1;
GO
RECONFIGURE;
GO
sp_configure 'Ole Automation Procedures', 1;
GO
RECONFIGURE;
GO
Here's the code to create the sp_write_performance_counters procedure in SQL
Server Management Studio. Before starting the load test, you will execute this
procedure in Management Studio.:
USE [master]
GO

SET ANSI_NULLS ON
GO

SET QUOTED_IDENTIFIER ON
GO

/***
LogFile path has to be in a directory that SQL Server can Write To.
*/
CREATE PROCEDURE [dbo].[sp_write_performance_counters] @LogFile varchar (2000) = 'C:\\WINDOWS\\TEMP\\sqlPerf.log', @SecondsToRun int =1600, @RunIntervalSeconds int = 2

AS

BEGIN
--File writing variables
DECLARE @OACreate INT, @OAFile INT, @FileName VARCHAR(2000), @RowText VARCHAR(500), @Loops int, @LoopCounter int, @WaitForSeconds varchar (10)
--Variables to save last counter values
DECLARE @LastTPS BIGINT, @LastLRS BIGINT, @LastLTS BIGINT, @LastLWS BIGINT, @LastNDS BIGINT, @LastAWT BIGINT, @LastAWT_Base BIGINT, @LastALWT BIGINT, @LastALWT_Base BIGINT
--Variables to save current counter values
DECLARE @TPS BIGINT, @Active BIGINT, @SCM BIGINT, @LRS BIGINT, @LTS BIGINT, @LWS BIGINT, @NDS BIGINT, @AWT BIGINT, @AWT_Base BIGINT, @ALWT BIGINT, @ALWT_Base BIGINT, @ALWT_DIV BIGINT, @AWT_DIV BIGINT

SELECT @Loops = case when (@SecondsToRun % @RunIntervalSeconds) > 5 then @SecondsToRun / @RunIntervalSeconds + 1 else @SecondsToRun / @RunIntervalSeconds end
SET @LoopCounter = 0
SELECT @WaitForSeconds = CONVERT(varchar, DATEADD(s, @RunIntervalSeconds , 0), 114)
SELECT @FileName = @LogFile + FORMAT ( GETDATE(), '-MM-dd-yyyy_m', 'en-US' ) + '.txt'

--Create the File Handler and Open the File
EXECUTE sp_OACreate 'Scripting.FileSystemObject', @OACreate OUT
EXECUTE sp_OAMethod @OACreate, 'OpenTextFile', @OAFile OUT, @FileName, 2, True, -2

--Write the Header
EXECUTE sp_OAMethod @OAFile, 'WriteLine', NULL,'Transactions/sec, Active Transactions, SQL Cache Memory (KB), Lock Requests/sec, Lock Timeouts/sec, Lock Waits/sec, Number of Deadlocks/sec, Average Wait Time (ms), Average Latch Wait Time (ms)'
--Collect Initial Sample Values
SET ANSI_WARNINGS OFF
SELECT
  @LastTPS= max(case when counter_name = 'Transactions/sec' then cntr_value end),
  @LastLRS = max(case when counter_name = 'Lock Requests/sec' then cntr_value end),
  @LastLTS = max(case when counter_name = 'Lock Timeouts/sec' then cntr_value end),
  @LastLWS = max(case when counter_name = 'Lock Waits/sec' then cntr_value end),
  @LastNDS = max(case when counter_name = 'Number of Deadlocks/sec' then cntr_value end),
  @LastAWT = max(case when counter_name = 'Average Wait Time (ms)' then cntr_value end),
  @LastAWT_Base = max(case when counter_name = 'Average Wait Time base' then cntr_value end),
  @LastALWT = max(case when counter_name = 'Average Latch Wait Time (ms)' then cntr_value end),
  @LastALWT_Base = max(case when counter_name = 'Average Latch Wait Time base' then cntr_value end)
FROM sys.dm_os_performance_counters
WHERE counter_name IN (
'Transactions/sec',
'Lock Requests/sec',
'Lock Timeouts/sec',
'Lock Waits/sec',
'Number of Deadlocks/sec',
'Average Wait Time (ms)',
'Average Wait Time base',
'Average Latch Wait Time (ms)',
'Average Latch Wait Time base') AND instance_name IN( '_Total' ,'')
SET ANSI_WARNINGS ON
WHILE @LoopCounter <= @Loops
BEGIN
WAITFOR DELAY @WaitForSeconds
SET ANSI_WARNINGS OFF
SELECT
  @TPS= max(case when counter_name = 'Transactions/sec' then cntr_value end)   ,
  @Active = max(case when counter_name = 'Active Transactions' then cntr_value end)   ,
  @SCM = max(case when counter_name = 'SQL Cache Memory (KB)' then cntr_value end)   ,
  @LRS = max(case when counter_name = 'Lock Requests/sec' then cntr_value end)   ,
  @LTS = max(case when counter_name = 'Lock Timeouts/sec' then cntr_value end)   ,
  @LWS = max(case when counter_name = 'Lock Waits/sec' then cntr_value end)   ,
  @NDS = max(case when counter_name = 'Number of Deadlocks/sec' then cntr_value end)   ,
  @AWT = max(case when counter_name = 'Average Wait Time (ms)' then cntr_value end)   ,
  @AWT_Base = max(case when counter_name = 'Average Wait Time base' then cntr_value end)   ,
  @ALWT = max(case when counter_name = 'Average Latch Wait Time (ms)' then cntr_value end)   ,
  @ALWT_Base = max(case when counter_name = 'Average Latch Wait Time base' then cntr_value end)
FROM sys.dm_os_performance_counters
WHERE counter_name IN (
'Transactions/sec',
'Active Transactions',
'SQL Cache Memory (KB)',
'Lock Requests/sec',
'Lock Timeouts/sec',
'Lock Waits/sec',
'Number of Deadlocks/sec',
'Average Wait Time (ms)',
'Average Wait Time base',
'Average Latch Wait Time (ms)',
'Average Latch Wait Time base') AND instance_name IN( '_Total' ,'')
SET ANSI_WARNINGS ON

SELECT  @AWT_DIV = case when (@AWT_Base - @LastAWT_Base) > 0 then (@AWT_Base - @LastAWT_Base) else 1 end ,
    @ALWT_DIV = case when (@ALWT_Base - @LastALWT_Base) > 0 then (@ALWT_Base - @LastALWT_Base) else 1 end

SELECT @RowText = '' + convert(varchar, (@TPS - @LastTPS)/@RunIntervalSeconds) + ', ' +
          convert(varchar, @Active) + ', ' +
          convert(varchar, @SCM) + ', ' +
          convert(varchar, (@LRS - @LastLRS)/@RunIntervalSeconds) + ', ' +
          convert(varchar, (@LTS - @LastLTS)/@RunIntervalSeconds) + ', ' +
          convert(varchar, (@LWS - @LastLWS)/@RunIntervalSeconds) + ', ' +
          convert(varchar, (@NDS - @LastNDS)/@RunIntervalSeconds) + ', ' +
          convert(varchar, (@AWT - @LastAWT)/@AWT_DIV) + ', ' +
          convert(varchar, (@ALWT - @LastALWT)/@ALWT_DIV)

SELECT  @LastTPS = @TPS,
    @LastLRS = @LRS,
    @LastLTS = @LTS,
    @LastLWS = @LWS,
    @LastNDS = @NDS,
    @LastAWT = @AWT,
    @LastAWT_Base = @AWT_Base,
    @LastALWT = @ALWT,
    @LastALWT_Base = @ALWT_Base

EXECUTE sp_OAMethod @OAFile, 'WriteLine', Null, @RowText

SET @LoopCounter = @LoopCounter + 1

END

--CLEAN UP
EXECUTE sp_OADestroy @OAFile
EXECUTE sp_OADestroy @OACreate
print 'Completed Logging Performance Metrics to file: ' + @FileName

END

GO
Running the TPROC-C load test
In SQL Server Management Studio, execute the collection procedure using the following script:
Use master
Go
exec dbo.sp_write_performance_counters
On the Compute Engine instance where you installed HammerDB, start the test in the HammerDB application:
- In the Benchmark panel, under Virtual Users double-click Create to create the virtual users, which will activate the Virtual User Output tab.
- Double-click Run just below the Create option to kick off the test.
- When the test completes you will see the Transactions Per Minute (TPM) calculation in the Virtual User Output tab.
- You can find the results from your collection procedure in the
c:\Windows\tempdirectory. - Save all of these values to a Google Sheet and use them to compare multiple test runs.
Clean up
After you finish the tutorial, you can clean up the resources that you created so that they stop using quota and incurring charges. The following sections describe how to delete or turn off these resources.
Deleting the project
The easiest way to eliminate billing is to delete the project that you created for the tutorial.
To delete the project:
- In the Google Cloud console, go to the Manage resources page.
- In the project list, select the project that you want to delete, and then click Delete.
- In the dialog, type the project ID, and then click Shut down to delete the project.
Deleting instances
To delete a Compute Engine instance:
- In the Google Cloud console, go to the VM instances page.
- Select the checkbox for the instance that you want to delete.
- To delete the instance, click More actions, click Delete, and then follow the instructions.
What's next
- Review the SQL Server best practices guide.
- Explore reference architectures, diagrams, and best practices about Google Cloud. Take a look at our Cloud Architecture Center.
