Google에서 권장하는 Compute Engine용 원격 분석 수집 솔루션인 운영 에이전트를 사용하여 가상 머신(VM) 인스턴스에서 GPU 사용률 및 GPU 메모리와 같은 측정항목을 추적할 수 있습니다. 운영 에이전트를 사용하면 다음과 같이 GPU VM을 관리할 수 있습니다.
- 사전 구성된 대시보드로 NVIDIA GPU Fleet 상태를 시각화합니다.
- 사용률이 낮은 GPU를 파악하고 워크로드를 통합하여 비용을 최적화합니다.
- GPU 용량을 확장하거나 기존 GPU를 업그레이드할 시기를 결정하기 위해 추세를 살펴보고 확장을 계획합니다.
- NVIDIA Data Center GPU Manager(DCGM) 프로파일링 측정항목을 사용하여 GPU 내의 병목 현상 및 성능 문제를 식별합니다.
- 리소스를 자동 확장하도록 관리형 인스턴스 그룹(MIG)을 설정합니다.
- NVIDIA GPU의 측정항목에 대한 알림을 받습니다.
이 문서에서는 운영 에이전트를 사용하여 Linux VM에서 GPU를 모니터링하는 절차를 설명합니다. 또는 GitHub에서 Linux VM에서 GPU 사용량을 모니터링하도록 설정할 수 있는 보고 스크립트를 사용할 수 있습니다(compute-gpu-monitoring 모니터링 스크립트 참조).
이 스크립트는 활발히 유지보수되고 있지 않습니다.
Windows VM에서 GPU를 모니터링하려는 경우 GPU 성능 모니터링 (Windows)을 참조하세요.
개요
운영 에이전트 버전 2.38.0 이상에서는 에이전트가 설치된 Linux VM의 GPU 사용률 및 GPU 메모리 사용률을 자동으로 추적할 수 있습니다. NVIDIA 관리 라이브러리(NVML)에서 가져온 이러한 측정항목은 GPU 및 GPU를 사용하는 모든 프로세스별로 추적됩니다. 운영 에이전트에서 모니터링하는 측정항목을 보려면 에이전트 측정항목: gpu를 참조하세요.
운영 에이전트와 NVIDIA 데이터 센터 GPU 관리자(DCGM)의 통합을 설정할 수도 있습니다. 이러한 통합을 통해 운영 에이전트가 GPU의 하드웨어 카운터를 사용하여 측정항목을 추적할 수 있습니다. DCGM은 GPU 기기 수준 측정항목에 대한 액세스를 제공합니다. 여기에는 스트리밍 멀티 프로세서(SM) 블록 사용률, SM 점유율, SM 파이프 사용률, PCIe 트래픽 속도, NVLink 트래픽 비율이 포함됩니다. 운영 에이전트에서 모니터링하는 측정항목을 보려면 타사 애플리케이션 측정항목: NVIDIA 데이터 센터 GPU 관리자(DCGM)를 참조하세요.
운영 에이전트를 사용하여 GPU 측정항목을 검토하려면 다음 단계를 완료하세요.
- 각 VM에서 요구사항을 충족했는지 확인합니다.
- 각 VM에 운영 에이전트를 설치합니다.
- 선택사항: 각 VM에서 NVIDIA Data Center GPU Manager(DCGM) 통합을 설정합니다.
- Cloud Monitoring에서 측정항목을 검토합니다.
제한사항
- 운영 에이전트는 Container-Optimized OS를 사용하는 VM의 GPU 사용률을 추적하지 않습니다.
요구사항
각 VM에서 다음 요구사항이 충족되는지 확인합니다.
- 각 VM에는 GPU 연결이 완료된 상태여야 합니다.
- 각 VM에는 GPU 드라이버 설치가 완료된 상태여야 합니다.
- 각 VM의 Linux 운영체제 및 버전은 운영 에이전트를 지원해야 합니다. 운영 에이전트를 지원하는 Linux 운영체제 목록을 참조하세요.
- 각 VM에 대한
sudo액세스 권한이 있는지 확인하세요.
운영 에이전트 설치
운영 에이전트를 설치하려면 다음 단계를 완료합니다.
이전에
compute-gpu-monitoring모니터링 스크립트를 사용하여 GPU 사용률을 추적했다면 운영 에이전트를 설치하기 전에 서비스를 사용 중지하세요. 모니터링 스크립트를 사용 중지하려면 다음 명령어를 실행합니다.sudo systemctl --no-reload --now disable google_gpu_monitoring_agent
최신 버전의 운영 에이전트를 설치합니다. 자세한 안내는 운영 에이전트 설치를 참조하세요.
운영 에이전트를 설치한 후 Compute Engine에서 제공하는 설치 스크립트를 사용하여 GPU 드라이버를 설치하거나 업그레이드해야 하는 경우 제한사항 섹션을 참조하세요.
Compute Engine에서 NVML 측정항목 검토
Compute Engine Linux VM 인스턴스의 관측 가능성 탭에서 운영 에이전트가 수집하는 NVML 측정항목을 검토할 수 있습니다.
단일 VM의 측정항목을 보려면 다음을 수행합니다.
Google Cloud 콘솔에서 VM 인스턴스 페이지로 이동합니다.
VM을 선택하여 세부정보 페이지를 엽니다.
관측 가능성 탭을 클릭하여 VM에 대한 정보를 표시합니다.
GPU 빠른 필터를 선택합니다.
여러 VM의 측정항목을 보려면 다음을 수행합니다.
Google Cloud 콘솔에서 VM 인스턴스 페이지로 이동합니다.
관측 가능성 탭을 클릭합니다.
GPU 빠른 필터를 선택합니다.
선택사항: NVIDIA Data Center GPU Manager(DCGM) 통합 설정
또한 운영 에이전트는 NVIDIA Data Center GPU Manager(DCGM)에 대한 통합을 제공하여 스트리밍 멀티 프로세서(SM) 블록 사용률, SM 점유율, SM 파이프 사용률, PCIe 트래픽 속도, NVLink 트래픽 속도 등의 주요 고급 GPU 측정항목을 수집합니다.
이러한 고급 GPU 측정항목은 NVIDIA P100, P4 모델에서는 수집되지 않습니다.
각 VM에서 이 통합을 설정하고 사용하는 방법에 대한 자세한 내용은 NVIDIA Data Center GPU Manager(DCGM)를 참조하세요.
Cloud Monitoring에서 DCGM 측정항목 검토
Google Cloud 콘솔에서 Monitoring > 대시보드 페이지로 이동합니다.
샘플 라이브러리 탭을 선택합니다.
필터 필드에 NVIDIA를 입력합니다. NVIDIA GPU 모니터링 개요(GCE 및 GKE) 대시보드가 표시됩니다.
NVIDIA Data Center GPU Manager(DCGM) 통합을 설정한 경우 NVIDIA GPU 모니터링 고급 DCGM 측정항목(GCE 전용) 대시보드도 표시됩니다.
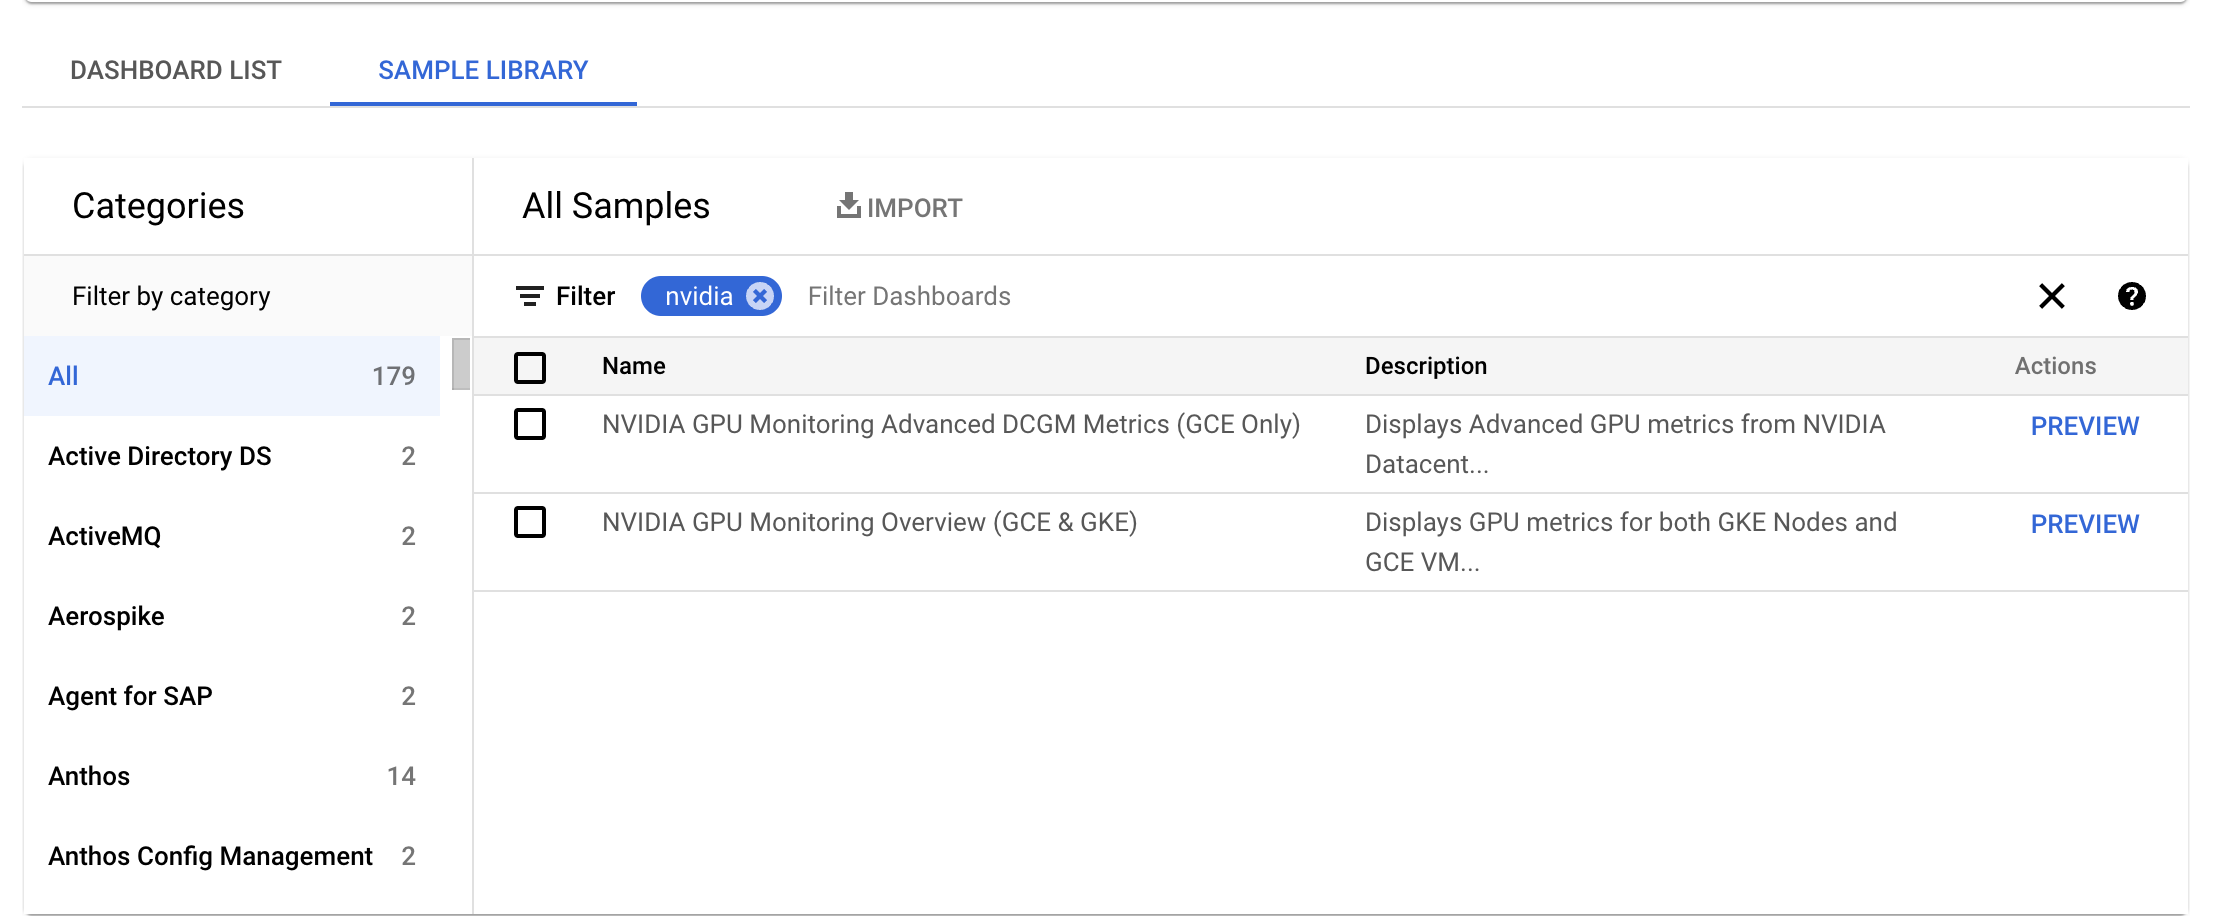
필수 대시보드의 경우 미리보기를 클릭합니다. 샘플 대시보드 미리보기 페이지가 표시됩니다.
샘플 대시보드 미리보기 페이지에서 샘플 대시보드 가져오기를 클릭합니다.
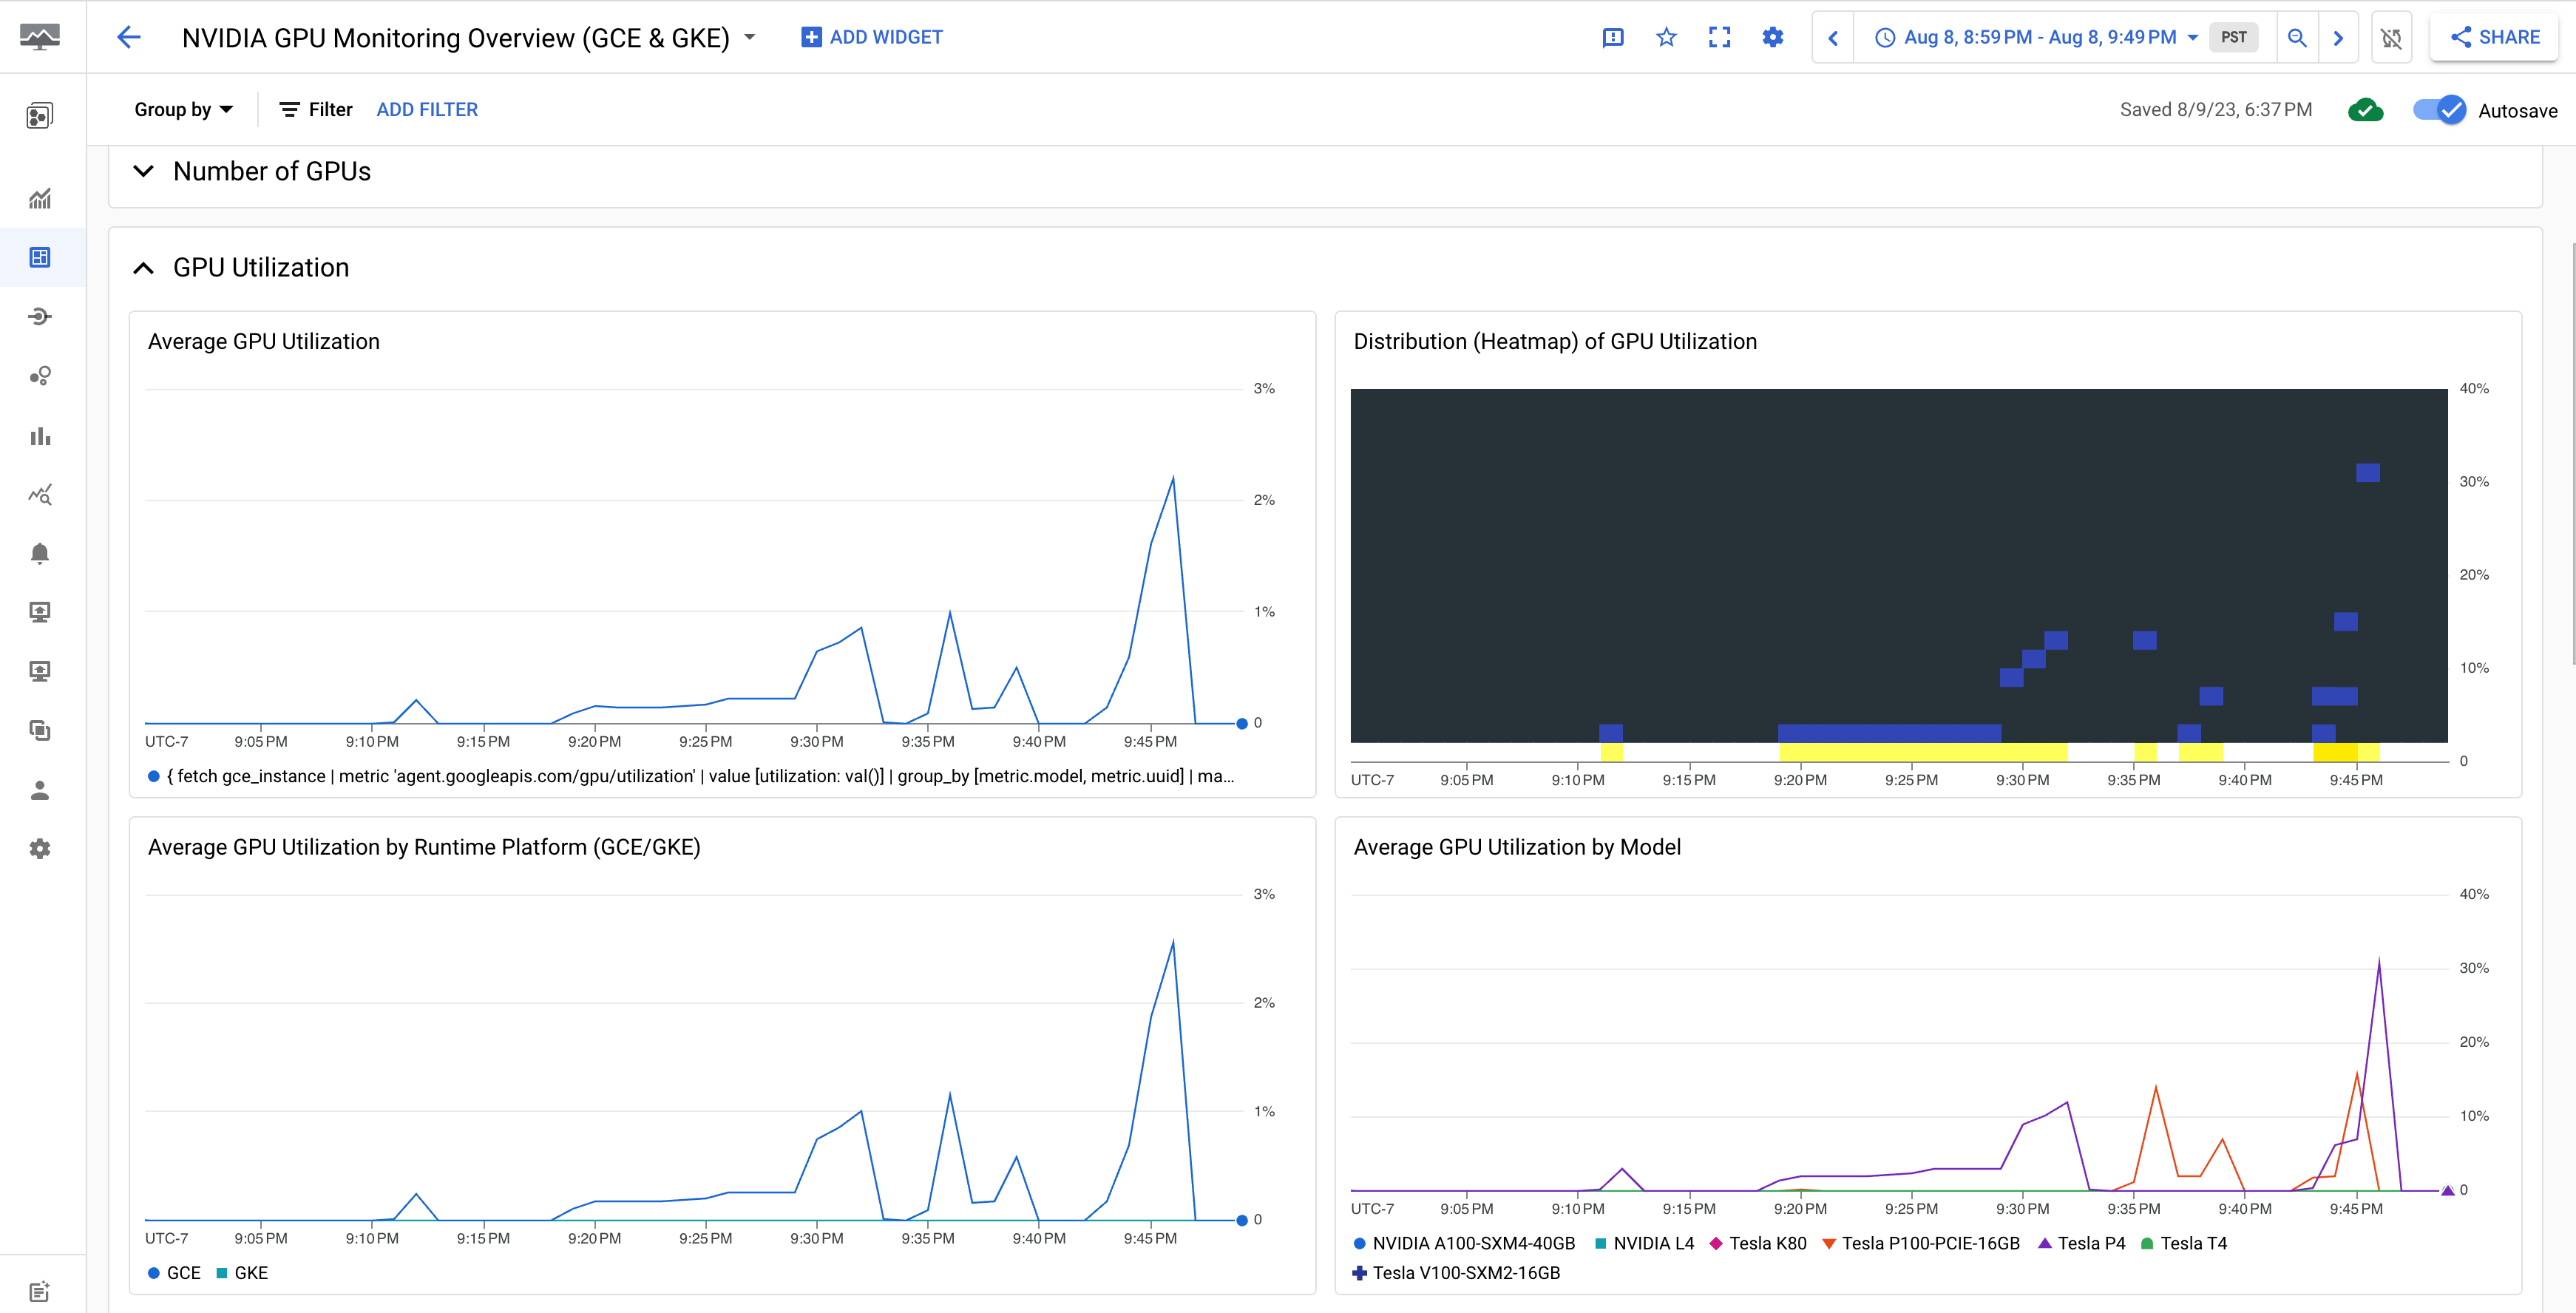
NVIDIA GPU 모니터링 개요(GCE 및 GKE) 대시보드에 GPU 사용률, NIC 트래픽 속도, GPU 메모리 사용량과 같은 GPU 측정항목이 표시됩니다.
GPU 사용률 화면은 다음 출력과 비슷합니다.
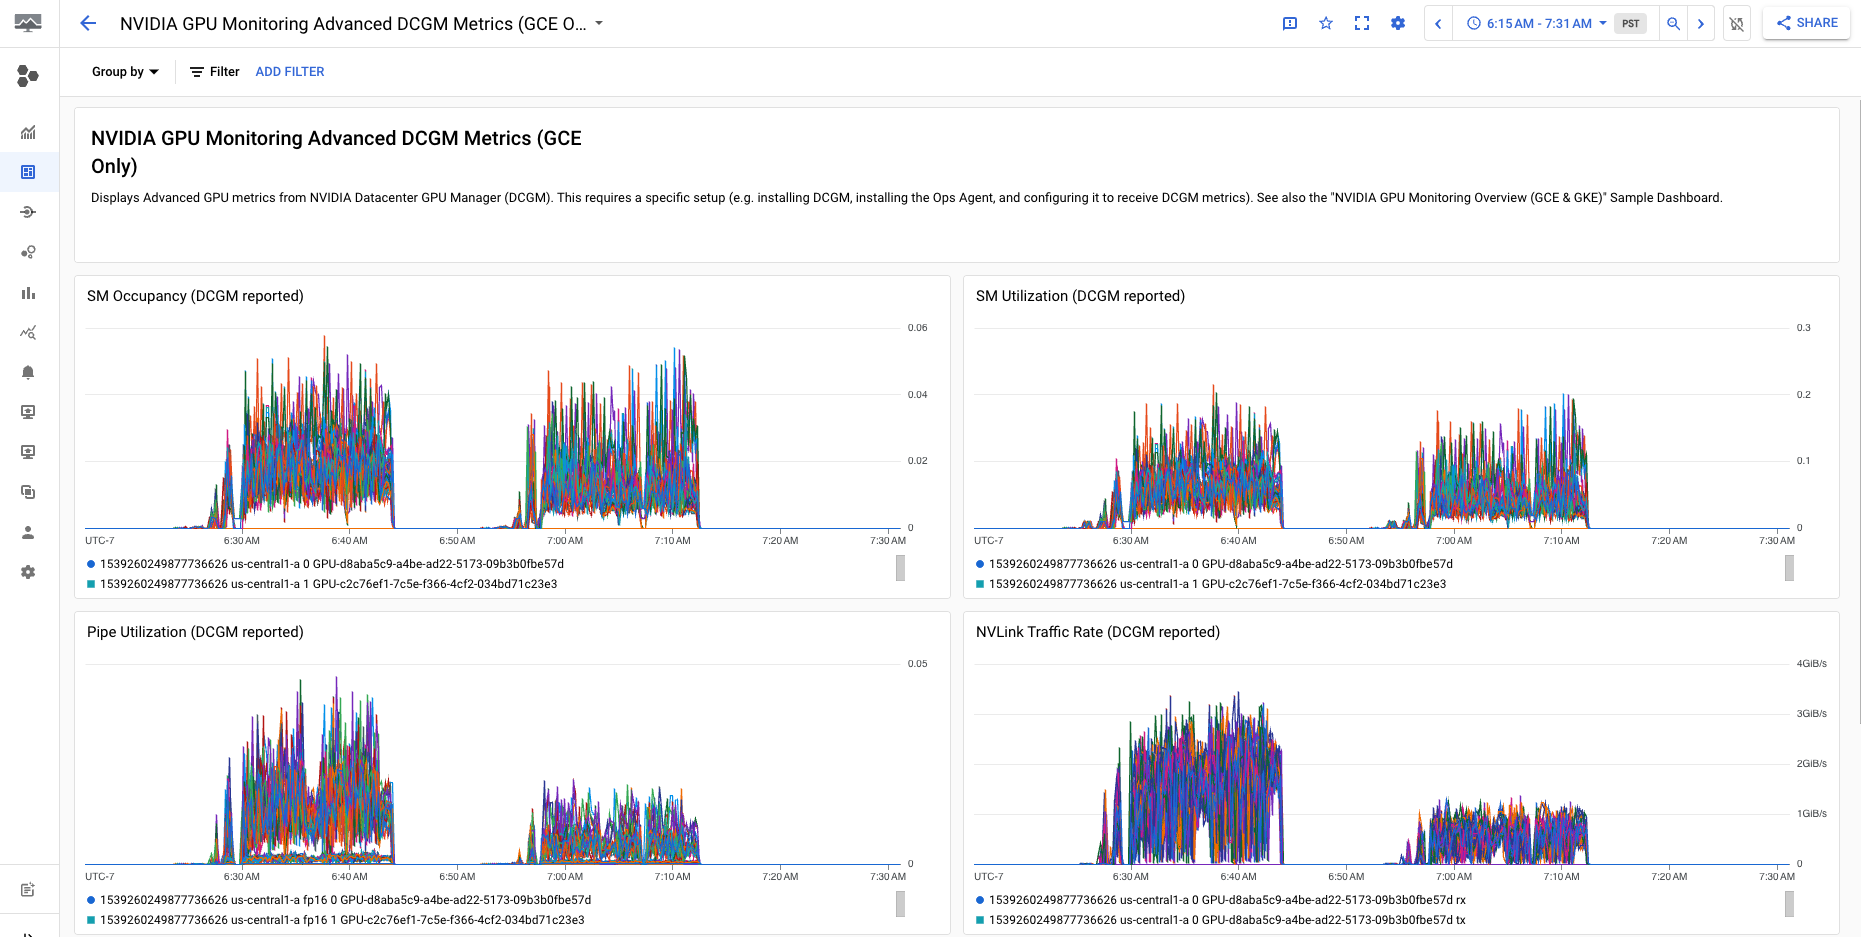
NVIDIA GPU 모니터링 고급 DCGM 측정항목(GCE 전용) 대시보드에는 SM 사용률, SM 점유율, SM 파이프 사용률, PCIe 트래픽 속도, NVLink 트랙픽 속도와 같은 주요 고급 측정항목이 표시됩니다.
고급 DCGM 측정항목 화면은 다음 출력과 비슷합니다.
다음 단계
- GPU 호스트 유지보수를 처리하려면 GPU 호스트 유지보수 이벤트 처리를 참조하세요.
- 네트워크 성능을 향상시키려면 더 높은 네트워크 대역폭 사용을 참조하세요.