Puedes monitorizar métricas como el uso de la GPU y la memoria de la GPU de tus instancias de máquina virtual (VM) mediante el agente de Ops, que es la solución de recogida de telemetría recomendada por Google para Compute Engine. Con el agente de operaciones, puedes gestionar tus VMs con GPU de las siguientes formas:
- Visualiza el estado de tu flota de GPUs NVIDIA con nuestros paneles preconfigurados.
- Optimiza los costes identificando las GPUs infrautilizadas y consolidando las cargas de trabajo.
- Planifica el escalado analizando las tendencias para decidir cuándo ampliar la capacidad de la GPU o actualizar las GPUs que ya tienes.
- Usa las métricas de creación de perfiles de NVIDIA Data Center GPU Manager (DCGM) para identificar cuellos de botella y problemas de rendimiento en tus GPUs.
- Configura grupos de instancias gestionados (MIGs) para autoescalar los recursos.
- Recibe alertas sobre las métricas de tus GPUs NVIDIA.
En este documento se describen los procedimientos para monitorizar las GPUs en máquinas virtuales Linux mediante el agente de operaciones. También puede usar una secuencia de comandos de informes disponible en GitHub para monitorizar el uso de la GPU en máquinas virtuales Linux. Consulte la compute-gpu-monitoringsecuencia de comandos de monitorización.
Este script no se mantiene de forma activa.
Para monitorizar las GPUs en máquinas virtuales Windows, consulta Monitorizar el rendimiento de la GPU (Windows).
Información general
El agente de operaciones, versión 2.38.0 o posterior, puede monitorizar automáticamente las tasas de uso de la GPU y de la memoria de la GPU en tus máquinas virtuales Linux que tengan instalado el agente. Estas métricas, obtenidas de la biblioteca de gestión de NVIDIA (NVML), se monitorizan por GPU y por proceso para cualquier proceso que utilice GPUs. Para ver las métricas que monitoriza el agente de Ops, consulta Métricas del agente: gpu.
También puede configurar la integración de NVIDIA Data Center GPU Manager (DCGM) con el agente de operaciones. Esta integración permite que el agente de operaciones monitorice las métricas mediante los contadores de hardware de la GPU. DCGM proporciona acceso a las métricas a nivel de dispositivo de la GPU. Entre ellas se incluyen la utilización del bloque de multiprocesador de streaming (SM), la ocupación del SM, la utilización de la canalización del SM, la tasa de tráfico de PCIe y la tasa de tráfico de NVLink. Para ver las métricas monitorizadas por el agente de Ops, consulta Métricas de aplicaciones de terceros: NVIDIA Data Center GPU Manager (DCGM).
Para revisar las métricas de la GPU con el agente de Ops, sigue estos pasos:
- En cada VM, comprueba que cumples los requisitos.
- En cada máquina virtual, instala el agente de operaciones.
- Opcional: En cada VM, configura la integración de NVIDIA Data Center GPU Manager (DCGM).
- Consulta las métricas en Cloud Monitoring.
Limitaciones
- El agente de operaciones no monitoriza la utilización de la GPU en las VMs que usan Container-Optimized OS.
Requisitos
En cada una de tus máquinas virtuales, comprueba que cumples los siguientes requisitos:
- Cada VM debe tener GPUs conectadas.
- Cada máquina virtual debe tener un controlador de GPU instalado.
- El sistema operativo Linux y la versión de cada una de tus VMs deben ser compatibles con el agente de operaciones. Consulta la lista de sistemas operativos Linux compatibles con el agente de Ops.
- Asegúrate de tener acceso
sudoa cada VM.
Instalar el Agente de operaciones
Para instalar el agente de Ops, sigue estos pasos:
Si antes usabas la
compute-gpu-monitoringsecuencia de comandos de monitorización para hacer un seguimiento del uso de la GPU, inhabilita el servicio antes de instalar el agente de Ops. Para inhabilitar la secuencia de comandos de monitorización, ejecuta el siguiente comando:sudo systemctl --no-reload --now disable google_gpu_monitoring_agent
Instala la versión más reciente del Agente de operaciones. Para obtener instrucciones detalladas, consulta Instalar el agente de Ops.
Una vez que hayas instalado el agente de Ops, si necesitas instalar o actualizar los controladores de GPU mediante las secuencias de comandos de instalación proporcionadas por Compute Engine, consulta la sección Limitaciones.
Consultar métricas de NVML en Compute Engine
Puede consultar las métricas de NVML que recoge el Agente de operaciones de las pestañas Observabilidad de las instancias de máquina virtual Linux de Compute Engine.
Para ver las métricas de una sola máquina virtual, haz lo siguiente:
En la consola de Google Cloud , ve a la página Instancias de VM.
Selecciona una VM para abrir la página Detalles.
Haga clic en la pestaña Observabilidad para ver información sobre la VM.
Selecciona el filtro rápido GPU.
Para ver las métricas de varias máquinas virtuales, haz lo siguiente:
En la consola de Google Cloud , ve a la página Instancias de VM.
Haz clic en la pestaña Observabilidad.
Selecciona el filtro rápido GPU.
Opcional: Configurar la integración de NVIDIA Data Center GPU Manager (DCGM)
El agente de operaciones también proporciona integración para NVIDIA Data Center GPU Manager (DCGM) con el fin de recoger métricas avanzadas clave de la GPU, como la utilización de bloques de multiprocesadores de streaming (SM), la ocupación de SM, la utilización de la canalización de SM, la tasa de tráfico de PCIe y la tasa de tráfico de NVLink.
Estas métricas avanzadas de GPU no se recogen de los modelos NVIDIA P100 y P4.
Para obtener instrucciones detalladas sobre cómo configurar y usar esta integración en cada máquina virtual, consulta NVIDIA Data Center GPU Manager (DCGM).
Consultar métricas de DCGM en Cloud Monitoring
En la Google Cloud consola, ve a la página Monitorización > Paneles de control.
Selecciona la pestaña Biblioteca de muestras.
En el campo Filtro, escribe NVIDIA. Se muestra el panel de control Resumen de la monitorización de GPUs de NVIDIA (GCE y GKE).
Si ha configurado la integración de NVIDIA Data Center GPU Manager (DCGM), también se mostrará el panel de control Métricas avanzadas de DCGM de monitorización de GPU NVIDIA (solo GCE).
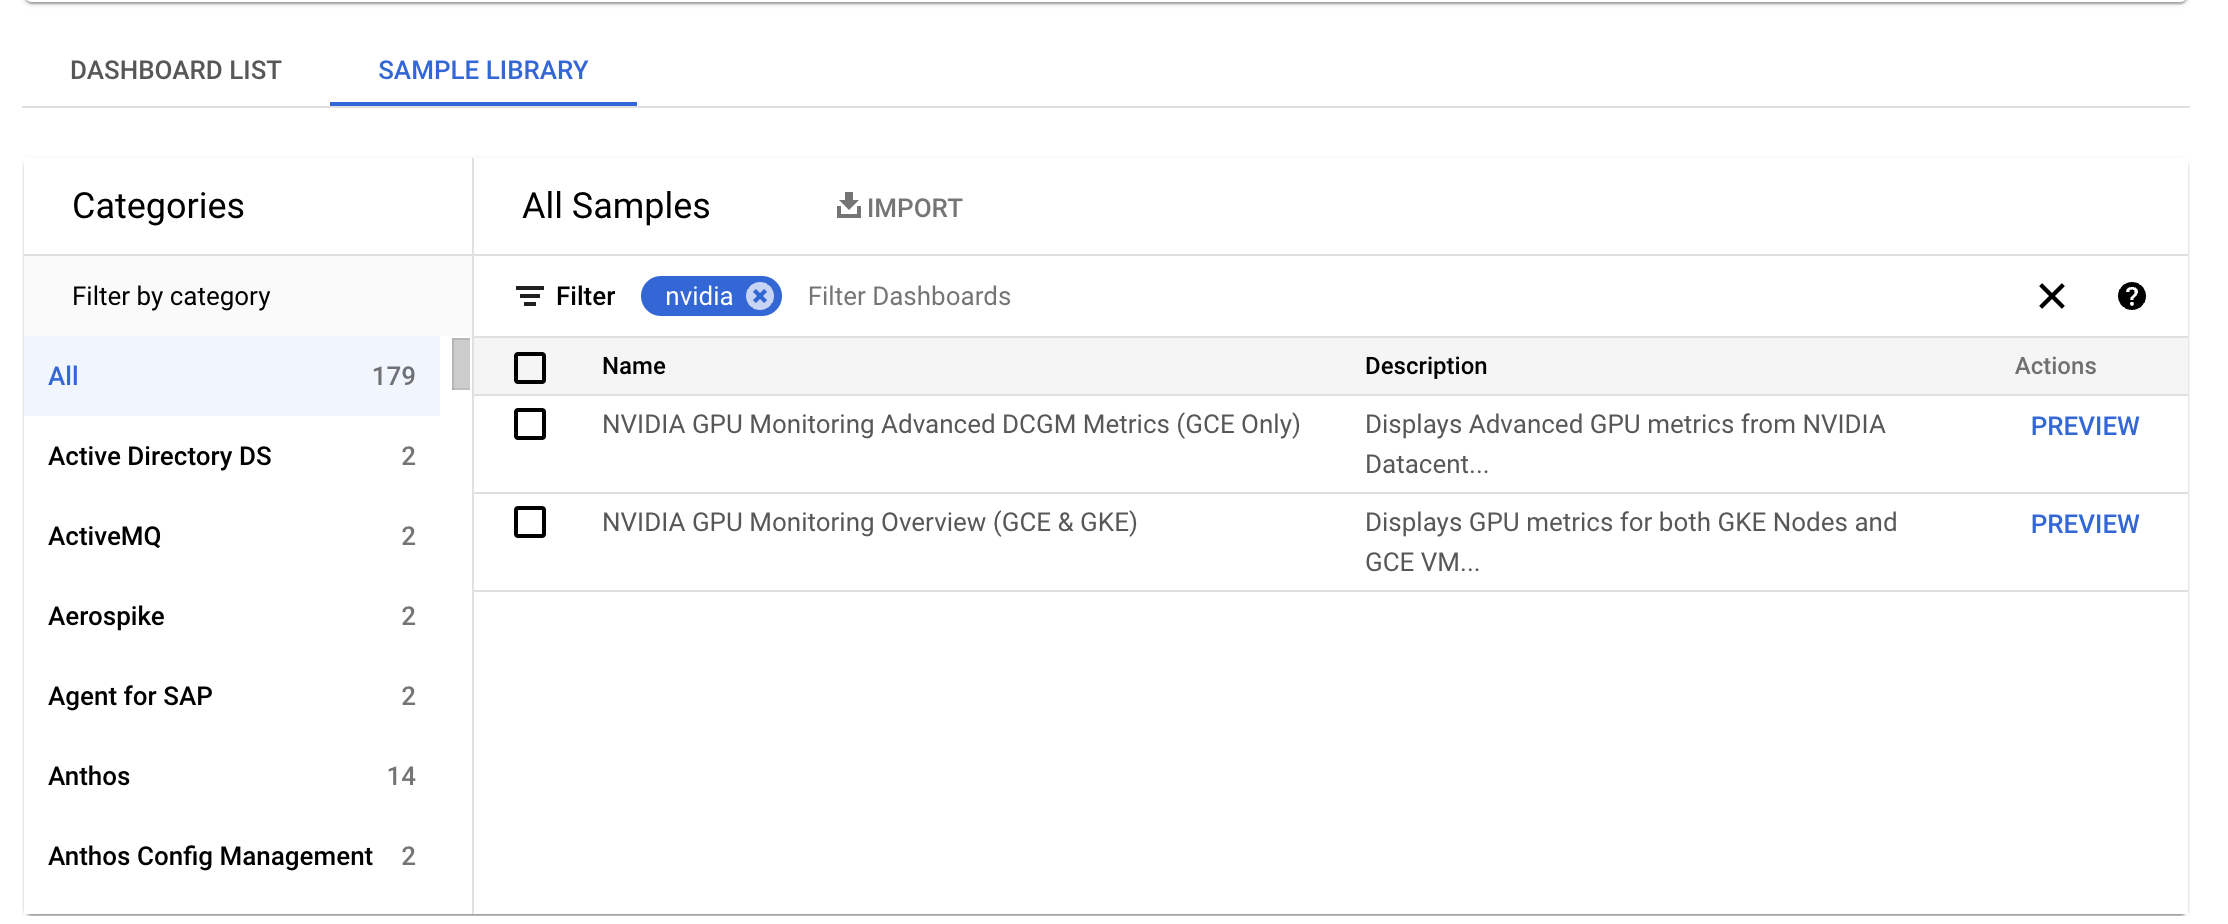
En el panel de control necesario, haga clic en Vista previa. Se muestra la página Vista previa del panel de control de muestra.
En la página Vista previa del panel de control de muestra, haga clic en Importar panel de control de muestra.
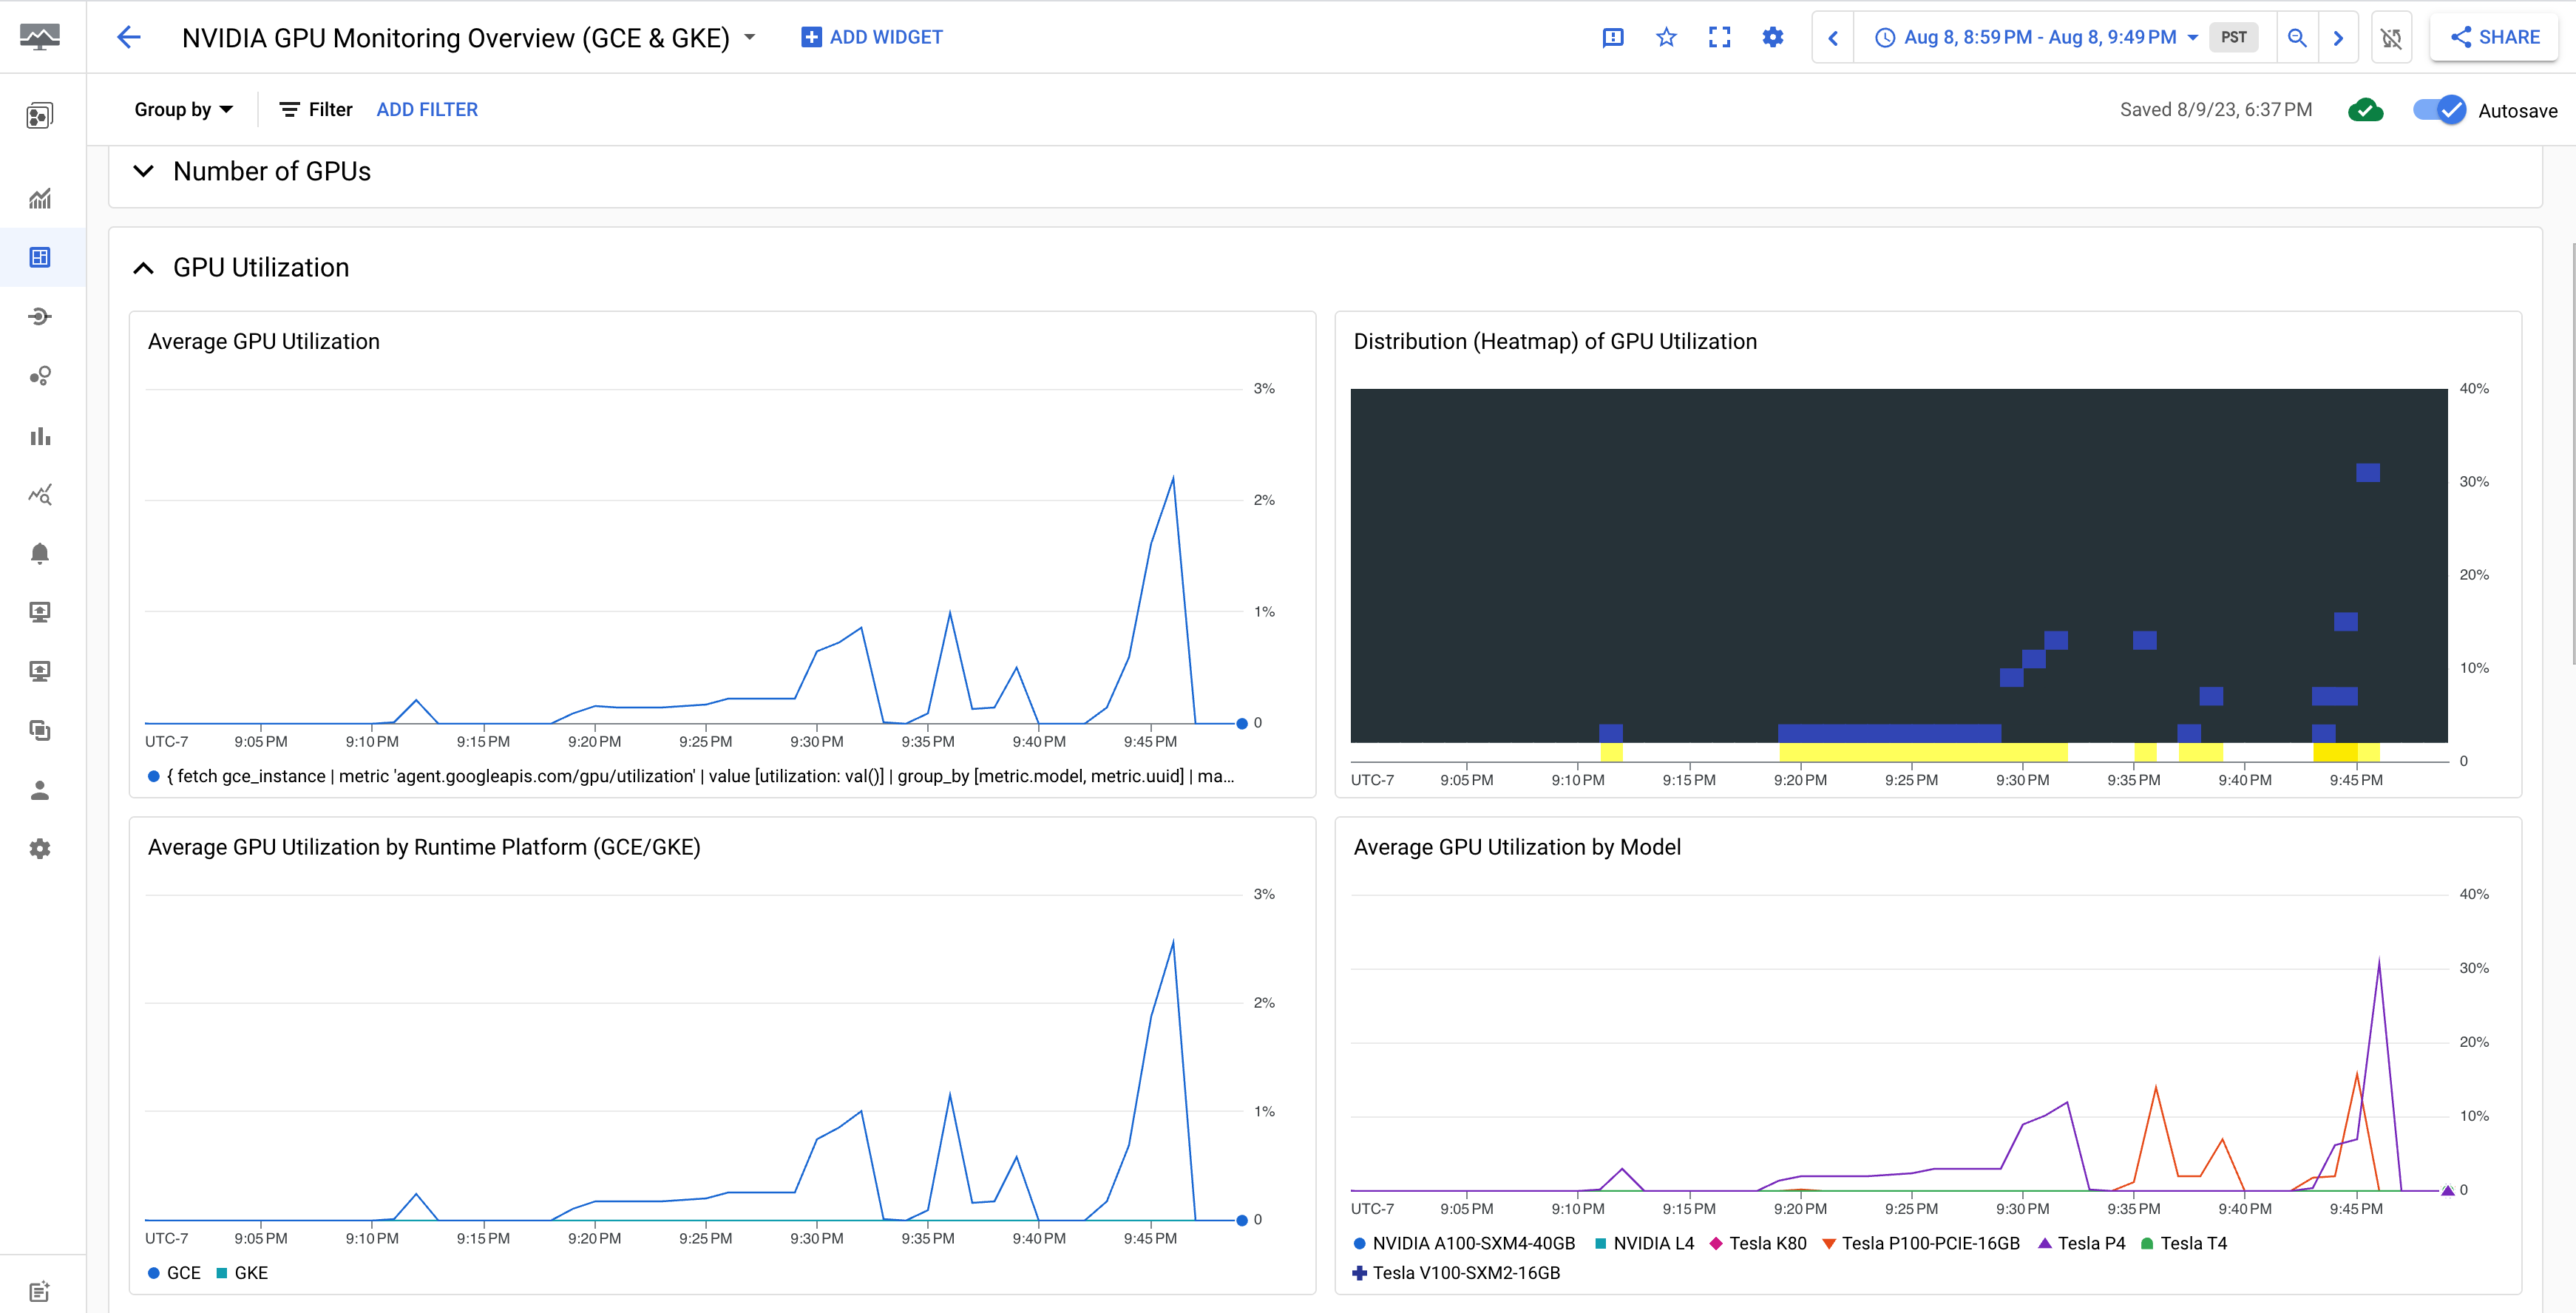
El panel de control Resumen de la monitorización de GPUs NVIDIA (GCE y GKE) muestra las métricas de las GPUs, como el uso de las GPUs, la tasa de tráfico de la NIC y el uso de la memoria de las GPUs.
La pantalla de uso de la GPU es similar a la siguiente:
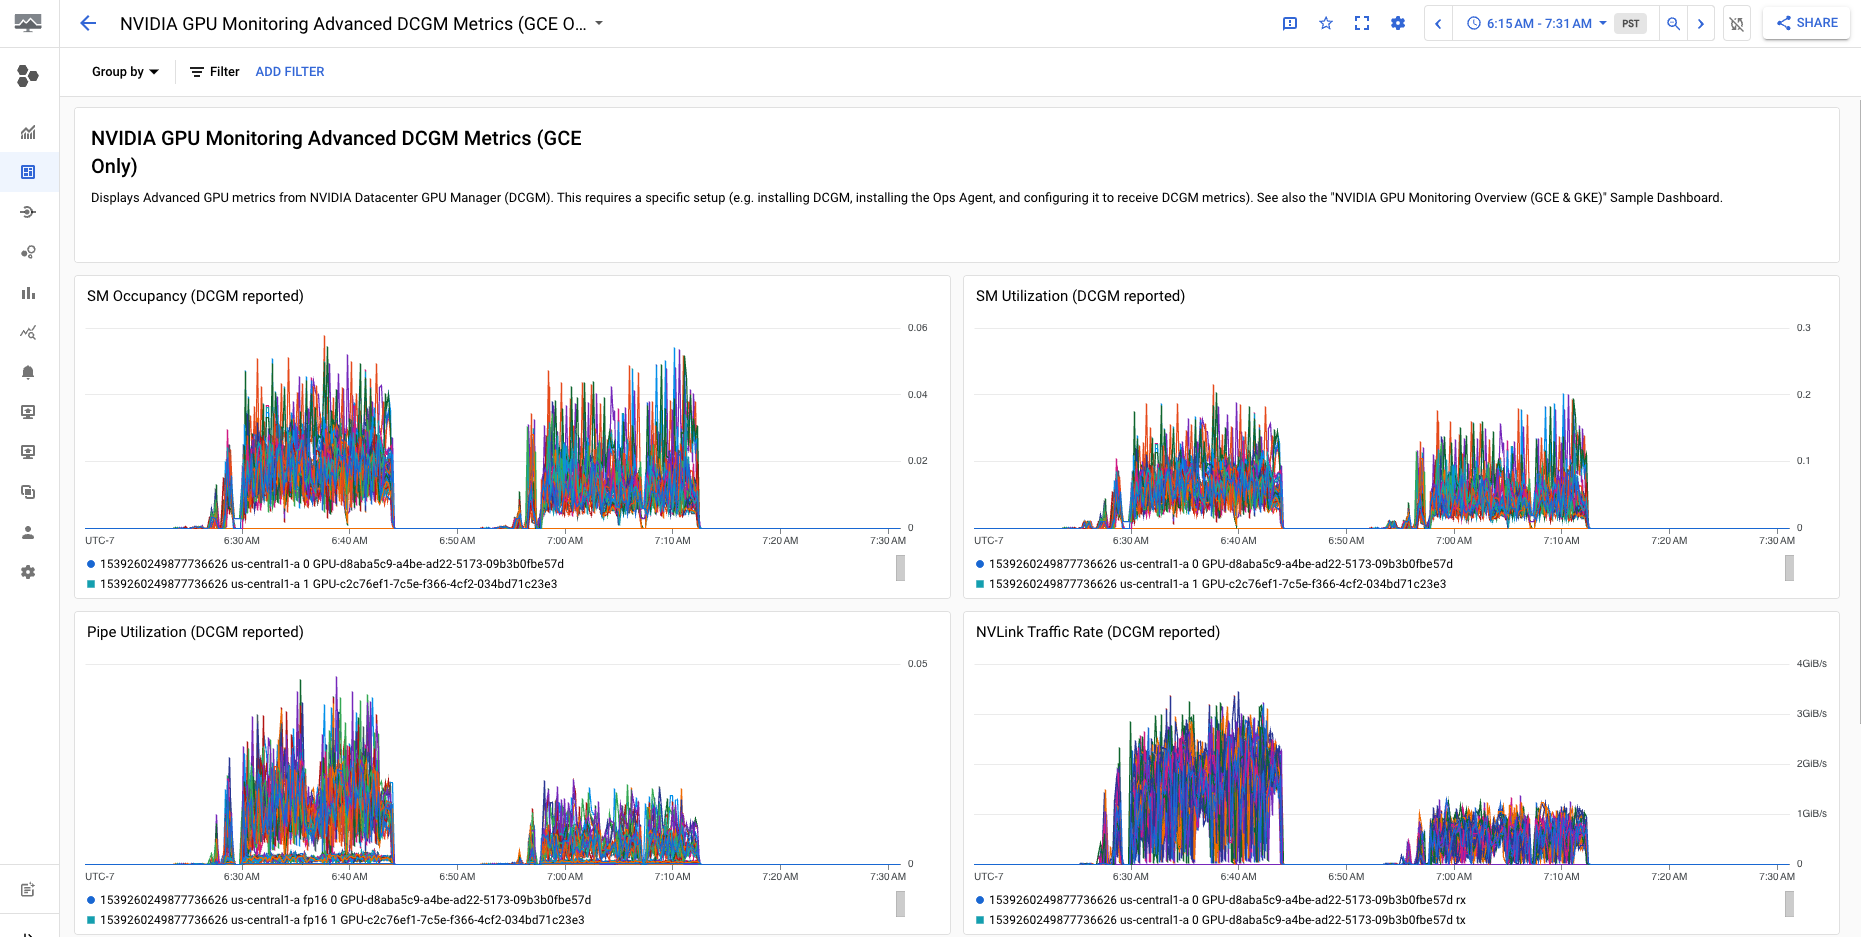
El panel de control Métricas avanzadas de DCGM de monitorización de GPU de NVIDIA (solo GCE) muestra métricas avanzadas clave, como la utilización de SM, la ocupación de SM, la utilización de la canalización de SM, la tasa de tráfico de PCIe y la tasa de tráfico de NVLink.
La pantalla de métricas de DCGM avanzadas será similar a la siguiente:
Siguientes pasos
- Para gestionar el mantenimiento del host de GPU, consulta Gestionar eventos de mantenimiento de host de GPU.
- Para mejorar el rendimiento de la red, consulta Usar un ancho de banda de red mayor.