Puoi creare una metrica personalizzata per generare avvisi o fornire informazioni per risolvere i problemi relativi agli snapshot pianificati.
Ad esempio, per configurare un avviso per gli errori degli snapshot pianificati, usa la procedura riportata di seguito:
- Crea un filtro di log per acquisire gli eventi degli snapshot pianificati.
- Crea una metrica basata sul filtro di log che conteggia gli errori degli snapshot pianificati.
- Crea una policy di avviso per inviare un avviso in caso di errore degli snapshot pianificati.
Prima di iniziare
-
Se non l'hai ancora fatto, configura l'autenticazione.
L'autenticazione è il processo mediante il quale la tua identità viene verificata per l'accesso a servizi e API Google Cloud .
Per eseguire codice o esempi da un ambiente di sviluppo locale, puoi autenticarti su Compute Engine selezionando una delle seguenti opzioni:
Select the tab for how you plan to use the samples on this page:
Console
When you use the Google Cloud console to access Google Cloud services and APIs, you don't need to set up authentication.
gcloud
-
Install the Google Cloud CLI. After installation, initialize the Google Cloud CLI by running the following command:
gcloud initIf you're using an external identity provider (IdP), you must first sign in to the gcloud CLI with your federated identity.
- Set a default region and zone.
REST
Per utilizzare gli esempi di API REST in questa pagina in un ambiente di sviluppo locale, devi utilizzare le credenziali che fornisci a gcloud CLI.
Install the Google Cloud CLI. After installation, initialize the Google Cloud CLI by running the following command:
gcloud initIf you're using an external identity provider (IdP), you must first sign in to the gcloud CLI with your federated identity.
Per saperne di più, consulta Autenticarsi per l'utilizzo di REST nella documentazione sull'autenticazione di Google Cloud .
Ruoli e autorizzazioni richiesti
Per ottenere le autorizzazioni necessarie per creare una pianificazione degli snapshot, chiedi all'amministratore di concederti i seguenti ruoli IAM nel progetto:
-
Compute Instance Admin (v1) (
roles/compute.instanceAdmin.v1) -
Per connetterti a una VM che può essere eseguita come service account: Service Account User (v1) (
roles/iam.serviceAccountUser)
Per saperne di più sulla concessione dei ruoli, consulta Gestisci l'accesso a progetti, cartelle e organizzazioni.
Potresti anche riuscire a ottenere le autorizzazioni richieste tramite i ruoli personalizzati o altri ruoli predefiniti.
Crea un filtro di log
Crea un filtro di log per acquisire gli eventi degli snapshot pianificati.
Console
Nella console Google Cloud , vai alla pagina Logging > Esplora log.
Nell'elenco Filtra per etichetta o testo, seleziona Converti in filtro avanzato.
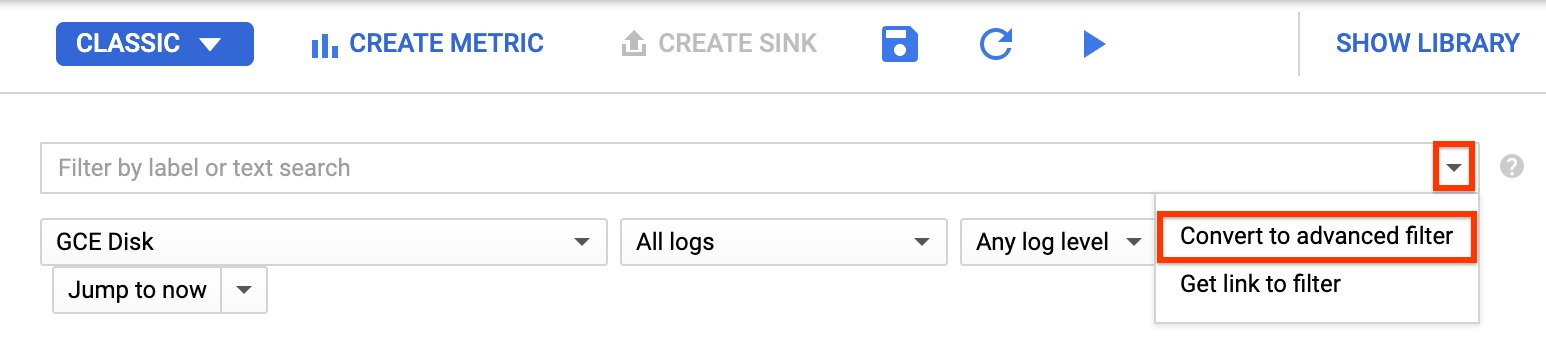
Per sostituire il campo del filtro, inserisci il testo seguente sostituendo
PROJECT_IDcon il tuo ID progetto:resource.type="gce_disk" logName="projects/PROJECT_ID/logs/cloudaudit.googleapis.com%2Fsystem_event" protoPayload.methodName="ScheduledSnapshots" severity>"INFO"Fai clic su Invia filtro.
Crea una metrica
Dopo aver creato il filtro dei log, crea una metrica che conteggia gli errori relativi agli snapshot pianificati.
Console
Nella pagina Esplora log, fai clic su Crea metrica.
Nell'Editor metriche, inserisci quanto segue:
- Nome:
scheduled_snapshot_failure_count - Descrizione:
count of scheduled snapshot failures - Tipo:
Counter
- Nome:
In Etichette, fai clic su Aggiungi elemento e inserisci quanto segue:
- Nome:
status - Descrizione:
status of scheduled snapshot request - Tipo di etichetta:
String - Nome campo:
protoPayload.response.status
- Nome:
Fai clic su Fine.
Fai clic su Crea metrica.
Crea una policy di avviso
Dopo aver creato la metrica, crea una policy di avviso per inviare un avviso in caso di errore degli snapshot pianificati.
Console
Nella console Google Cloud , vai alla pagina Cloud Logging > Metriche basate su log.
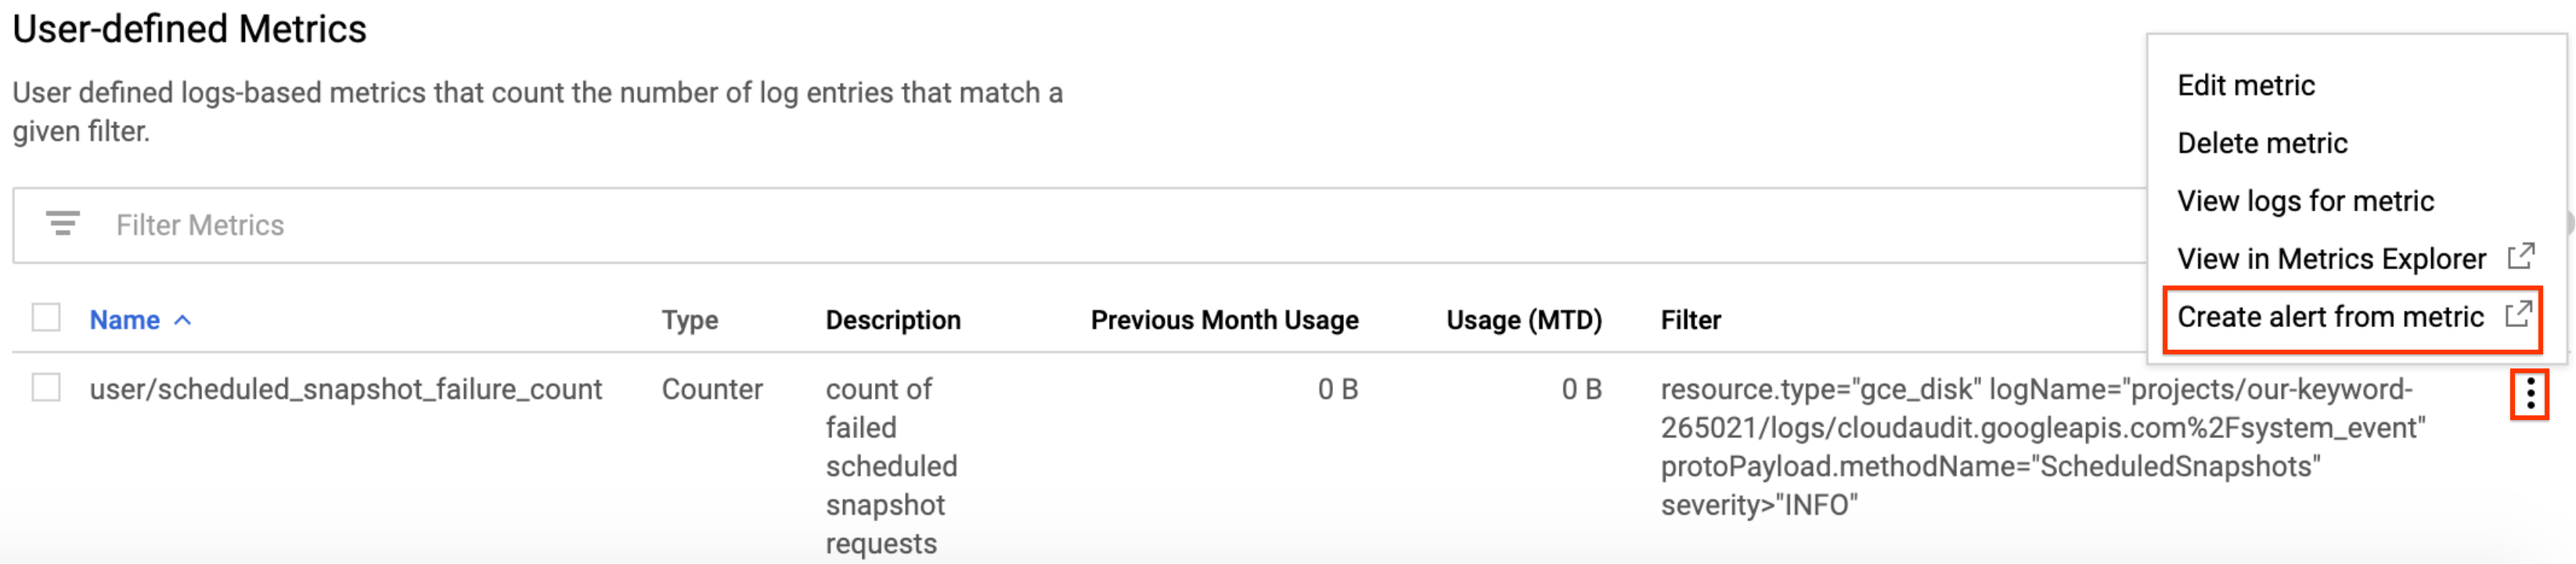
In Metriche definite dall'utente, individua la nuova metrica denominata
user/scheduled_snapshot_failure_count.Fai clic sul pulsante di menu Altro in questa riga e seleziona Crea avviso da metrica. Viene visualizzata la pagina di creazione della condizione della policy di avviso.
Nel riquadro Target, seleziona nessuno in Aggregatore.
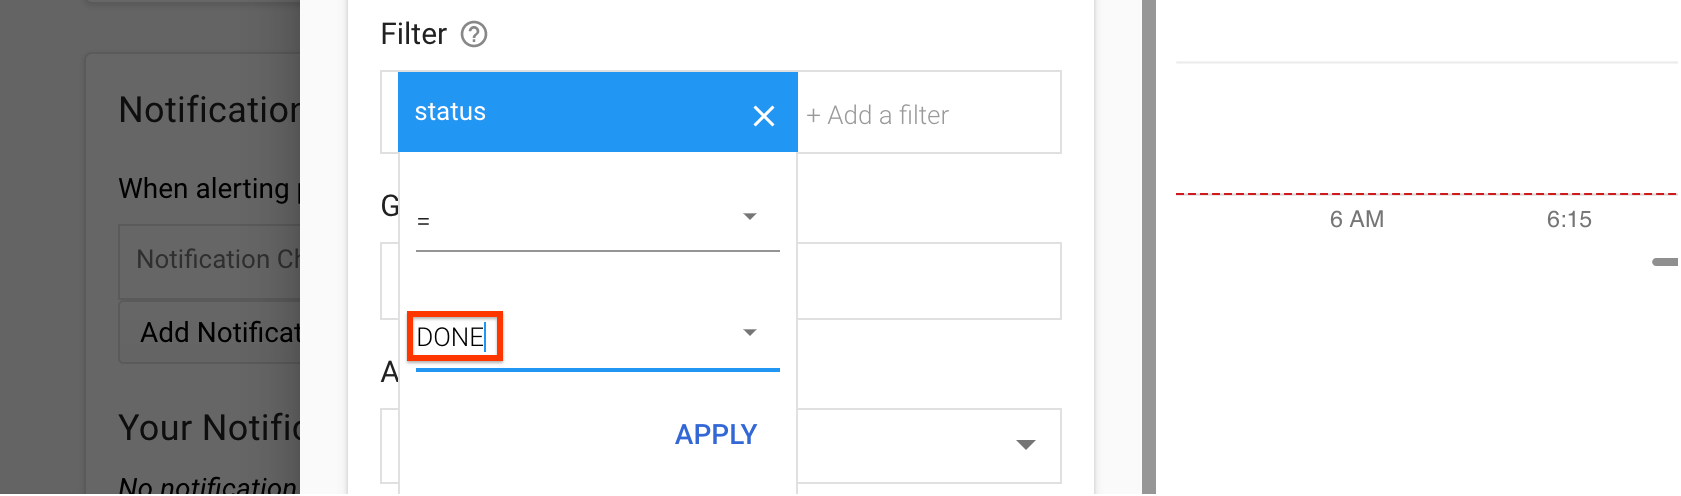
In Filtro:
- Fai clic su Aggiungi un filtro.
- Seleziona stato dall'elenco.
- Nel campo Valore, digita FINE.
- Fai clic su Applica.
Fai clic su Mostra opzioni avanzate.
Nel riquadro Aggregazione avanzata, fai clic sull'elenco Allineatore e seleziona somma.
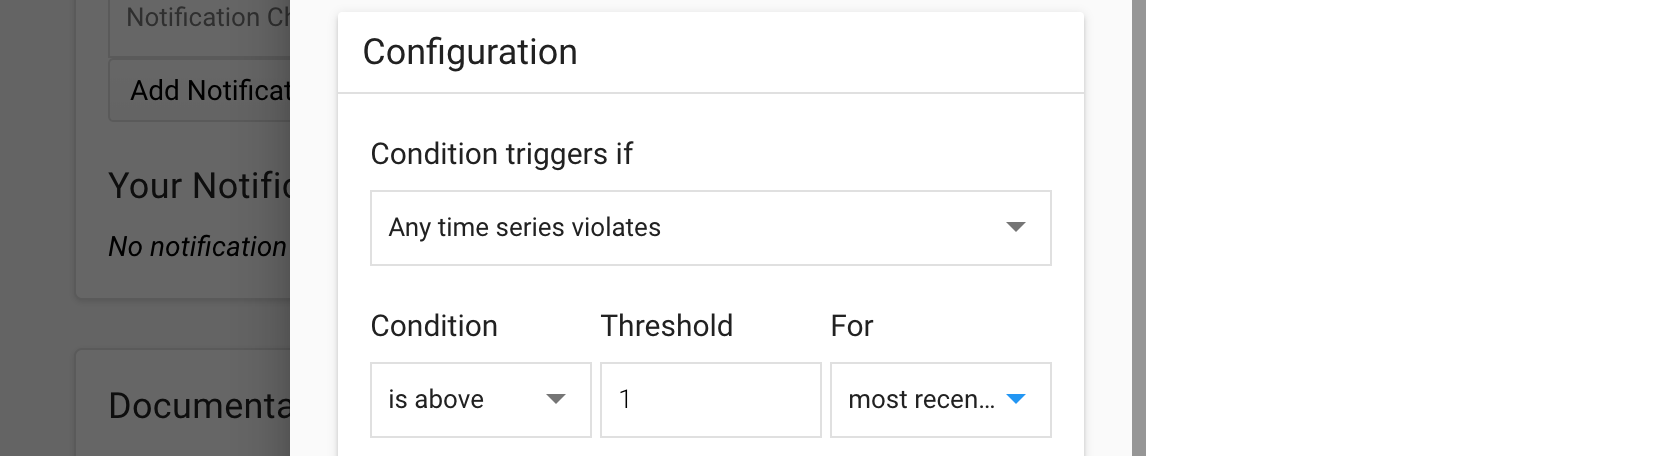
Nel riquadro Configurazione, seleziona i seguenti valori:
- La condizione si attiva se:
Any time series violates - Condizione:
is above - Soglia:
1 - Per:
most recent value
- La condizione si attiva se:
Fai clic su Salva.
Nella pagina Crea nuova policy di avviso, inserisci un nome per la policy. Se vuoi, puoi aggiungere canali di notifica e documentazione per questa policy.
Fai clic su Salva.
Passaggi successivi
- Scopri di più sulle frequenze di pianificazione degli snapshot, sulle norme di conservazione e sulle regole di denominazione in Informazioni sulle pianificazioni degli snapshot per i dischi.
- Scopri di più sugli snapshot dei dischi.
- Scopri come creare snapshot pianificati per i dischi.
- Scopri come visualizzare i log.
Salvo quando diversamente specificato, i contenuti di questa pagina sono concessi in base alla licenza Creative Commons Attribution 4.0, mentre gli esempi di codice sono concessi in base alla licenza Apache 2.0. Per ulteriori dettagli, consulta le norme del sito di Google Developers. Java è un marchio registrato di Oracle e/o delle sue consociate.
Ultimo aggiornamento 2025-09-23 UTC.
-