Vous pouvez créer des métriques personnalisées pour déclencher des alertes ou fournir des informations permettant de résoudre des problèmes liés à une programmation d'instantanés.
Par exemple, pour configurer une alerte en cas d'échec d'une programmation d'instantanés, procédez comme suit :
- Créez un filtre de journal afin de capturer les événements liés aux programmations d'instantanés.
- Créez une métrique basée sur le filtre de journal, qui compte les échecs de programmations d'instantanés.
- Créez une règle d'alerte pour envoyer une alerte en cas d'échec d'une programmation d'instantanés.
Avant de commencer
-
Si ce n'est pas déjà fait, configurez l'authentification.
L'authentification permet de valider votre identité pour accéder aux services et aux API Google Cloud . Pour exécuter du code ou des exemples depuis un environnement de développement local, vous pouvez vous authentifier auprès de Compute Engine en sélectionnant l'une des options suivantes :
Select the tab for how you plan to use the samples on this page:
Console
When you use the Google Cloud console to access Google Cloud services and APIs, you don't need to set up authentication.
gcloud
-
Installez la Google Cloud CLI. Une fois l'installation terminée, initialisez la Google Cloud CLI en exécutant la commande suivante :
gcloud initSi vous utilisez un fournisseur d'identité (IdP) externe, vous devez d'abord vous connecter à la gcloud CLI avec votre identité fédérée.
- Set a default region and zone.
REST
Pour utiliser les exemples API REST de cette page dans un environnement de développement local, vous devez utiliser les identifiants que vous fournissez à la gcloud CLI.
Installez la Google Cloud CLI. Une fois l'installation terminée, initialisez la Google Cloud CLI en exécutant la commande suivante :
gcloud initSi vous utilisez un fournisseur d'identité (IdP) externe, vous devez d'abord vous connecter à la gcloud CLI avec votre identité fédérée.
Pour en savoir plus, consultez la section S'authentifier pour utiliser REST dans la documentation sur l'authentification Google Cloud .
Rôles et autorisations requis
Pour obtenir les autorisations nécessaires pour créer une programmation d'instantanés, demandez à votre administrateur de vous accorder les rôles IAM suivants sur le projet :
-
Administrateur d'instances Compute (v1) (
roles/compute.instanceAdmin.v1) -
Pour se connecter à une VM pouvant s'exécuter en tant que compte de service :
Utilisateur du compte de service (v1) (
roles/iam.serviceAccountUser)
Pour en savoir plus sur l'attribution de rôles, consultez Gérer l'accès aux projets, aux dossiers et aux organisations.
Vous pouvez également obtenir les autorisations requises via des rôles personnalisés ou d'autres rôles prédéfinis.
Créer un filtre de journal
Créez un filtre de journal afin de capturer les événements liés aux programmations d'instantanés.
Console
Dans la console Google Cloud , accédez à la page Journalisation > Explorateur de journaux.
Dans la liste Filtrer par étiquette ou texte recherché, sélectionnez Convertir en filtre avancé.

Remplacez le champ de filtre en saisissant le texte suivant, en remplaçant
PROJECT_IDpar votre ID de projet :resource.type="gce_disk" logName="projects/PROJECT_ID/logs/cloudaudit.googleapis.com%2Fsystem_event" protoPayload.methodName="ScheduledSnapshots" severity>"INFO"Cliquez sur Submit Filter (Envoyer le filtre).
Créer une métrique
Une fois le filtre de journal créé, créez une métrique qui compte les échecs de programmations d'instantanés.
Console
Sur la page Explorateur de journaux, cliquez sur Créer une métrique.
Dans l'Éditeur de métriques, saisissez les éléments suivants :
- Nom :
scheduled_snapshot_failure_count. - Description :
count of scheduled snapshot failures. - Type :
Counter
- Nom :
Sous Libellés, cliquez sur Ajouter un élément, puis saisissez les informations suivantes :
- Nom :
status - Description :
status of scheduled snapshot request - Type de libellé :
String - Nom du champ :
protoPayload.response.status
- Nom :
Cliquez sur OK.
Cliquez sur Créer une métrique.
Créer une règle d'alerte
Après avoir créé la métrique, créez une règle d'alerte pour envoyer une alerte en cas d'échec d'une programmation d'instantanés.
Console
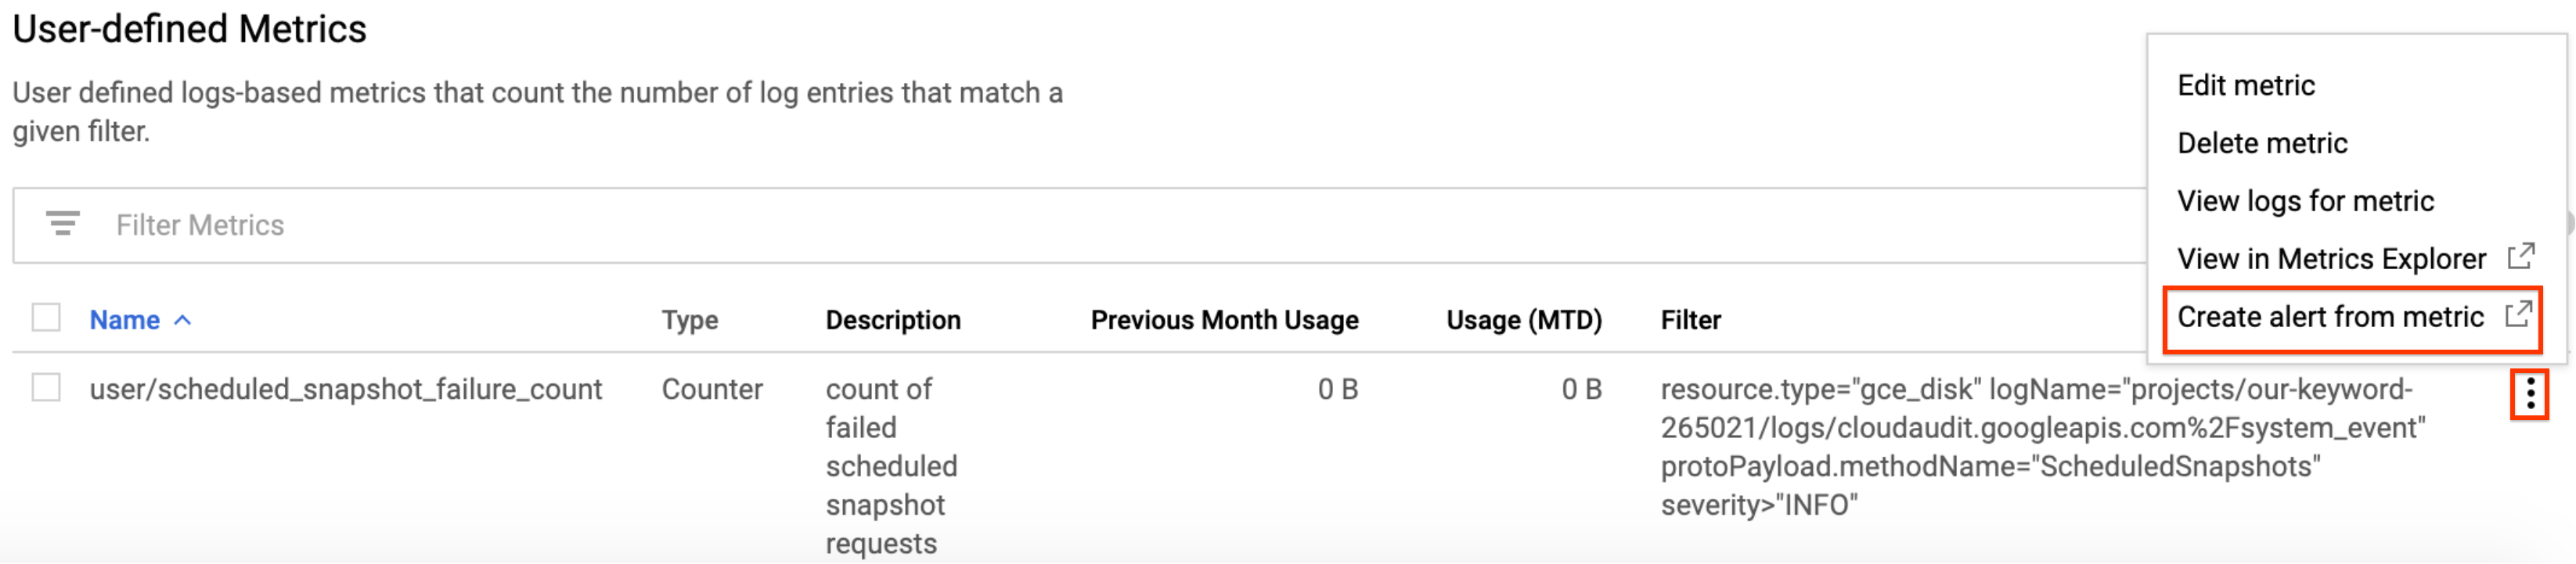
Dans la console Google Cloud , accédez à la page Cloud Logging > Métriques basées sur les journaux.
Sous Métriques définies par l'utilisateur, localisez votre nouvelle métrique nommée
user/scheduled_snapshot_failure_count.Cliquez sur le bouton de menu Plus figurant sur cette ligne, puis sélectionnez Créer une alerte à partir de la métrique. La page de création d'une condition applicable à une règle d'alerte s'affiche.
Dans le panneau Cible, sous Agrégateur, sélectionnez aucun.
Sous Filtre :
- Cliquez sur Ajouter un filtre.
- Dans la liste, sélectionnez état.
- Dans le champ Valeur, saisissez DONE.
- Cliquez sur Appliquer.

Cliquez sur Afficher les options avancées.
Dans le volet Agrégation avancée, cliquez sur la liste Aligneur et sélectionnez somme.
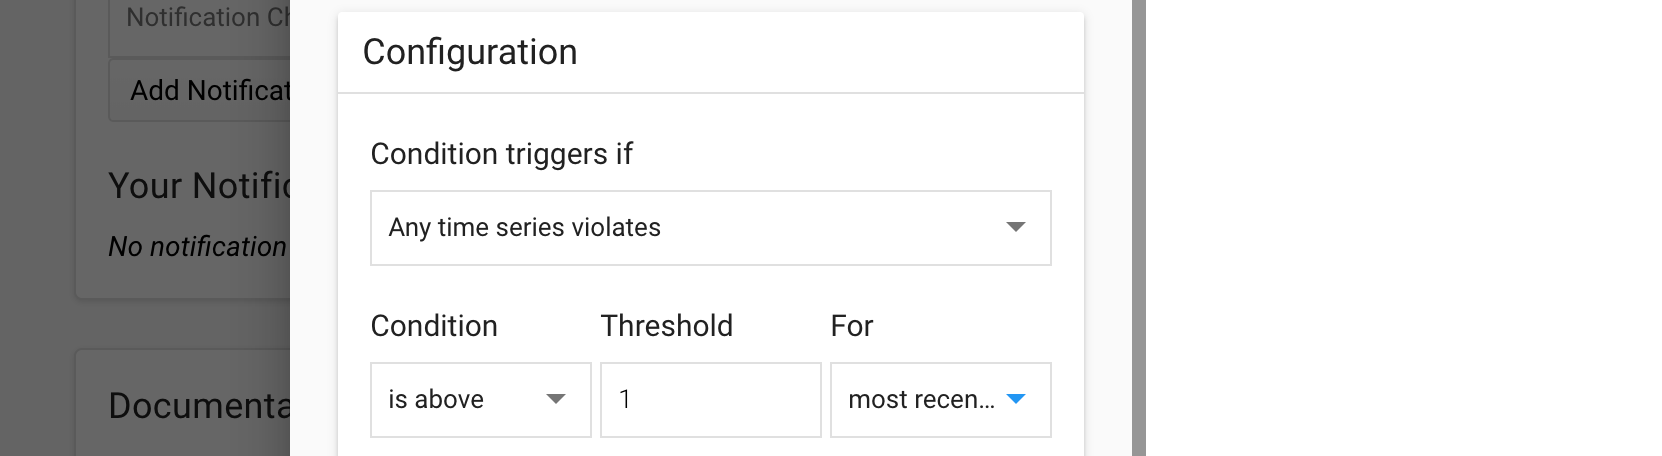
Dans le panneau Configuration, sélectionnez les valeurs suivantes :
- Déclenchement de la condition :
Any time series violates - Condition :
is above - Seuil :
1 - Pour :
most recent value
- Déclenchement de la condition :
Cliquez sur Enregistrer.
Sur la page Créer une règle d'alerte, saisissez un nom de règle. Vous pouvez au besoin ajouter des canaux de notification et de la documentation concernant cette règle.
Cliquez sur Enregistrer.
Étapes suivantes
- Pour en savoir plus sur les fréquences d'instantanés programmées, les règles de conservation et les règles d'attribution de noms, consultez la page À propos des programmations d'instantanés pour les disques.
- Apprenez-en plus sur les instantanés de disque.
- Découvrez comment créer des instantanés programmés pour des disques.
- Découvrez comment afficher les journaux.
Sauf indication contraire, le contenu de cette page est régi par une licence Creative Commons Attribution 4.0, et les échantillons de code sont régis par une licence Apache 2.0. Pour en savoir plus, consultez les Règles du site Google Developers. Java est une marque déposée d'Oracle et/ou de ses sociétés affiliées.
Dernière mise à jour le 2025/10/19 (UTC).
-