Sie können einen benutzerdefinierten Messwert erstellen, um Benachrichtigungen zu erhalten oder Informationen zur Fehlerbehebung bei geplanten Snapshots bereitzustellen.
Wenn Sie beispielsweise eine Benachrichtigung für geplante Snapshot-Fehler einrichten möchten, gehen Sie so vor:
- Erstellen Sie einen Logfilter, um geplante Snapshot-Ereignisse zu erfassen.
- Erstellen Sie einen Messwert anhand des Logfilters, der geplante Snapshot-Fehler zählt.
- Erstellen Sie eine Benachrichtigungsrichtlinie, um eine Warnung zu senden, wenn ein geplanter Snapshot fehlschlägt.
Hinweise
-
Richten Sie die Authentifizierung ein, falls Sie dies noch nicht getan haben.
Bei der Authentifizierung wird Ihre Identität für den Zugriff auf Google Cloud -Dienste und APIs überprüft. Zum Ausführen von Code oder Beispielen aus einer lokalen Entwicklungsumgebung können Sie sich so bei Compute Engine authentifizieren:
Select the tab for how you plan to use the samples on this page:
Console
When you use the Google Cloud console to access Google Cloud services and APIs, you don't need to set up authentication.
gcloud
-
Installieren Sie die Google Cloud CLI. Initialisieren Sie die Google Cloud CLI nach der Installation mit dem folgenden Befehl:
gcloud initWenn Sie einen externen Identitätsanbieter (IdP) verwenden, müssen Sie sich zuerst mit Ihrer föderierten Identität in der gcloud CLI anmelden.
- Set a default region and zone.
REST
Wenn Sie die REST API-Beispiele auf dieser Seite in einer lokalen Entwicklungsumgebung verwenden möchten, verwenden Sie die Anmeldedaten, die Sie der gcloud CLI bereitstellen.
Installieren Sie die Google Cloud CLI. Initialisieren Sie die Google Cloud CLI nach der Installation mit dem folgenden Befehl:
gcloud initWenn Sie einen externen Identitätsanbieter (IdP) verwenden, müssen Sie sich zuerst mit Ihrer föderierten Identität in der gcloud CLI anmelden.
Weitere Informationen finden Sie in der Dokumentation zur Google Cloud -Authentifizierung unter Für die Verwendung von REST authentifizieren.
Erforderliche Rollen und Berechtigungen
Bitten Sie Ihren Administrator, Ihnen die folgenden IAM-Rollen für das Projekt zuzuweisen, um die Berechtigungen zu erhalten, die Sie zum Erstellen eines Snapshot-Zeitplans benötigen:
-
Compute-Instanzadministrator (Version 1) (
roles/compute.instanceAdmin.v1) -
So stellen Sie eine Verbindung zu einer VM her, die als Dienstkonto ausgeführt werden kann:
Service Account User (v1) (
roles/iam.serviceAccountUser)
Weitere Informationen zum Zuweisen von Rollen finden Sie unter Zugriff auf Projekte, Ordner und Organisationen verwalten.
Sie können die erforderlichen Berechtigungen auch über benutzerdefinierte Rollen oder andere vordefinierte Rollen erhalten.
Logfilter erstellen
Erstellen Sie einen Logfilter, um geplante Snapshot-Ereignisse zu erfassen.
Console
Rufen Sie in der Google Cloud Console die Seite Logging > Log-Explorer auf.
Wählen Sie in der Liste Filter by label or text search (Nach Label oder Textsuche filtern) die Option Convert to advanced filter (In erweiterten Filter umwandeln) aus.

Ersetzen Sie das Filterfeld durch Eingabe des folgenden Texts und ersetzen Sie dabei
PROJECT_IDdurch Ihre Projekt-ID:resource.type="gce_disk" logName="projects/PROJECT_ID/logs/cloudaudit.googleapis.com%2Fsystem_event" protoPayload.methodName="ScheduledSnapshots" severity>"INFO"Klicken Sie auf Filter senden.
Messwert erstellen
Nachdem Sie den Logfilter erstellt haben, erstellen Sie einen Messwert, der geplante Snapshot-Fehler zählt.
Console
Klicken Sie auf der Seite Log-Explorer auf Messwert erstellen.
Geben Sie in Messwerteditor Folgendes ein:
- Name:
scheduled_snapshot_failure_count. - Beschreibung:
count of scheduled snapshot failures. - Typ:
Counter
- Name:
Klicken Sie unter Labels auf Element hinzufügen und geben Sie Folgendes ein:
- Name:
status - Description:
status of scheduled snapshot request - Labeltyp:
String - Feldname:
protoPayload.response.status
- Name:
Klicken Sie auf Fertig.
Klicken Sie auf Messwert erstellen.
Benachrichtigungsrichtlinie erstellen
Nachdem Sie den Messwert erstellt haben, erstellen Sie eine Benachrichtigungsrichtlinie, um eine Warnung zu senden, wenn ein geplanter Snapshot fehlschlägt.
Console
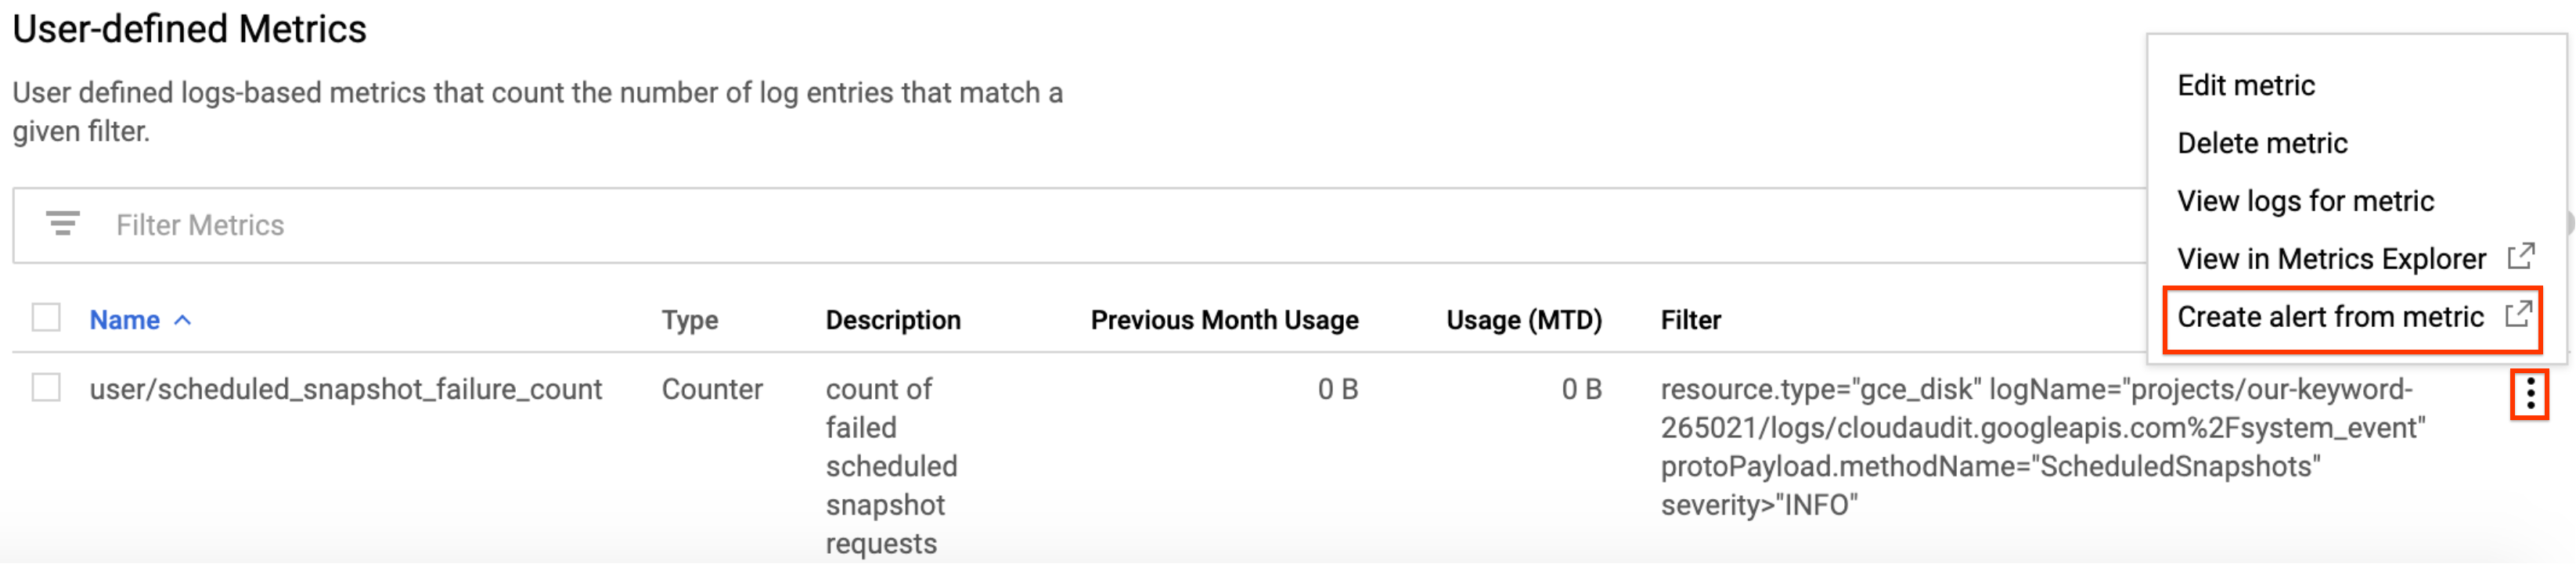
Rufen Sie in der Google Cloud Console die Seite Cloud Logging > Logbasierte Messwerte auf.
Suchen Sie im Feld User-defined Metrics (Benutzerdefinierte Messwerte) nach dem neuen Messwert mit dem Namen
user/scheduled_snapshot_failure_count.Klicken Sie in dieser Zeile auf die Menüschaltfläche More (Mehr) und wählen Sie Create alert from metric (Benachrichtigung mit dem Messwert erstellen) aus. Die Seite zur Erstellung von Bedingungen für Benachrichtigungsrichtlinien wird geöffnet.
Wählen Sie im Feld Ziel unter Aggregator die Option Keine aus.
Unter Filter:
- Klicken Sie auf Add a filter (Filter hinzufügen).
- Wählen Sie Status aus der Liste aus.
- Geben Sie im Feld Value (Wert) die Option DONE (Fertig) ein.
- Klicken Sie auf Anwenden.

Klicken Sie auf Erweiterte Optionen einblenden.
Klicken Sie im Bereich Erweiterte Aggregation auf die Liste Aligner und wählen Sie Summe aus.
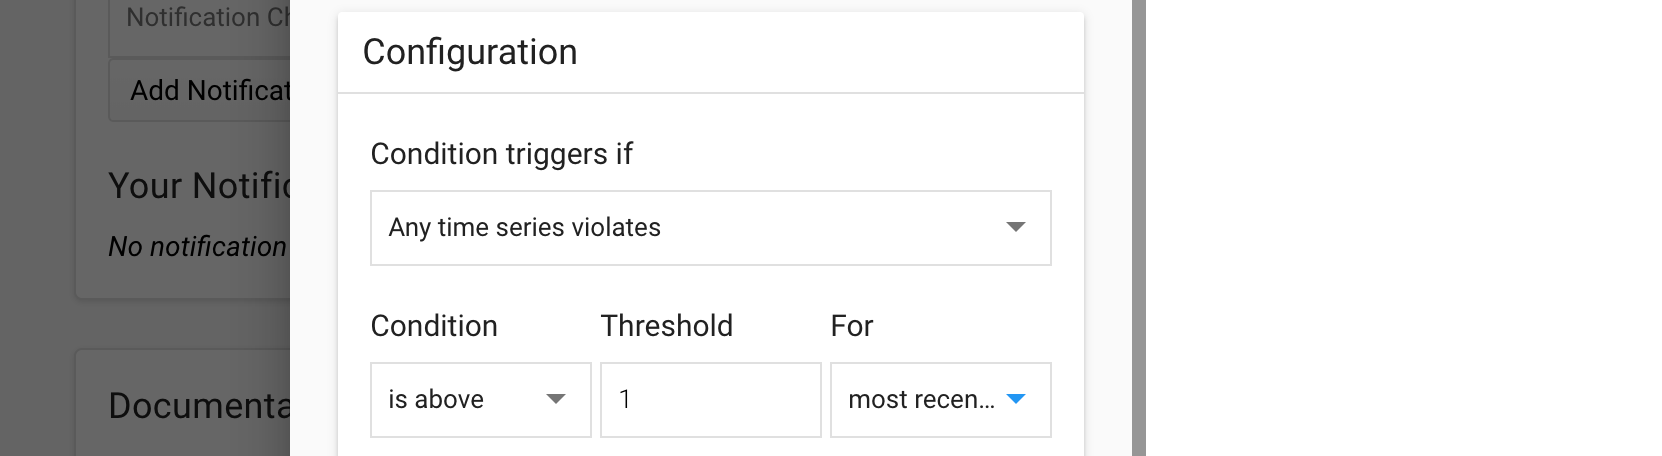
Wählen Sie im Bereich Configuration (Konfiguration) die folgenden Werte aus:
- Condition triggers if (Bedingung wird ausgelöst, wenn):
Any time series violates - Condition (Bedingung):
is above - Threshold (Grenzwert):
1 - For (Für):
most recent value
- Condition triggers if (Bedingung wird ausgelöst, wenn):
Klicken Sie auf Speichern.
Geben Sie auf der Seite Neue Benachrichtigungsrichtlinie erstellen einen Richtliniennamen ein. Optional können Sie Benachrichtigungskanäle und Dokumentation für diese Richtlinie hinzufügen.
Klicken Sie auf Speichern.
Nächste Schritte
- Weitere Informationen zur Häufigkeit von Snapshot-Zeitplänen, Aufbewahrungsrichtlinien und Benennungsregeln finden Sie unter Snapshot-Zeitpläne für Laufwerke.
- Laufwerk-Snapshots
- Geplante Snapshots für Laufwerke erstellen
- Logs ansehen
Sofern nicht anders angegeben, sind die Inhalte dieser Seite unter der Creative Commons Attribution 4.0 License und Codebeispiele unter der Apache 2.0 License lizenziert. Weitere Informationen finden Sie in den Websiterichtlinien von Google Developers. Java ist eine eingetragene Marke von Oracle und/oder seinen Partnern.
Zuletzt aktualisiert: 2025-10-19 (UTC).
-