Puede crear una métrica personalizada para activar alertas o proporcionar información para solucionar problemas con las creaciones de copias de seguridad programadas.
Por ejemplo, para configurar una alerta sobre los errores de las copias de seguridad programadas, sigue este procedimiento:
- Crea un filtro de registro para capturar eventos de capturas programadas.
- Crea una métrica basada en el filtro de registros que cuenta los errores de las capturas programadas.
- Crea una política de alertas para enviar una alerta cuando se produzca un error en una instantánea programada.
Antes de empezar
-
Si aún no lo has hecho, configura la autenticación.
La autenticación verifica tu identidad para acceder a Google Cloud servicios y APIs. Para ejecutar código o ejemplos desde un entorno de desarrollo local, puedes autenticarte en Compute Engine seleccionando una de las siguientes opciones:
Select the tab for how you plan to use the samples on this page:
Console
When you use the Google Cloud console to access Google Cloud services and APIs, you don't need to set up authentication.
gcloud
-
Instala Google Cloud CLI. Después de la instalación, inicializa la CLI de Google Cloud ejecutando el siguiente comando:
gcloud initSi utilizas un proveedor de identidades (IdP) externo, primero debes iniciar sesión en la CLI de gcloud con tu identidad federada.
- Set a default region and zone.
REST
Para usar las muestras de la API REST de esta página en un entorno de desarrollo local, debes usar las credenciales que proporciones a la CLI de gcloud.
Instala Google Cloud CLI. Después de la instalación, inicializa la CLI de Google Cloud ejecutando el siguiente comando:
gcloud initSi utilizas un proveedor de identidades (IdP) externo, primero debes iniciar sesión en la CLI de gcloud con tu identidad federada.
Para obtener más información, consulta el artículo Autenticarse para usar REST de la documentación sobre autenticación de Google Cloud .
Roles y permisos necesarios
Para obtener los permisos que necesitas para crear una programación de capturas, pide a tu administrador que te conceda los siguientes roles de gestión de identidades y accesos en el proyecto:
-
Administrador de instancias de Compute (v. 1) (
roles/compute.instanceAdmin.v1) -
Para conectarte a una VM que pueda ejecutarse como cuenta de servicio, sigue estos pasos:
Usuario de cuenta de servicio (v. 1) (
roles/iam.serviceAccountUser)
Para obtener más información sobre cómo conceder roles, consulta el artículo Gestionar el acceso a proyectos, carpetas y organizaciones.
También puedes conseguir los permisos necesarios a través de roles personalizados u otros roles predefinidos.
Crear un filtro de registro
Crea un filtro de registro para capturar eventos de capturas programadas.
Consola
En la Google Cloud consola, ve a la página Logging > Explorador de registros.
En la lista Filtrar por etiqueta o buscar texto, seleccione Convertir a filtro avanzado.

Sustituye el campo de filtro introduciendo el siguiente texto y reemplazando
PROJECT_IDpor el ID de tu proyecto:resource.type="gce_disk" logName="projects/PROJECT_ID/logs/cloudaudit.googleapis.com%2Fsystem_event" protoPayload.methodName="ScheduledSnapshots" severity>"INFO"Haz clic en Enviar filtro.
Crear una métrica
Después de crear el filtro de registro, cree una métrica que cuente los errores de las capturas programadas.
Consola
En la página Explorador de registros, haz clic en Crear métrica.
En el Editor de métricas, introduce lo siguiente:
- Nombre:
scheduled_snapshot_failure_count. - Descripción:
count of scheduled snapshot failures. - Tipo:
Counter
- Nombre:
En Etiquetas, haz clic en Añadir elemento e introduce lo siguiente:
- Nombre:
status - Descripción:
status of scheduled snapshot request - Tipo de etiqueta:
String - Nombre del campo:
protoPayload.response.status
- Nombre:
Haz clic en Listo.
Haz clic en Crear métrica.
Crear una política de alertas
Después de crear la métrica, crea una política de alertas para enviar una alerta cuando se produzca un error en una instantánea programada.
Consola
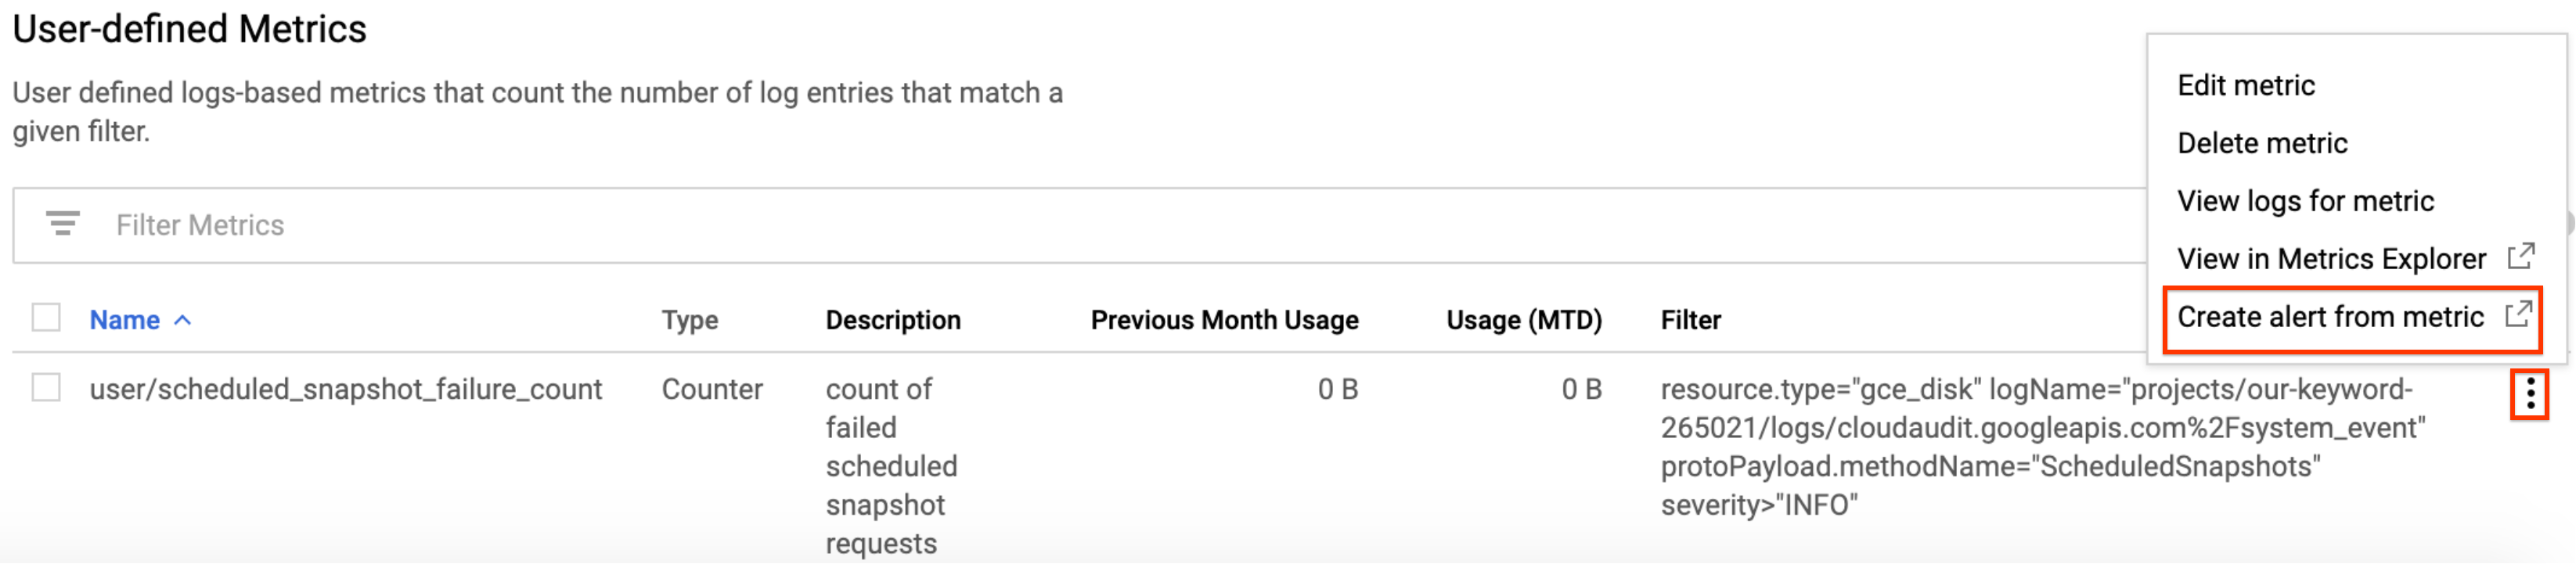
En la Google Cloud consola, ve a la página Cloud Logging > Métricas basadas en registros.
En Métricas definidas por el usuario, busca la métrica que has creado, llamada
user/scheduled_snapshot_failure_count.Haz clic en el botón de menú Más de esta fila y selecciona Crear alerta a partir de la métrica. Se abrirá la página de creación de condiciones de la política de alertas.
En el panel Objetivo, en Agregador, selecciona ninguno.
En Filtrar:
- Haz clic en Añadir un filtro.
- Selecciona Estado en la lista.
- En el campo Valor, escribe DONE.
- Haz clic en Aplicar.

Haz clic en Mostrar opciones avanzadas.
En el panel Agregación avanzada, haz clic en la lista Alineador y selecciona Suma.
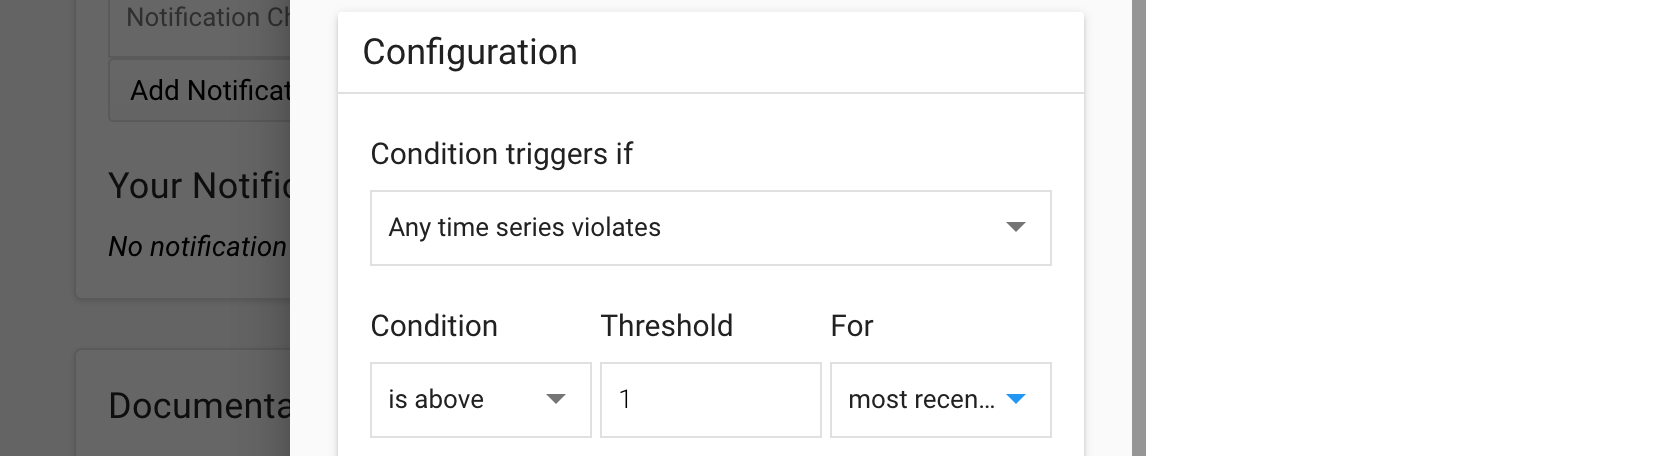
En el panel Configuración, selecciona los siguientes valores:
- El activador se activa si:
Any time series violates - Condición:
is above - Requisitos:
1 - Para:
most recent value
- El activador se activa si:
Haz clic en Guardar.
En la página Crear política de alertas, introduce un nombre para la política. También puedes añadir canales de notificación y documentación para esta política.
Haz clic en Guardar.
Siguientes pasos
- Consulta información sobre las frecuencias, las políticas de retención y las reglas de nomenclatura de las programaciones de capturas en el artículo Acerca de las programaciones de capturas de discos.
- Consulta información sobre las capturas de disco.
- Consulta cómo crear capturas programadas de discos.
- Consulta cómo ver los registros.
A menos que se indique lo contrario, el contenido de esta página está sujeto a la licencia Reconocimiento 4.0 de Creative Commons y las muestras de código están sujetas a la licencia Apache 2.0. Para obtener más información, consulta las políticas del sitio web de Google Developers. Java es una marca registrada de Oracle o sus afiliados.
Última actualización: 2025-10-19 (UTC).
-