您可以建立自訂指標來發出快訊或提供資訊,以解決排程快照的問題。
舉例來說,如要設定排程快照失敗的快訊,請按照下列程序操作:
事前準備
-
如果尚未設定驗證,請先完成設定。
「驗證」是指驗證身分的程序,確認您有權存取 Google Cloud 服務和 API。如要從本機開發環境執行程式碼或範例,請選取下列任一選項,向 Compute Engine 進行驗證:
Select the tab for how you plan to use the samples on this page:
Console
When you use the Google Cloud console to access Google Cloud services and APIs, you don't need to set up authentication.
gcloud
-
安裝 Google Cloud CLI。 安裝完成後,執行下列指令初始化 Google Cloud CLI:
gcloud init如果您使用外部識別資訊提供者 (IdP),請先 使用聯合身分登入 gcloud CLI。
- Set a default region and zone.
REST
如要在本機開發環境中使用本頁的 REST API 範例,請使用您提供給 gcloud CLI 的憑證。
安裝 Google Cloud CLI。 安裝完成後,執行下列指令初始化 Google Cloud CLI:
gcloud init如果您使用外部識別資訊提供者 (IdP),請先 使用聯合身分登入 gcloud CLI。
詳情請參閱 Google Cloud 驗證說明文件中的「Authenticate for using REST」。
必要角色和權限
如要取得建立快照排程所需的權限,請要求管理員將專案的下列 IAM 角色授予您:
-
Compute 執行個體管理員 (v1) (
roles/compute.instanceAdmin.v1) -
如要連線至可做為服務帳戶執行的 VM:
服務帳戶使用者 (v1) (
roles/iam.serviceAccountUser)
如要進一步瞭解如何授予角色,請參閱「管理專案、資料夾和機構的存取權」。
建立記錄檔篩選器
建立記錄篩選器,擷取排程快照事件。
主控台
前往 Google Cloud 控制台的「記錄」頁面 (依序選取「記錄」>「記錄檔探索工具」)。
在「按標籤或搜尋字詞篩選」清單中,選取「轉換為進階篩選器」。

輸入下列文字,將篩選器欄位替換為您的專案 ID (請將
PROJECT_ID替換為您的專案 ID):resource.type="gce_disk" logName="projects/PROJECT_ID/logs/cloudaudit.googleapis.com%2Fsystem_event" protoPayload.methodName="ScheduledSnapshots" severity>"INFO"按一下 [Submit Filter] (提交篩選器)。
建立指標
建立記錄篩選器後,請建立指標,計算排定快照失敗的次數。
主控台
在「記錄探索器」頁面中,按一下「建立指標」。
在「指標編輯器」中,輸入下列內容:
- 名稱:
scheduled_snapshot_failure_count。 - 說明:
count of scheduled snapshot failures。 - 「Type」(類型):
Counter
- 名稱:
在「標籤」下方,按一下「新增項目」,然後輸入下列資訊:
- Name (名稱):
status - 說明:
status of scheduled snapshot request - 標籤類型:
String - 欄位名稱:
protoPayload.response.status
- Name (名稱):
按一下 [完成]。
按一下 [建立指標]。
建立快訊政策
建立指標後,請建立快訊政策,以便在排定的快照作業失敗時收到快訊。
主控台
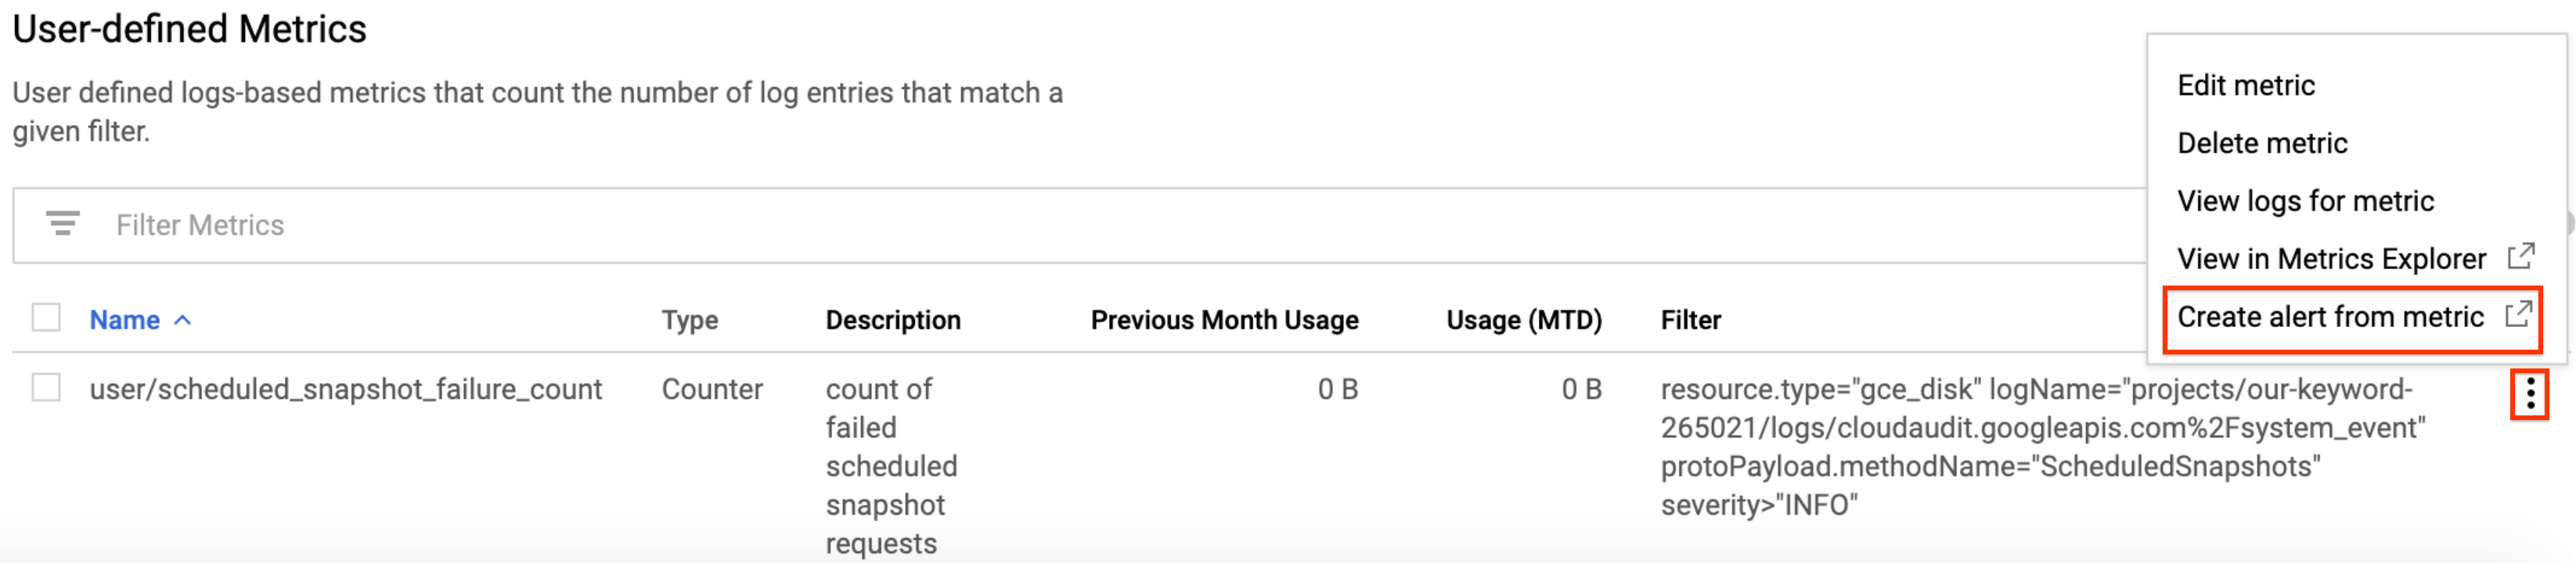
在 Google Cloud 控制台中,依序前往「Cloud Logging」>「Logs-based metrics」(記錄指標) 頁面。
在「使用者定義指標」下方,找到名為「
user/scheduled_snapshot_failure_count」的新指標。按一下該列中的「更多」選單按鈕,然後選取「運用指標建立快訊」。系統隨即會開啟快訊政策條件建立頁面。
在「目標」面板的「匯總器」下方,選取「無」。
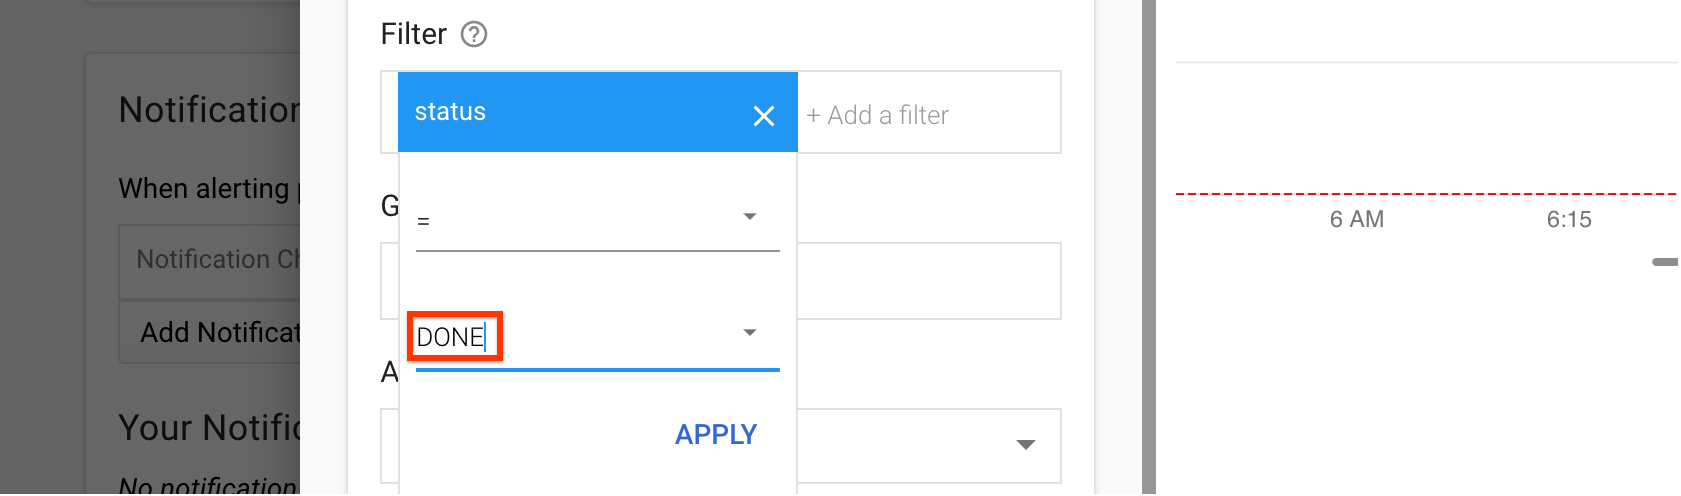
在「篩選器」下方:
- 按一下 [新增篩選器]。
- 從清單中選取「狀態」。
- 在「Value」(值) 欄位中,輸入 DONE。
- 按一下 [套用]。
按一下 [Show advanced options] (顯示進階選項)。
在「進階匯總」窗格中,按一下「校正函式」清單,然後選取「總和」。
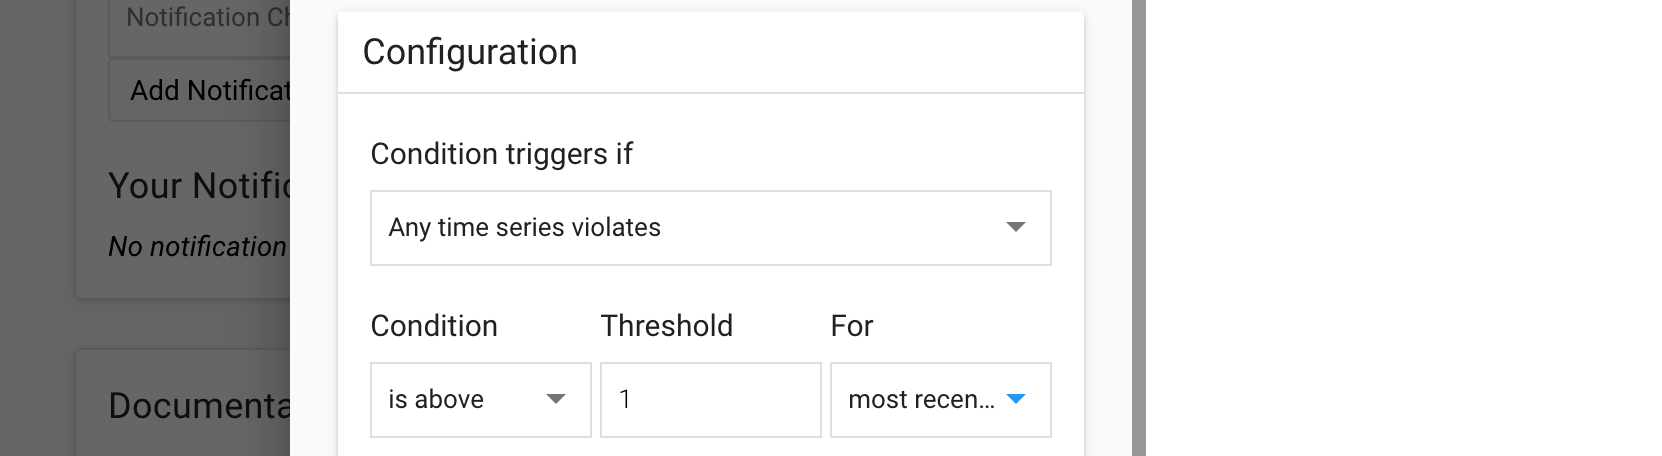
在「Configuration」面板中,選取下列值:
- 符合下列情況時觸發條件:
Any time series violates - 條件:
is above - 門檻:
1 - 適用於:
most recent value
- 符合下列情況時觸發條件:
按一下 [儲存]。
在「建立新的快訊政策」頁面中,輸入政策名稱。 (選用) 您可以為這項政策新增通知管道和說明文件。
按一下 [儲存]。
後續步驟
除非另有註明,否則本頁面中的內容是採用創用 CC 姓名標示 4.0 授權,程式碼範例則為阿帕契 2.0 授權。詳情請參閱《Google Developers 網站政策》。Java 是 Oracle 和/或其關聯企業的註冊商標。
上次更新時間:2025-08-19 (世界標準時間)。
-