Anda dapat membuat metrik kustom untuk mengajukan pemberitahuan atau memberikan informasi untuk memecahkan masalah terkait snapshot terjadwal.
Misalnya, untuk menyiapkan pemberitahuan kegagalan snapshot terjadwal, gunakan prosedur berikut:
- Buat filter log untuk mengambil peristiwa snapshot terjadwal.
- Buat metrik berdasarkan filter log yang menghitung kegagalan snapshot terjadwal.
- Buat kebijakan pemberitahuan untuk mengirim pemberitahuan saat terjadi kegagalan snapshot terjadwal.
Sebelum memulai
-
Jika Anda belum melakukannya, siapkan autentikasi.
Autentikasi memverifikasi identitas Anda untuk mengakses Google Cloud layanan dan API. Untuk menjalankan
kode atau sampel dari lingkungan pengembangan lokal, Anda dapat melakukan autentikasi ke
Compute Engine dengan memilih salah satu opsi berikut:
Select the tab for how you plan to use the samples on this page:
Console
When you use the Google Cloud console to access Google Cloud services and APIs, you don't need to set up authentication.
gcloud
-
Menginstal Google Cloud CLI. Setelah penginstalan, lakukan inisialisasi Google Cloud CLI dengan menjalankan perintah berikut:
gcloud initJika Anda menggunakan penyedia identitas (IdP) eksternal, Anda harus login ke gcloud CLI dengan identitas gabungan Anda terlebih dahulu.
- Set a default region and zone.
REST
Untuk menggunakan contoh REST API di halaman ini dalam lingkungan pengembangan lokal, Anda menggunakan kredensial yang Anda berikan ke gcloud CLI.
Menginstal Google Cloud CLI. Setelah penginstalan, lakukan inisialisasi Google Cloud CLI dengan menjalankan perintah berikut:
gcloud initJika Anda menggunakan penyedia identitas (IdP) eksternal, Anda harus login ke gcloud CLI dengan identitas gabungan Anda terlebih dahulu.
Untuk mengetahui informasi selengkapnya, lihat Melakukan autentikasi untuk menggunakan REST dalam dokumentasi autentikasi Google Cloud .
Peran dan izin yang diperlukan
Untuk mendapatkan izin yang Anda perlukan untuk membuat jadwal snapshot, minta administrator untuk memberi Anda peran IAM berikut pada project:
-
Compute Instance Admin (v1) (
roles/compute.instanceAdmin.v1) -
Untuk terhubung ke VM yang dapat dijalankan sebagai akun layanan:
Service Account User (v1) (
roles/iam.serviceAccountUser)
Untuk mengetahui informasi selengkapnya tentang pemberian peran, lihat Mengelola akses ke project, folder, dan organisasi.
Anda mungkin juga bisa mendapatkan izin yang diperlukan melalui peran kustom atau peran yang telah ditentukan lainnya.
Membuat filter log
Buat filter log untuk merekam peristiwa snapshot terjadwal.
Konsol
Di Google Cloud konsol, buka halaman Logging > Logs Explorer.
Di daftar Filter by label or text search, pilih Convert to advanced filter.

Ganti kolom filter dengan memasukkan teks berikut, dengan mengganti
PROJECT_IDdengan project ID Anda:resource.type="gce_disk" logName="projects/PROJECT_ID/logs/cloudaudit.googleapis.com%2Fsystem_event" protoPayload.methodName="ScheduledSnapshots" severity>"INFO"Klik Kirim Filter.
Membuat metrik
Setelah membuat filter log, buat metrik yang menghitung kegagalan snapshot terjadwal.
Konsol
Di halaman Logs Explorer, klik Create metric.
Di Metric Editor, masukkan berikut ini:
- Name:
scheduled_snapshot_failure_count. - Deskripsi:
count of scheduled snapshot failures. - Jenis:
Counter
- Name:
Di bagian Label, klik Tambahkan item, lalu masukkan berikut ini:
- Nama:
status - Deskripsi:
status of scheduled snapshot request - Jenis label:
String - Nama kolom:
protoPayload.response.status
- Nama:
Klik Selesai.
Klik Buat Metrik.
Buat kebijakan pemberitahuan
Setelah membuat metrik, buat kebijakan pemberitahuan untuk mengirim pemberitahuan saat terjadi kegagalan snapshot terjadwal.
Konsol
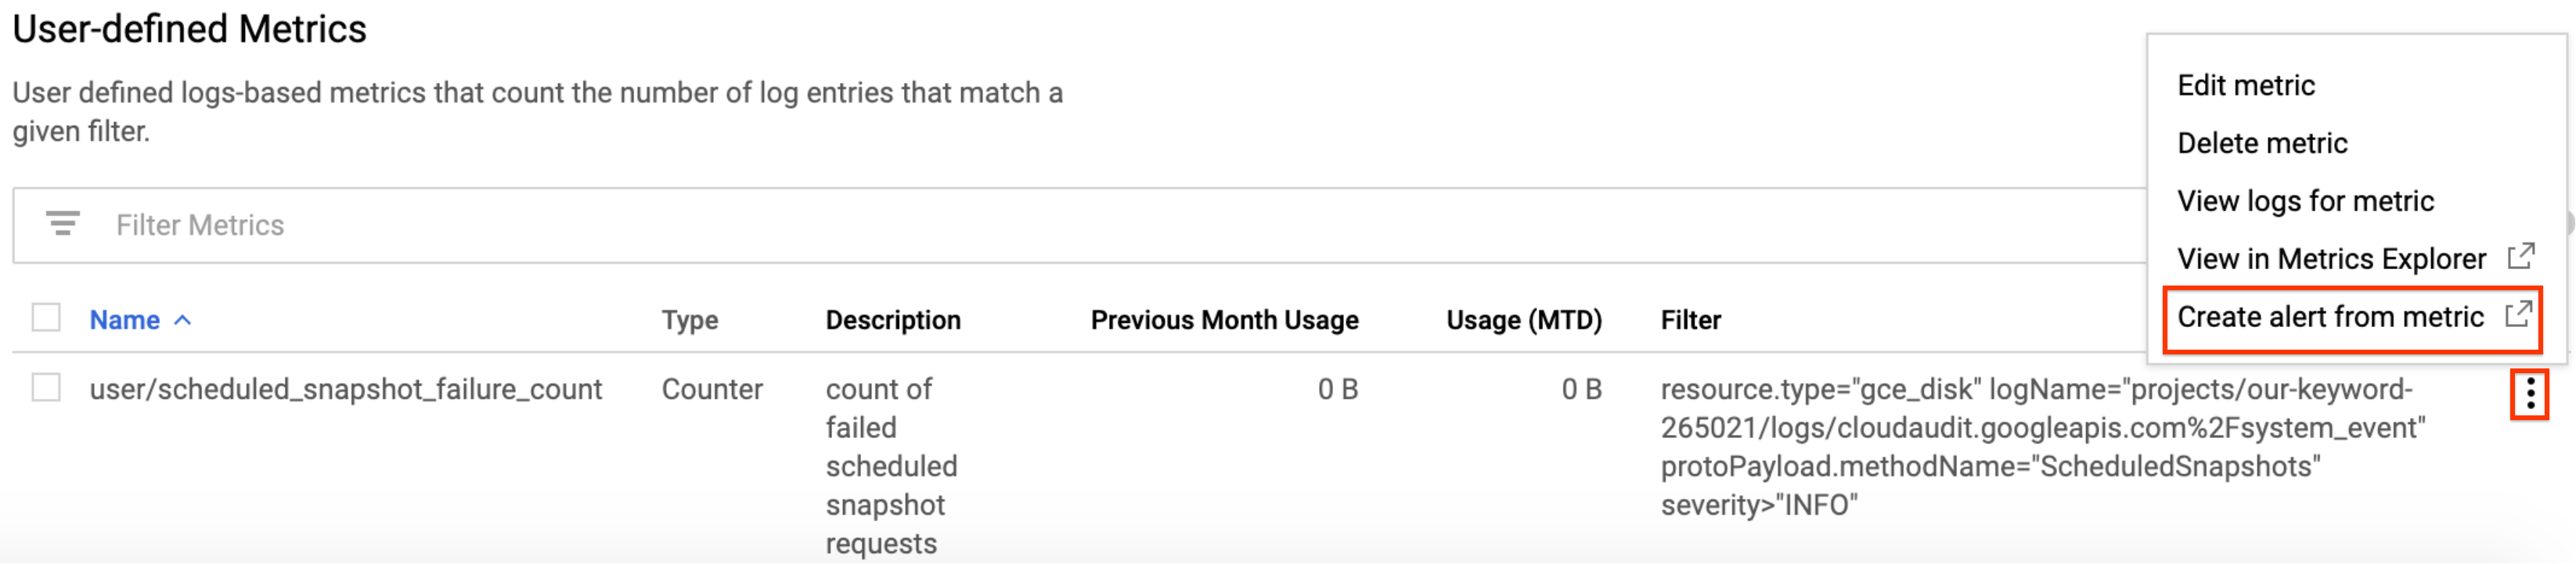
Di konsol Google Cloud , buka halaman Cloud Logging > Logs-based metrics.
Di bagian Metrik yang Ditentukan Pengguna, cari metrik baru Anda dengan nama
user/scheduled_snapshot_failure_count.Klik tombol menu Lainnya di baris ini, lalu pilih Buat pemberitahuan dari metrik. Halaman pembuatan kondisi kebijakan pemberitahuan akan terbuka.
Di panel Target, di bagian Agregator, pilih tidak ada.
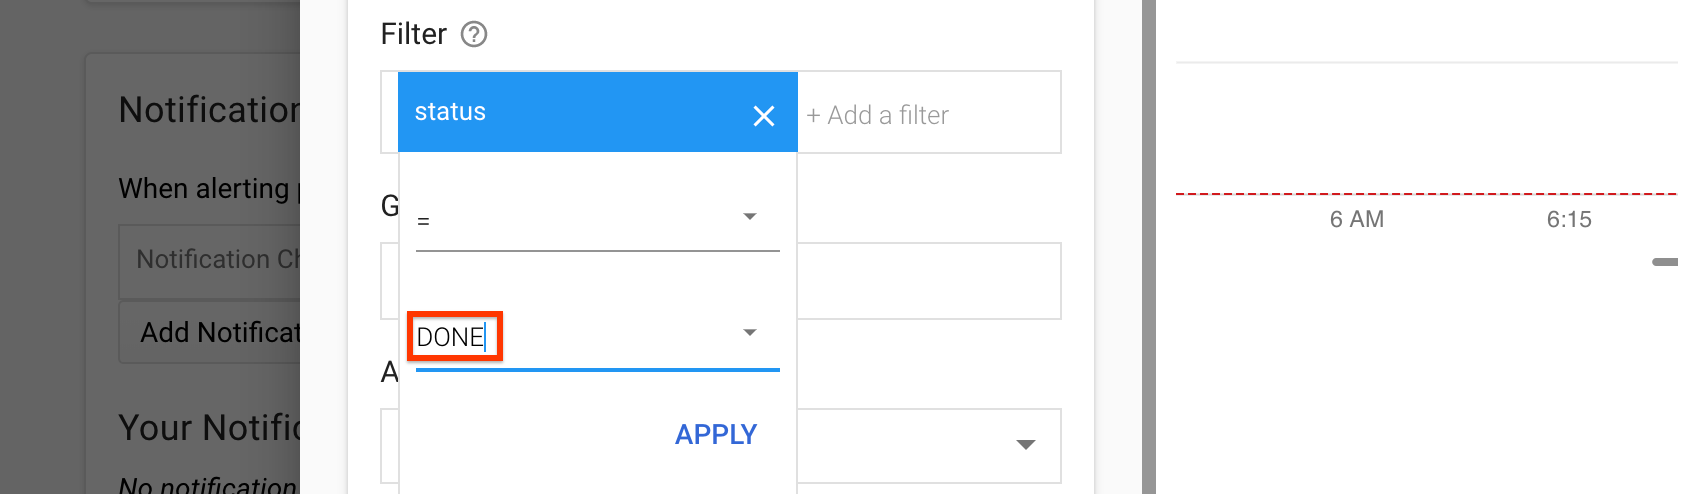
Di bagian Filter:
- Klik Tambahkan filter.
- Pilih status dari daftar.
- Di kolom Value, ketik DONE.
- Klik Terapkan.
Klik Tampilkan opsi lanjutan.
Di panel Agregasi lanjutan, klik daftar Penyelaras, lalu pilih sum.
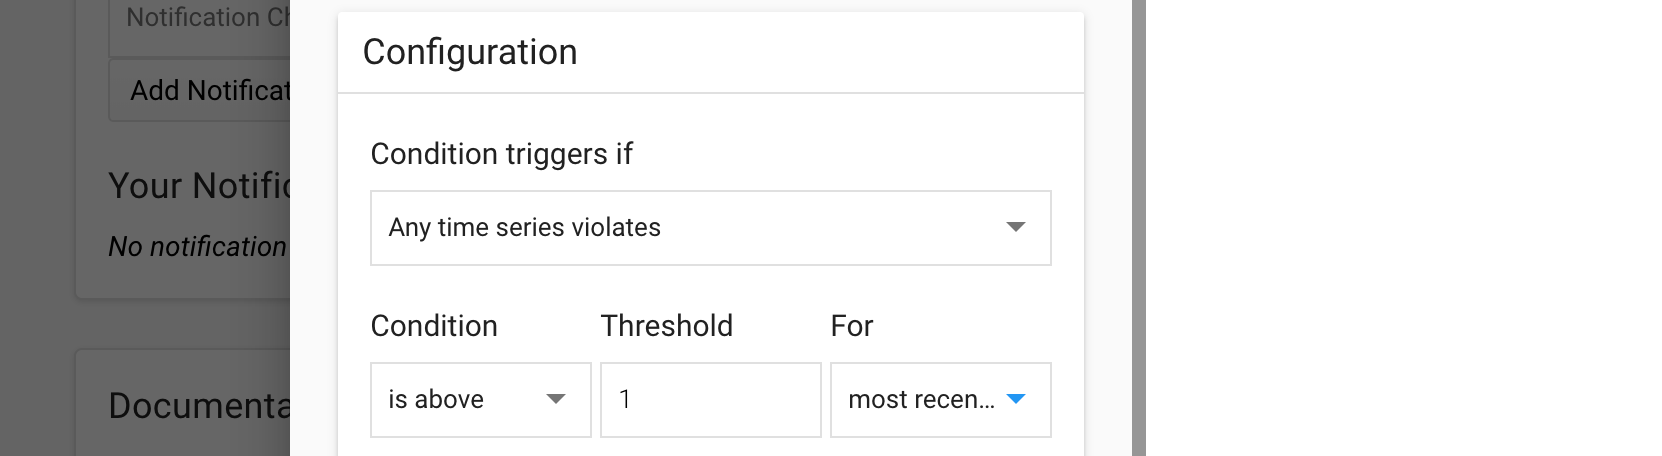
Di panel Configuration, pilih nilai berikut:
- Pemicu kondisi jika:
Any time series violates - Kondisi:
is above - Nilai minimum:
1 - Untuk:
most recent value
- Pemicu kondisi jika:
Klik Simpan.
Di halaman Create new alerting policy, masukkan nama kebijakan. Jika ingin, Anda dapat menambahkan saluran notifikasi dan dokumentasi untuk kebijakan ini.
Klik Simpan.
Langkah berikutnya
- Pelajari frekuensi jadwal snapshot, kebijakan retensi, dan aturan penamaan di Tentang jadwal snapshot untuk disk.
- Pelajari snapshot disk.
- Pelajari cara membuat snapshot terjadwal untuk disk.
- Pelajari cara melihat log.
Kecuali dinyatakan lain, konten di halaman ini dilisensikan berdasarkan Lisensi Creative Commons Attribution 4.0, sedangkan contoh kode dilisensikan berdasarkan Lisensi Apache 2.0. Untuk mengetahui informasi selengkapnya, lihat Kebijakan Situs Google Developers. Java adalah merek dagang terdaftar dari Oracle dan/atau afiliasinya.
Terakhir diperbarui pada 2025-10-19 UTC.
-