Puedes crear una métrica personalizada para generar alertas o proporcionar información para solucionar problemas relacionados con las instantáneas programadas.
Por ejemplo, para configurar una alerta de fallas de instantáneas programadas, hace el siguiente procedimiento:
- Crea un filtro de registro para capturar eventos de las instantáneas programadas.
- Crea una métrica basada en el filtro de registro que cuenta las fallas de las instantáneas programadas.
- Crea una política de alertas para enviar una alerta cuando se produzca una falla en las instantáneas programadas.
Antes de comenzar
-
Si aún no lo hiciste, configura la autenticación.
La autenticación verifica tu identidad para acceder a los servicios y las APIs de Google Cloud . Para ejecutar código o muestras desde un entorno de desarrollo local, puedes autenticarte en Compute Engine seleccionando una de las siguientes opciones:
Select the tab for how you plan to use the samples on this page:
Console
When you use the Google Cloud console to access Google Cloud services and APIs, you don't need to set up authentication.
gcloud
-
Instala Google Cloud CLI. Después de la instalación, inicializa Google Cloud CLI ejecutando el siguiente comando:
gcloud initSi usas un proveedor de identidad externo (IdP), primero debes acceder a gcloud CLI con tu identidad federada.
- Set a default region and zone.
REST
Para usar las muestras de la API de REST en esta página en un entorno de desarrollo local, debes usar las credenciales que proporciones a gcloud CLI.
Instala Google Cloud CLI. Después de la instalación, inicializa Google Cloud CLI ejecutando el siguiente comando:
gcloud initSi usas un proveedor de identidad externo (IdP), primero debes acceder a gcloud CLI con tu identidad federada.
Para obtener más información, consulta Autentícate para usar REST en la documentación de autenticación de Google Cloud .
Roles y permisos requeridos
Para obtener los permisos que necesitas para crear una programación de instantáneas, pídele a tu administrador que te otorgue los siguientes roles de IAM en el proyecto:
-
Administrador de instancias de Compute (v1) (
roles/compute.instanceAdmin.v1) -
Para conectarte a una VM que puede ejecutarse como una cuenta de servicio:
Usuario de cuenta de servicio (v1) (
roles/iam.serviceAccountUser)
Para obtener más información sobre cómo otorgar roles, consulta Administra el acceso a proyectos, carpetas y organizaciones.
También puedes obtener los permisos necesarios mediante roles personalizados o cualquier otro rol predefinido.
Crea un filtro de registro
Crea un filtro de registro para capturar eventos de las instantáneas programadas.
Console
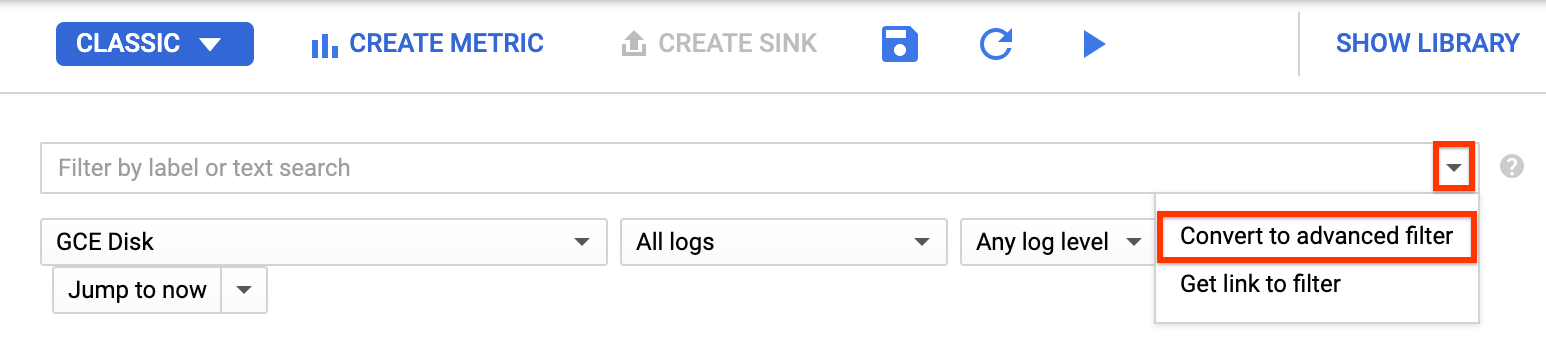
En la Google Cloud consola, ve a la página Logging > Explorador de registros.
En la lista Filtrar por etiqueta o búsqueda de texto, selecciona Convertir en filtro avanzado.
Para reemplazar el campo de filtro, ingresa el siguiente texto y reemplaza
PROJECT_IDpor el ID del proyecto:resource.type="gce_disk" logName="projects/PROJECT_ID/logs/cloudaudit.googleapis.com%2Fsystem_event" protoPayload.methodName="ScheduledSnapshots" severity>"INFO"Haga clic en Enviar filtro.
Crea una métrica
Después de crear el filtro de registro, crea una métrica que cuente las fallas de las instantáneas programadas.
Console
En la página Explorador de registros, haz clic en Crear métrica.
En el Editor de métricas, rellena los siguientes campos:
- Nombre:
scheduled_snapshot_failure_count. - Descripción:
count of scheduled snapshot failures. - Tipo:
Counter
- Nombre:
En Etiquetas, haz clic en Agregar elemento y, luego, ingresa lo siguiente información:
- Nombre:
status - Descripción:
status of scheduled snapshot request - Tipo de etiqueta:
String - Nombre del campo:
protoPayload.response.status
- Nombre:
Haz clic en Listo.
Haz clic en Crear métrica.
Crea una política de alertas
Después de crear la métrica, crea una política de alertas para enviar una alerta cuando se produzca una falla en las instantáneas programadas.
Console
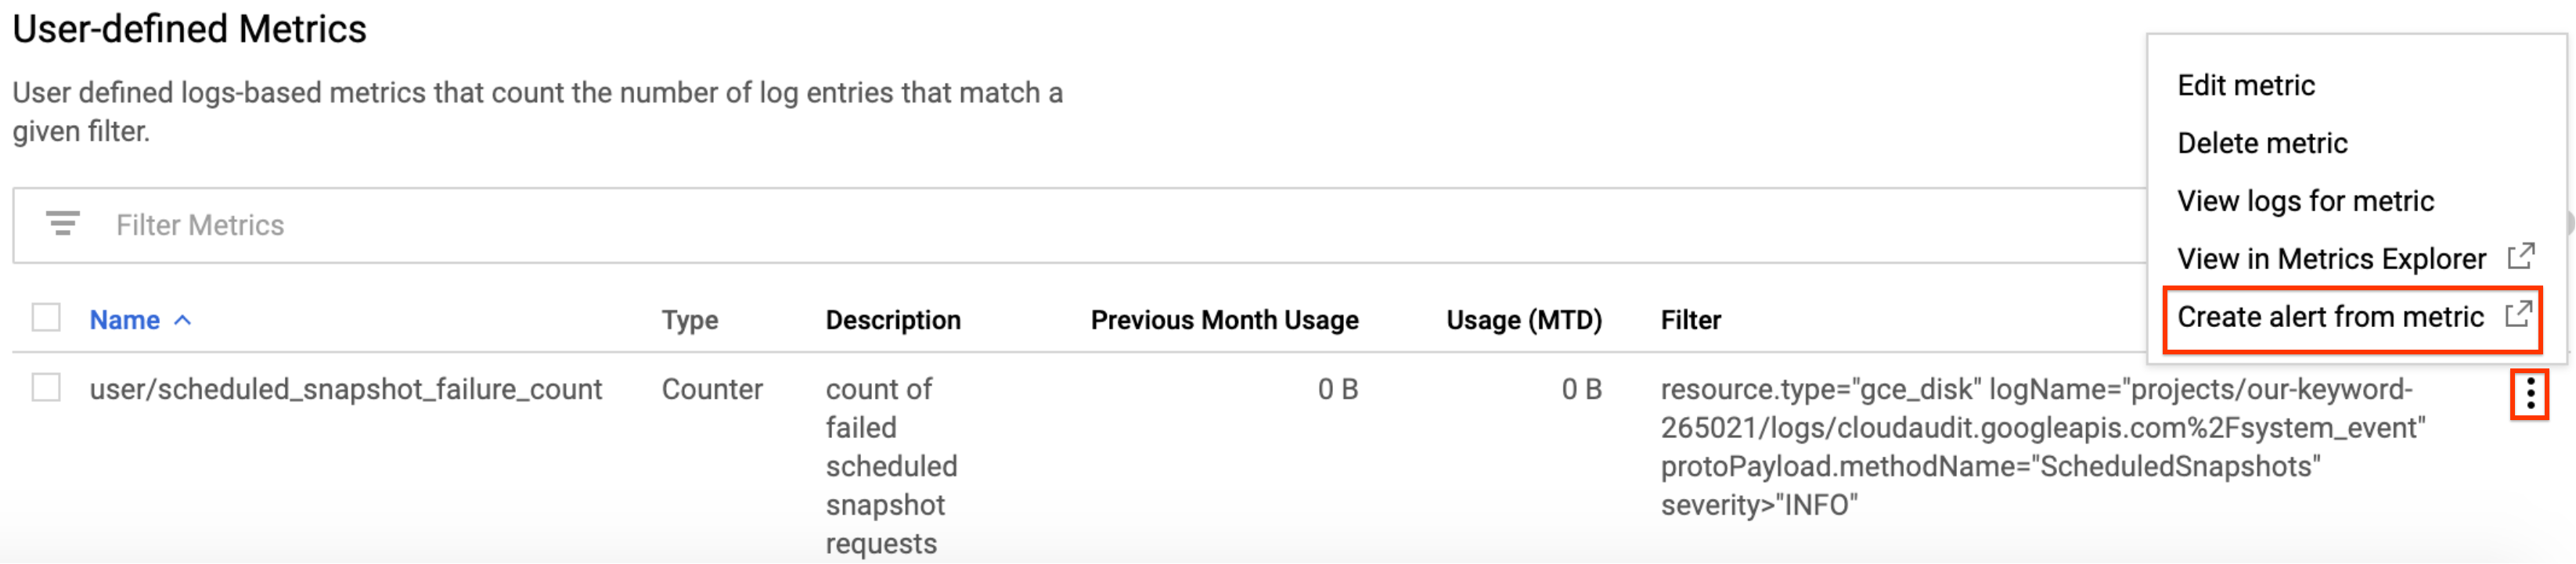
En la consola de Google Cloud , ve a la página Cloud Logging > Métricas basadas en registros.
En Métricas definidas por el usuario (User-defined Metrics), busca la nueva métrica llamada
user/scheduled_snapshot_failure_count.Haz clic en el botón de menú Más en esta fila y elige Crear alerta de métrica (Create alert from metric). Se abrirá la página de creación de condiciones de la política de alertas.
En el panel Destino en el Agregador, selecciona ninguno.
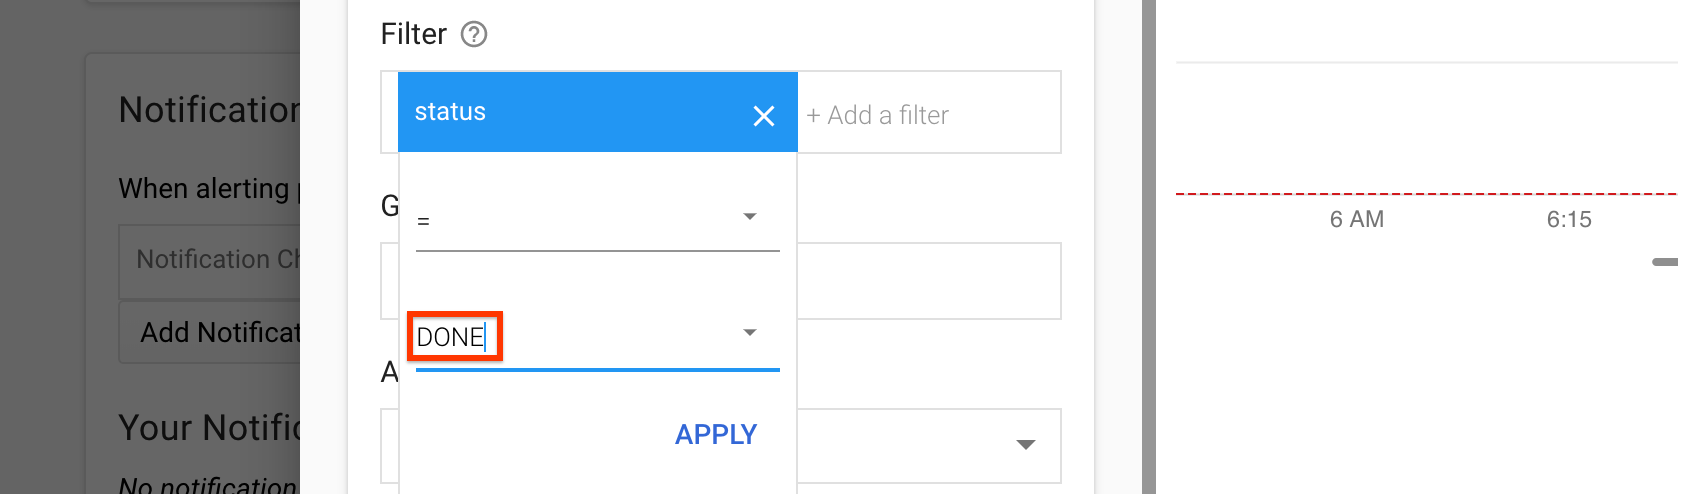
En Filtro, haz lo siguiente:
- Haz clic en Agregar un filtro.
- Selecciona un estado de la lista.
- En el campo Valor, escribe DONE (LISTO).
- Haz clic en Aplicar.
Haga clic en Show advanced options.
En el panel Agregación avanzada, haz clic en la lista Alineador y selecciona sum.
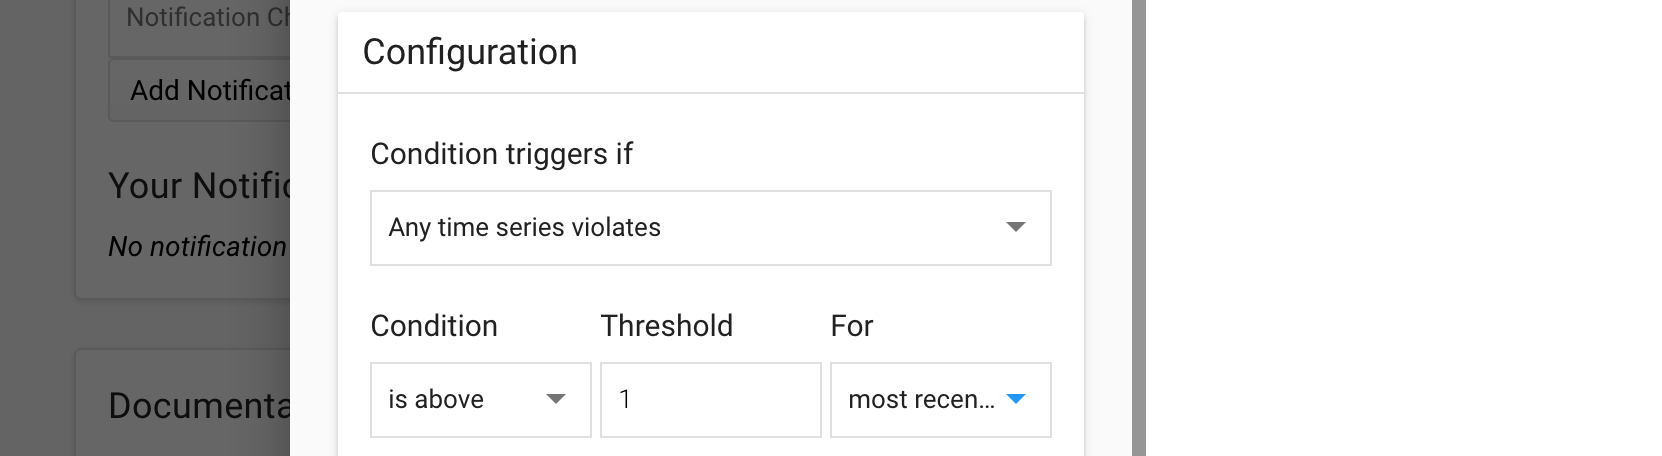
En el panel Configuración, selecciona los siguientes valores:
- Activadores de condición si:
Any time series violates - Condición:
is above - Umbral:
1 - Para::
most recent value
- Activadores de condición si:
Haz clic en Guardar.
En la página Crea una política de alertas nueva, ingresa el nombre de una política. De forma opcional, puedes agregar canales de notificaciones y documentación para esta política.
Haz clic en Guardar.
¿Qué sigue?
- Obtén más información sobre las frecuencias de programación de instantáneas, las políticas de retención y las reglas de nombres en Información sobre las programaciones de instantáneas para discos.
- Obtén información sobre las instantáneas de discos.
- Obtén información sobre cómo crear instantáneas programadas para discos.
- Obtén más información acerca de cómo ver registros.
Salvo que se indique lo contrario, el contenido de esta página está sujeto a la licencia Atribución 4.0 de Creative Commons, y los ejemplos de código están sujetos a la licencia Apache 2.0. Para obtener más información, consulta las políticas del sitio de Google Developers. Java es una marca registrada de Oracle o sus afiliados.
Última actualización: 2025-10-19 (UTC)
-