Visualize geospatial data
Geospatial analytics lets you visualize geographic location data by using the following:
BigQuery Studio
BigQuery Studio offers an integrated geography data viewer. When your query
results contain one or more GEOGRAPHY type columns, you can view the results
in an interactive map.
To view the map, in the Query results pane, click the Visualization tab.
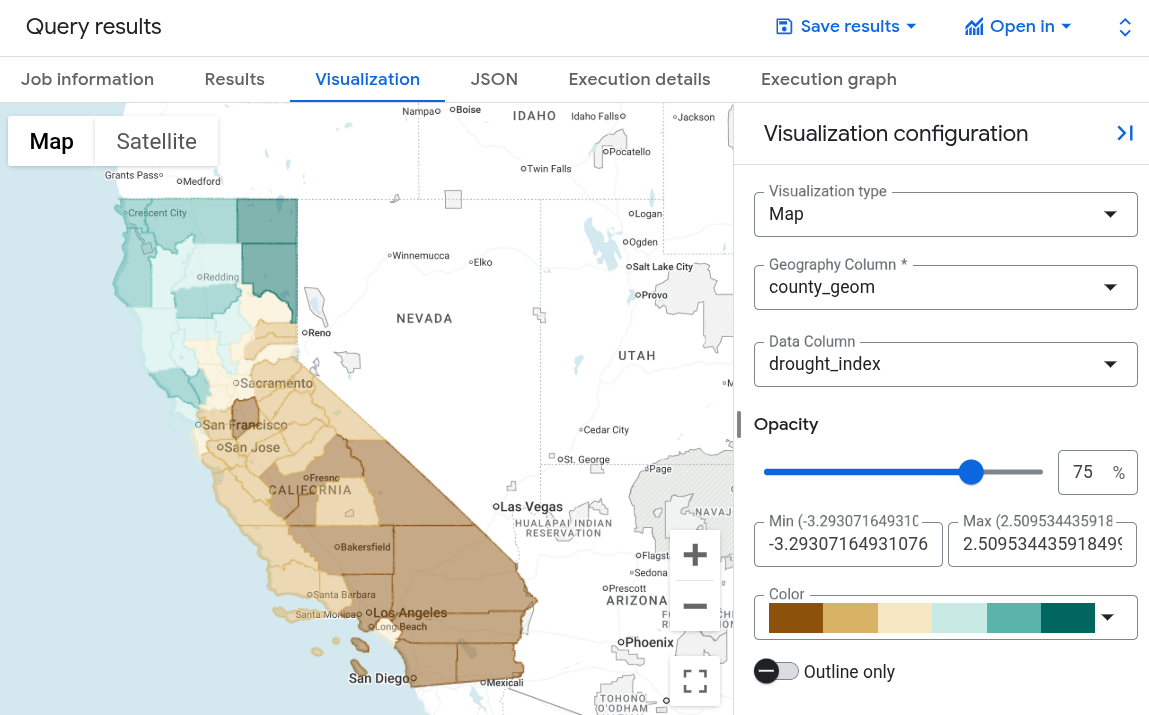
Visualization in BigQuery is ideal for quick inspections and iterative query development. You can visually confirm data alignment with expectations, identify outliers, and assess the correctness of your spatial data. It's also useful for ad hoc analysis to explore results and derive immediate conclusions from geospatial queries.
To see an example of how to use the integrated geography viewer, see Get started with geospatial analytics.
BigQuery Studio limitations
- You can only visualize one
GEOGRAPHYcolumn at a time. - Performance is subject to browser capabilities and isn't intended for rendering extremely large or complex datasets. BigQuery renders up to approximately one million vertices, 20,000 rows, or 128 MB of results.
Looker Studio
Looker Studio is a no-cost, self-serve reporting and data visualization
service from Google Marketing Platform that connects to BigQuery
and hundreds of other data sources. The service includes support for a variety
of geographic field types
and choropleth maps of
BigQuery GEOGRAPHY polygons. With
Google Maps-based visualization,
you can visualize and interact with your geographic data just as you do with
Google Maps: pan around, zoom in, and pop into Street View.

For a walkthrough of geospatial analytics in Looker Studio, see
Visualize BigQuery GEOGRAPHY polygons with Looker Studio.
BigQuery Geo Viz
BigQuery Geo Viz is a web tool for visualization of geospatial data in BigQuery using Google Maps APIs. You can run a SQL query and display the results on an interactive map. Flexible styling features let you analyze and explore your data.
BigQuery Geo Viz is not a fully featured geospatial analytics visualization tool. Geo Viz is a lightweight way to visualize the results of a geospatial analytics query on a map, one query at a time.
To see an example of using Geo Viz to visualize geospatial data, see Get started with geospatial analytics.
To explore Geo Viz, go to the Geo Viz web tool:
Geo Viz limitations
- Geo Viz supports geometry inputs (points, lines, and polygons) that are
retrieved as a
GEOGRAPHYcolumn. You can use BigQuery's geography functions to convert latitude and longitude toGEOGRAPHY. - The number of results that Geo Viz can display on a map is limited by browser
memory. You can lower the resolution and reduce size of geospatial data
returned from the query by using
ST_Simplifyfunction. - Real-time, interactive analysis is handled locally by your browser and is subject to your browser's capabilities.
- Geo Viz supports sharing visualizations only with users authorized to execute queries in the same BigQuery project.
- Geo Viz does not support downloading a visualization for offline editing.
Colab notebooks
You can also perform geospatial visualizations in Colab notebooks. For a tutorial on building a Colab notebook to visualize data, see BigQuery geospatial visualization in Colab.
To view and run a prebuilt notebook, see BigQuery geospatial visualization in Colab in GitHub.
Google Earth Engine
You can also visualize geospatial data using Google Earth Engine. To use Google Earth Engine, export your BigQuery data to Cloud Storage and then import it into Google Earth Engine. You can use the Google Earth Engine tools to visualize your data.
For more information on using Google Earth Engine, see the: