地理空間データを可視化する
地理空間分析では、以下を使用して地理的位置データを可視化できます。
BigQuery Studio
BigQuery Studio には、地理データビューアが統合されています。クエリ結果に GEOGRAPHY 型の列が 1 つ以上含まれている場合は、結果をインタラクティブな地図で表示できます。地図を表示するには、[クエリ結果] ペインで [可視化] タブをクリックします。
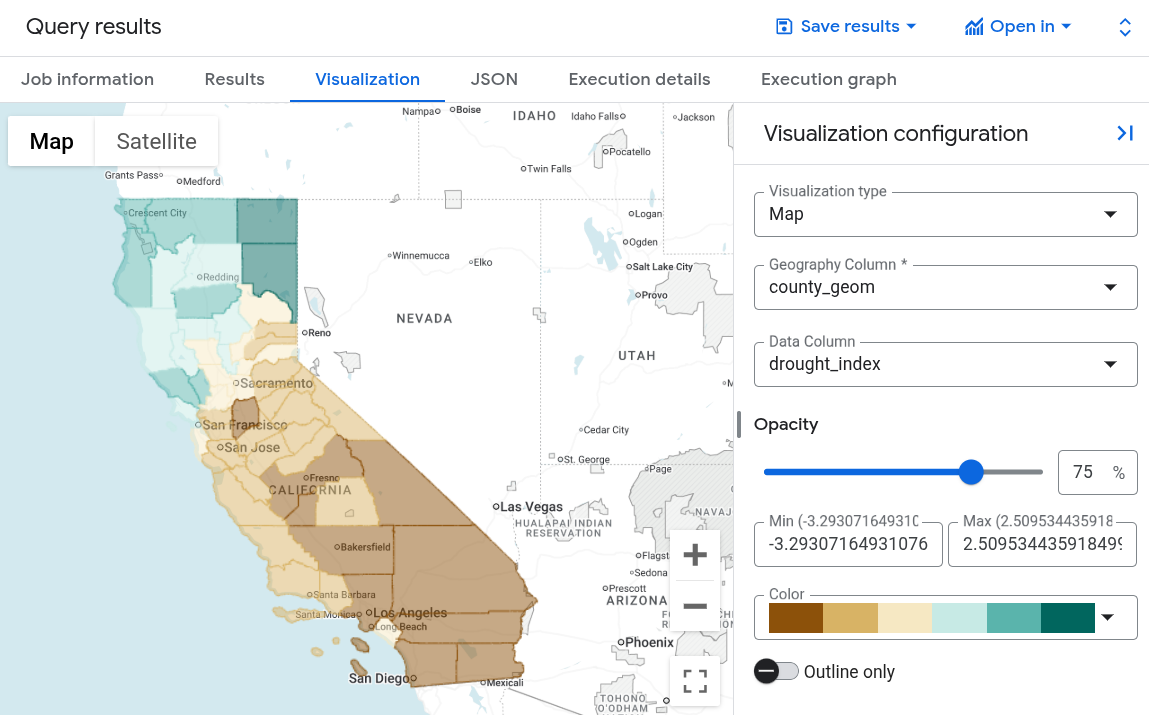
BigQuery での可視化は、迅速な検査や反復的なクエリ開発に最適です。期待値とのデータの一致を視覚的に確認し、外れ値を特定して、空間データの正確性を評価できます。また、結果を調べて地理空間クエリからすぐに結論を導き出すアドホック分析にも役立ちます。
統合地理ビューアの使用例については、地理空間分析スタートガイドをご覧ください。
BigQuery Studio の制限事項
- 一度に可視化できる
GEOGRAPHY列は 1 つだけです。 - パフォーマンスはブラウザの性能に左右されます。極めて大規模または複雑なデータセットのレンダリングには向いていません。BigQuery でレンダリングできる上限は、頂点では約 100 万個、行では 20,000 行、結果では 128 MB です。
Looker Studio
Looker Studio は、Google マーケティング プラットフォーム(BigQuery や他の何百ものデータソースに接続)が提供する、セルフサービスのレポート作成やデータの可視化が行える料金不要のサービスです。このサービスには、さまざまな地理フィールド タイプと、BigQuery GEOGRAPHY ポリゴンの階級区分図のサポートが含まれています。Google マップをベースにした可視化により、Google マップと同じように地理的データを可視化し、周辺の移動や拡大、ストリートビューへのポップインなどの操作を行うことができます。
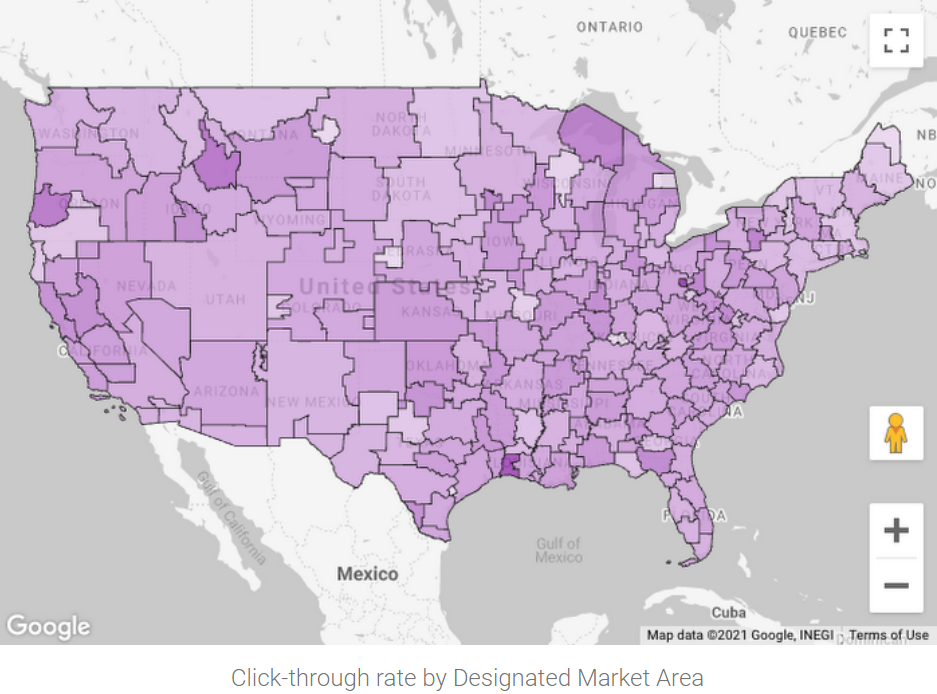
Looker Studio の地理空間分析の詳細については、Looker Studio を使用して BigQuery GEOGRAPHY ポリゴンを可視化するをご覧ください。
BigQuery Geo Viz
BigQuery Geo Viz は、Google Maps API を使用して BigQuery の地理空間データを可視化するためのウェブツールです。SQL クエリを実行し、インタラクティブな地図に結果を表示できます。柔軟なスタイル設定機能を備えており、データの分析と探索を行えます。
BigQuery Geo Viz は、機能が完備された地理空間分析可視化ツールではありません。Geo Viz は地図上で可視化するための軽量な方法で、地理空間分析クエリの結果を一度に 1 クエリずつ可視化できます。
Geo Viz を使用して地理空間データを可視化する例については、地理空間分析スタートガイドをご覧ください。
Geo Viz を使ってみるには、Geo Viz ウェブツールにアクセスしてください。
Geo Viz の制限
- Geo Viz は、
GEOGRAPHY列として取得されたジオメトリ入力(点、線、ポリゴン)をサポートしています。BigQuery の地理関数を使用して、緯度と経度をGEOGRAPHYに変換できます。 - Geo Viz が地図上に表示できる結果の数は、ブラウザのメモリによって制限されます。
ST_Simplify関数を使用して、クエリから返される地理空間データの解像度を下げ、サイズを小さくできます。 - リアルタイムかつインタラクティブな分析はブラウザによってローカルで処理されるため、ブラウザの機能の影響を受けます。
- Geo Viz では、同じ BigQuery プロジェクトでクエリを実行する権限を持つユーザーとのみ可視化の共有がサポートされています。
- Geo Viz では、可視化をオフライン編集用にダウンロードすることはサポートされていません。
Colab ノートブック
Colab ノートブックで、地理空間の可視化を行うこともできます。データを可視化するための Colab ノートブックの作成に関するチュートリアルは、BigQuery Geospatial Visualization in Colab をご覧ください。
事前作成済みのノートブックを表示して実行する方法は、GitHub の BigQuery Geospatial Visualization in Colab をご覧ください。
Google Earth Engine
Google Earth Engine を使用して地理空間データを可視化することもできます。Google Earth Engine を使用するには、BigQuery データを Cloud Storage にエクスポートし、それを Google Earth Engine にインポートします。Google Earth Engine ツールを使用してデータを可視化できます。
Google Earth Engine の使用方法について詳しくは、以下をご覧ください。