Mantenha tudo organizado com as coleções
Salve e categorize o conteúdo com base nas suas preferências.
Configurar alertas com consultas programadas
Neste documento, descrevemos como configurar um alerta usando uma consulta programada do BigQuery. Essa abordagem é compatível com casos de uso personalizados definidos pela lógica de consulta.
Antes de começar
Antes de usar o Cloud Monitoring, verifique se você tem:
Crie e execute uma consulta SQL no BigQuery que gere a saída do seu alerta. A consulta captura a lógica que você quer monitorar.
Para mais informações, consulte Executar uma consulta.
Configurar uma consulta programada
É possível programar consultas para serem executadas de forma recorrente, de cada 15 minutos a cada vários meses. Você pode escrever qualquer consulta nos seus buckets de registros. Para mais informações, consulte Como programar consultas.
Noções básicas sobre a métrica de contagem de linhas
As consultas programadas criam automaticamente uma métrica no Cloud Monitoring. Essa métrica registra o número de linhas que a consulta SQL retornou durante a última avaliação. É possível criar uma política de alertas que monitore essa métrica de contagem de linhas no Monitoring.
A métrica a seguir é um indicador que contém a contagem de linhas mais recente de uma consulta programada:
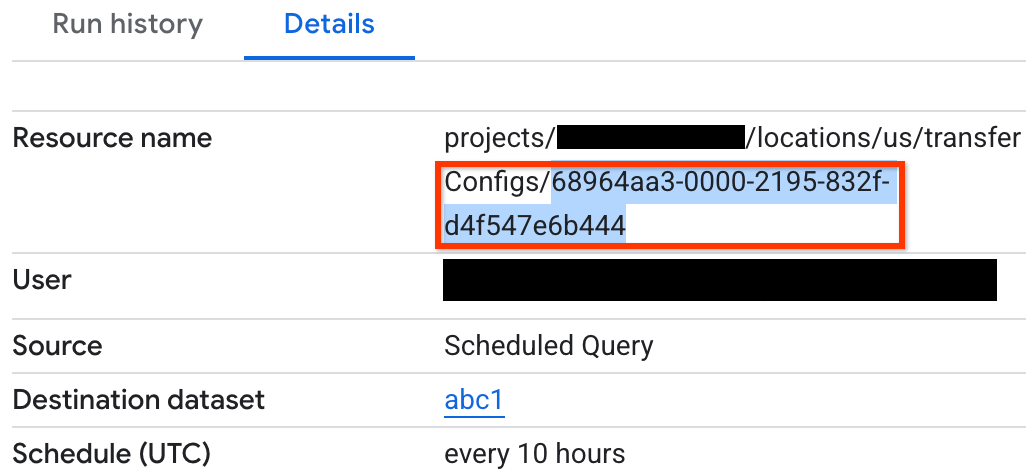
Todas as consultas programadas gravam a contagem de linhas nessa métrica usando rótulos diferentes. Você precisa do rótulo config_id ao definir uma política de alertas. Para encontrar o rótulo config_id, siga estas etapas:
No console Google Cloud , acesse a página Consultas programadas:
Se você usar a barra de pesquisa para encontrar essa página, selecione o resultado com o subtítulo Monitoring.
Clique em Criar política.
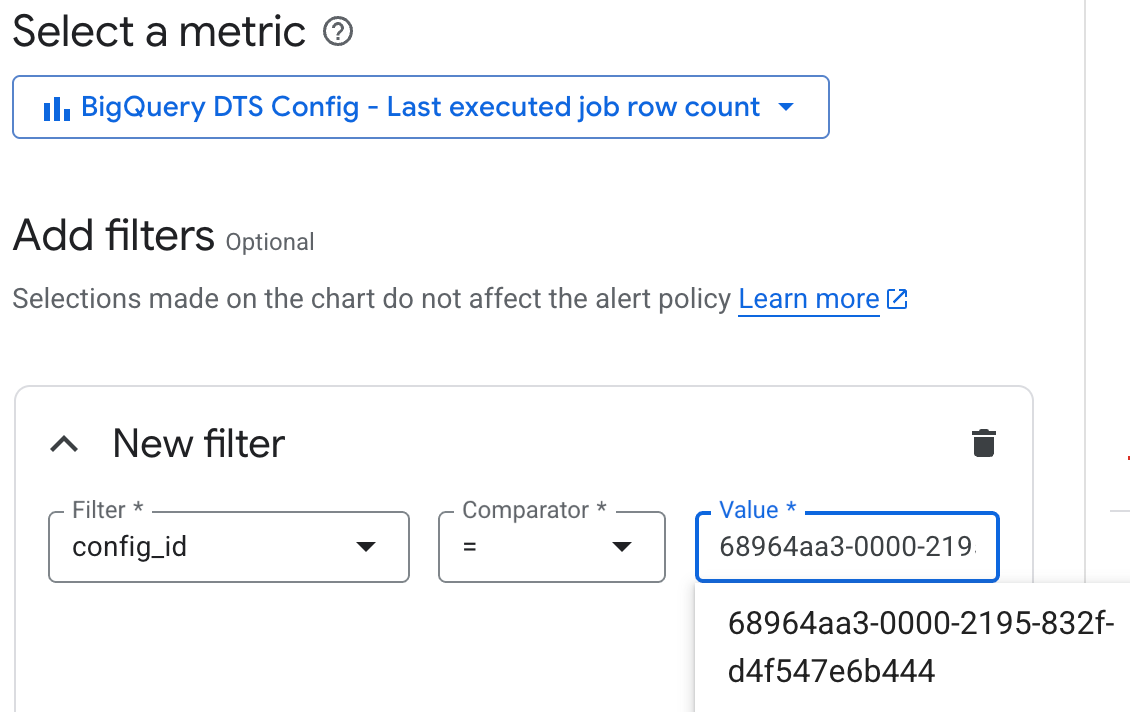
Selecione a métrica de contagem de linhas para a consulta programada. No menu Selecionar uma métrica, clique em BigQuery DTS Config > Transfer_config > Contagem de linhas do último job executado.
Em Adicionar filtros, clique em Adicionar um filtro.
No menu Filtro, selecione config_id.
No menu Valor, selecione o config_id da consulta programada para
criar um alerta:
Se você não definir um filtro, o alerta vai testar a saída de todas as consultas programadas. Para encontrar o config_id da sua consulta programada, consulte
Entender a métrica de contagem de linhas.
Mantenha as configurações padrão de Transformar dados e clique em Próxima.
Em Tipos de condição, selecione Limite.
Selecione a condição desejada. Por exemplo, para acionar quando a consulta
retornar linhas, defina a seguinte condição:
Em Gatilho de alerta, selecione Qualquer série temporal viola.
Em Posição do limite, selecione Acima do limite.
Em Valor do limite, insira 0.
Mantenha as Opções avançadas padrão e clique em Próxima.
Opcional: para configurar notificações para seu alerta, clique no botão
Usar canal de notificação e defina os canais e a linha de assunto
das notificações. Também é possível definir notificações para o encerramento de incidentes.
Se você não quiser receber notificações, desmarque a opção Usar canal de notificação.
Opcional: se você tiver muitas políticas de alerta, anote os rótulos para indicar que eles são derivados de consultas programadas.
Opcional: no campo Documentação, adicione links que ajudem a
interpretar o alerta. Por exemplo, você pode adicionar um link para a página do Logs Explorer com uma consulta semelhante para analisar os dados que geraram o alerta. Também é possível criar um link para a página de detalhes da consulta de programação específica.
Em Nomear a política de alertas, digite um nome para o alerta.
Clique em Criar política.
Limitações
As políticas de alertas para consultas programadas estão sujeitas às seguintes limitações:
A frequência de execução de consultas programadas e o atraso na ingestão afetam o tempo total entre a emissão do registro e o alerta. Por exemplo, se a consulta for executada a cada 30 minutos e você adicionar um atraso de 15 minutos para a ingestão, o alerta será disparado aproximadamente 15 minutos depois que uma entrada de registro ofensiva for emitida. Em alguns casos, pode levar até 45 minutos.
A configuração entre uma consulta programada e uma política de alerta não é vinculada
nem sincronizada. Editar a configuração em um lugar pode interromper a relação que ativa a função de alerta.
[[["Fácil de entender","easyToUnderstand","thumb-up"],["Meu problema foi resolvido","solvedMyProblem","thumb-up"],["Outro","otherUp","thumb-up"]],[["Difícil de entender","hardToUnderstand","thumb-down"],["Informações incorretas ou exemplo de código","incorrectInformationOrSampleCode","thumb-down"],["Não contém as informações/amostras de que eu preciso","missingTheInformationSamplesINeed","thumb-down"],["Problema na tradução","translationIssue","thumb-down"],["Outro","otherDown","thumb-down"]],["Última atualização 2025-09-04 UTC."],[],[],null,["# Set up alerts with scheduled queries\n====================================\n\nThis document describes how to set up an alert using a BigQuery\nscheduled query. This approach supports custom use cases defined by query logic.\n\nBefore you begin\n----------------\n\nBefore you use Cloud Monitoring, ensure that you have the following:\n\n- A Cloud Billing account.\n- A BigQuery project with billing enabled.\n\nOne way to ensure that you have both is to complete the\n[Quickstart using the Google Cloud console](/bigquery/docs/quickstarts/query-public-dataset-console#before-you-begin).\n\nCreate a SQL query\n------------------\n\nCreate and run a SQL query in BigQuery that generates the\noutput for your alert. The query captures the logic that you want to monitor.\nFor more information, see [Run a query](/bigquery/docs/running-queries).\n\nSet up a scheduled query\n------------------------\n\nYou can schedule queries to run on a recurring basis, from every 15 minutes\nto every several months. You can write any query over your log buckets. For more\ninformation, see [Scheduling queries](/bigquery/docs/scheduling-queries).\n\n### Understand the row count metric\n\nScheduled queries automatically create a metric in Cloud Monitoring. This\nmetric records the number of rows that the SQL query returned during its last\nevaluation. You can create an alert policy that monitors this row count metric\nin Monitoring.\n\nThe following [metric](/monitoring/api/metrics_gcp_a_b#gcp-bigquerydatatransfer)\nis a gauge that contains the most recent row count of a scheduled query:\n\n`bigquerydatatransfer.googleapis.com/transfer_config/last_execution_job_rows`\n\nAll scheduled queries write their row count to this metric, using different labels. You need the `config_id` label when you define an alert policy. To find the `config_id` label, follow these steps:\n\n1. In Google Cloud console, go to the **Scheduled queries** page:\n\n [Go to Scheduled queries](https://console.cloud.google.com/bigquery/scheduled-queries)\n2. Click the scheduled query for which you want to create an alert.\n\n3. Go to the **Details** tab.\n\n4. Check the last string in **Resource name**, as shown in the following\n screenshot:\n\n| **Note:** The last known value for the row count repeats continuously for 5 weeks. If you deactivate a scheduled query or the query fails, the metric remains constant at its last known value for 35 days. After 35 days, the metric disappears.\n\nIf a problem occurs with the scheduled query, an error message appears in the\n**Run history** tab of your scheduled query.\n\n### Monitor scheduled queries\n\nMonitor scheduled queries to ensure successful executions:\n\n- Look for errors in the **Run history** tab of the scheduled query.\n- Check the final status of each scheduled execution that is stored in the `completion_state` field of the [`bigquerydatatransfer.googleapis.com/transfer_config/completed_runs` metric](/monitoring/api/metrics_gcp_a_b#gcp-bigquerydatatransfer).\n- Look for errors in the [BigQuery Data Transfer Service logs](/bigquery/docs/dts-monitor#logs).\n\nCreate an alert policy\n----------------------\n\nUse a [metric-threshold alert](/monitoring/alerts/using-alerting-ui) to detect\nwhen the number of rows returned by the scheduled query differs from a threshold.\n\nTo set up an alert on the number of rows a scheduled query returns, follow these\nsteps:\n\n1. In the Google Cloud console, go to the\n *notifications* **Alerting** page:\n\n [Go to **Alerting**](https://console.cloud.google.com/monitoring/alerting)\n\n \u003cbr /\u003e\n\n If you use the search bar to find this page, then select the result whose subheading is\n **Monitoring**.\n2. Click **Create policy**.\n\n3. Select the row count metric for the scheduled query. In the\n **Select a metric** menu, click **BigQuery DTS Config \\\u003e Transfer_config \\\u003e Last executed job row count**.\n\n4. In **Add filters** , click **Add a filter**.\n\n5. In the **Filter** menu, select **config_id**.\n\n6. In the **Value** menu, select the `config_id` of the scheduled query for\n which you want to create an alert:\n\n If you don't set a filter, your alert tests the output of every scheduled\n query. To find the `config_id` of your scheduled query, see\n [Understand the row count metric](#understand_the_row_count_metric).\n7. Keep the default **Transform data** settings and click **Next**.\n\n8. For **Condition types** , select **Threshold**.\n\n9. Select the condition that you want. For example, to trigger when the query\n returns any rows, set the following condition:\n\n 1. For **Alert trigger** , select **Any time series violates**.\n 2. For **Threshold position** , select **Above threshold**.\n 3. In **Threshold value** , enter `0`.\n10. Keep the default **Advanced Options** and click **Next**.\n\n11. Optional: To configure notifications for your alert, click the\n **Use notification channel** toggle, and then set channels and subject line\n for your notifications. You can also set notifications for incident closure.\n\n If you don't want notifications, deselect the **Use notification channel**\n toggle.\n12. Optional: If you have many alert policies, you can [annotate labels](/monitoring/alerts/labels)\n on them to indicate that they are derived from scheduled queries.\n\n13. Optional: In the **Documentation** field, you can add links that help to\n interpret the alert. For example, you can add a link to the **Logs Explorer**\n page with a similar query, so that you can explore the data that raised the\n alert. You can also link to the specific schedule query's details page.\n\n14. In **Name the alert policy**, enter a name for your alert.\n\n15. Click **Create Policy**.\n\nLimitations\n-----------\n\nAlert policies for scheduled queries are subject to the following limitations:\n\n- Scheduled query execution frequency and ingestion delay impact the total time from log emission to alert. For example, if your query runs every 30 minutes and you add a 15-minute lag for ingestion delay, your alert fires approximately 15 minutes after an offending log entry is emitted. In some cases, it might take up to 45 minutes.\n- The configuration between a scheduled query and an alert policy isn't linked or synchronized. Editing the configuration in one place might break the relationship that enables the alert function.\n\nWhat's next\n-----------\n\n- Learn how to create and run [scheduled queries](/bigquery/docs/scheduling-queries)."]]