This page describes how to create, manage, and interpret the results of Model Monitoring jobs for models deployed to online prediction endpoints. Vertex AI Model Monitoring supports feature skew and drift detection for categorical and numerical input features.
When a model is deployed in production with Model Monitoring enabled, incoming prediction requests are logged in a BigQuery table in your Google Cloud project. The input feature values contained in the logged requests are then analyzed for skew or drift.
You can enable skew detection if you provide the original training dataset for your model; otherwise, you should enable drift detection. For more information, see Introduction to Vertex AI Model Monitoring.
Prerequisites
To use Model Monitoring, complete the following:
Have an available model in Vertex AI that is either a tabular AutoML or imported tabular custom training type.
- If you are using an existing endpoint, make sure all the models deployed under the endpoint are tabular AutoML or imported custom training types.
If you are enabling skew detection, upload your training data to Cloud Storage or BigQuery and obtain the URI link to the data. For drift detection, training data is not required.
Optional: For custom-trained models, upload the analysis instance schema for your model to Cloud Storage. Model Monitoring requires the schema to begin the monitoring process and calculate the baseline distribution for skew detection. If you don't provide the schema during job creation, the job remains in a pending state until Model Monitoring can automatically parse the schema from the first 1000 prediction requests the model receives.
Create a Model Monitoring job
To set up either skew detection or drift detection, create a model deployment monitoring job:
Console
To create a model deployment monitoring job using the Google Cloud console, create an endpoint:
In the Google Cloud console, go to the Vertex AI Endpoints page.
Click Create Endpoint.
In the New endpoint pane, name your endpoint and set a region.
Click Continue.
In the Model name field, select an imported custom training or tabular AutoML model.
In the Version field, select a version for your model.
Click Continue.
In the Model monitoring pane, make sure Enable model monitoring for this endpoint is toggled on. Any monitoring settings you configure apply to all models deployed to the endpoint.
Enter a Monitoring job display name.
Enter a Monitoring window length.
For Notification emails, enter one or more comma-separated email addresses to receive alerts when a model exceeds an alerting threshold.
(Optional) For Notification channels, add Cloud Monitoring channels to receive alerts when a model exceeds an alerting threshold. You can select existing Cloud Monitoring channels or create a new one by clicking Manage notification channels. The Console supports PagerDuty, Slack, and Pub/Sub notification channels.
Enter a Sampling rate.
Optional: Enter the Prediction input schema and Analysis input schema.
Click Continue. The Monitoring objective pane opens, with options for skew or drift detection:
Skew detection
- Select Training-serving skew detection.
- Under Training data source, provide a training data source.
- Under Target column, enter the column name from the training data that the model is trained to predict. This field is excluded from the monitoring analysis.
- Optional: Under Alert thresholds, specify thresholds at which to trigger alerts. For information about how to format the thresholds, hold the pointer over the Help icon.
- Click Create.
Drift detection
- Select Prediction drift detection.
- Optional: Under Alert thresholds, specify thresholds at which to trigger alerts. For information about how to format the thresholds, hold the pointer over the Help icon.
- Click Create.
gcloud
To create a model deployment monitoring job using the gcloud CLI, first deploy your model to an endpoint:
A monitoring job configuration applies to all deployed models under an endpoint.
Run the gcloud ai model-monitoring-jobs create command.
gcloud ai model-monitoring-jobs create \
  --project=PROJECT_ID \
  --region=REGION \
  --display-name=MONITORING_JOB_NAME \
  --emails=EMAIL_ADDRESS_1,EMAIL_ADDRESS_2 \
  --endpoint=ENDPOINT_ID \
  [--feature-thresholds=FEATURE_1=THRESHOLD_1, FEATURE_2=THRESHOLD_2] \
  [--prediction-sampling-rate=SAMPLING_RATE] \
  [--monitoring-frequency=MONITORING_FREQUENCY] \
  [--analysis-instance-schema=ANALYSIS_INSTANCE_SCHEMA] \
  --target-field=TARGET_FIELD \
  --bigquery-uri=BIGQUERY_URI
where:
PROJECT_ID is the ID of your Google Cloud project. For example,
my-project.REGION is the location for your monitoring job. For example,
us-central1.MONITORING_JOB_NAME is the name of your monitoring job. For example,
my-job.EMAIL_ADDRESS is the email address where you want to receive alerts from Model Monitoring. For example,
example@example.com.ENDPOINT_ID is the ID of the endpoint under which your model is deployed. For example,
1234567890987654321.Optional: FEATURE_1=THRESHOLD_1 is the alerting threshold for each feature you want to monitor. For example, if you specify
Age=0.4, Model Monitoring logs an alert when the statistical distance between the input and baseline distributions for theAgefeature exceeds 0.4. By default, every categorical and numerical feature is monitored with threshold values of 0.3.Optional: SAMPLING_RATE is the fraction of the incoming prediction requests you want to log. For example,
0.5. If not specified, Model Monitoring logs all prediction requests.Optional: MONITORING_FREQUENCY is the frequency at which you want the monitoring job to run on recently logged inputs. The minimum granularity is 1 hour. The default is 24 hours. For example,
2.Optional: ANALYSIS_INSTANCE_SCHEMA is the Cloud Storage URI for the schema file that describes the format of your input data. For example,
gs://test-bucket/schema.yaml.(required only for skew detection) TARGET_FIELD is the field that is being predicted by the model. This field is excluded from the monitoring analysis. For example,
housing-price.(required only for skew detection) BIGQUERY_URI is the link to the training dataset stored in BigQuery, using the following format:
bq://\PROJECT.\DATASET.\TABLE
For example,
bq://\my-project.\housing-data.\san-francisco.You can replace the
bigquery-uriflag with alternative links to your training dataset:For a CSV file stored in a Cloud Storage bucket, use
--data-format=csv --gcs-uris=gs://BUCKET_NAME/OBJECT_NAME.For a TFRecord file stored in a Cloud Storage bucket, use
--data-format=tf-record --gcs-uris=gs://BUCKET_NAME/OBJECT_NAME.For a tabular AutoML managed dataset, use
--dataset=DATASET_ID.
Python SDK
For information about the full end-to-end Model Monitoring API workflow, see the example notebook.
REST API
If you haven't done so already, deploy your model to an endpoint. During the Get the endpoint ID step in the model deployment instructions, note the
deployedModels.idvalue in the JSON response for later use:Create a model monitoring job request. The instructions below show how to create a basic monitoring job for drift detection. To customize the JSON request, see the Monitoring job reference.
Before using any of the request data, make the following replacements:
- PROJECT_ID: is the ID of your Google Cloud project. For
example,
my-project. - LOCATION: is the location for your monitoring job. For example,
us-central1. - MONITORING_JOB_NAME: is the name of your monitoring job. For
example,
my-job. - PROJECT_NUMBER: is the number for your Google Cloud project. For
example,
1234567890. - ENDPOINT_ID is the ID for the endpoint to which your model is deployed. For
example,
1234567890. - DEPLOYED_MODEL_ID: is the ID for the deployed model.
- FEATURE:VALUE is the alerting threshold
for each feature you want to monitor. For example, if you specify
"Age": {"value": 0.4}, Model Monitoring logs an alert when the statistical distance between the input and baseline distributions for theAgefeature exceeds 0.4. By default, every categorical and numerical feature is monitored with threshold values of 0.3. - EMAIL_ADDRESS: is the email address where you want to receive
alerts from Model Monitoring. For example,
example@example.com. - NOTIFICATION_CHANNELS:
a list of
Cloud Monitoring notification channels
where you want to receive alerts from Model Monitoring. Use the resource names
for the notification channels, which you can retrieve by
listing the notification channels
in your project. For example,
"projects/my-project/notificationChannels/1355376463305411567",
       "projects/my-project/notificationChannels/1355376463305411568"
. - Optional: ANALYSIS_INSTANCE_SCHEMA is the Cloud Storage URI
for the schema file that describes the format of your input data. For example,
gs://test-bucket/schema.yaml.
Request JSON body:
{
  "displayName":"MONITORING_JOB_NAME",
  "endpoint":"projects/PROJECT_NUMBER/locations/LOCATION/endpoints/ENDPOINT_ID",
  "modelDeploymentMonitoringObjectiveConfigs": {
     "deployedModelId": "DEPLOYED_MODEL_ID",
     "objectiveConfig":  {
        "predictionDriftDetectionConfig": {
            "driftThresholds": {
              "FEATURE_1": {
                "value": VALUE_1
               },
              "FEATURE_2": {
                "value": VALUE_2
               }
            }
         },
      },
  },
  "loggingSamplingStrategy": {
     "randomSampleConfig":  {
        "sampleRate":  0.5,
     },
  },
  "modelDeploymentMonitoringScheduleConfig": {
     "monitorInterval": {
        "seconds": 3600,
     },
  },
  "modelMonitoringAlertConfig": {
     "emailAlertConfig": {
        "userEmails": ["EMAIL_ADDRESS"],
     },
     "notificationChannels": [NOTIFICATION_CHANNELS]
  },
  "analysisInstanceSchemaUri": ANALYSIS_INSTANCE_SCHEMA
}
To send your request, expand one of these options:
You should receive a JSON response similar to the following:
{ "name": "projects/PROJECT_NUMBER/locations/LOCATION/modelDeploymentMonitoringJobs/MONITORING_JOB_NUMBER", ... "state": "JOB_STATE_PENDING", "scheduleState": "OFFLINE", ... "bigqueryTables": [ { "logSource": "SERVING", "logType": "PREDICT", "bigqueryTablePath": "bq://PROJECT_ID.model_deployment_monitoring_8451189418714202112.serving_predict" } ], ... }- PROJECT_ID: is the ID of your Google Cloud project. For
example,
After the monitoring job is created, Model Monitoring logs
incoming prediction requests in a generated BigQuery table named
PROJECT_ID.model_deployment_monitoring_ENDPOINT_ID.serving_predict.
If request-response logging is enabled,
Model Monitoring logs incoming requests in the same
BigQuery table that is used for request-response logging.
(Optional) Configure alerts for the Model Monitoring job
You can monitor and debug your Model Monitoring job through alerts. Model Monitoring automatically notifies you of job updates through email, but you can also set up alerts through Cloud Logging and Cloud Monitoring notification channels.
For the following events, Model Monitoring sends an email notification to each email address you specified when creating the Model Monitoring job:
- Each time skew or drift detection is set up.
- Each time an existing Model Monitoring job configuration is updated.
- Each time a scheduled monitoring pipeline run fails.
Cloud Logging
To enable logs for scheduled monitoring pipeline runs, set the enableMonitoringPipelineLogs field in your modelDeploymentMonitoringJobs configuration to
true. Debugging logs are written to Cloud Logging when the monitoring job
is set up and at each monitoring interval.
The debugging logs are written to Cloud Logging with the log name:
model_monitoring. For example:
logName="projects/model-monitoring-demo/logs/aiplatform.googleapis.com%2Fmodel_monitoring" resource.labels.model_deployment_monitoring_job=6680511704087920640
Here is an example of a job progress log entry:
{
"insertId": "e2032791-acb9-4d0f-ac73-89a38788ccf3@a1",
"jsonPayload": {
  "@type": "type.googleapis.com/google.cloud.aiplatform.logging.ModelMonitoringPipelineLogEntry",
  "statusCode": {
    "message": "Scheduled model monitoring pipeline finished successfully for job projects/677687165274/locations/us-central1/modelDeploymentMonitoringJobs/6680511704087920640"
  },
  "modelDeploymentMonitoringJob": "projects/677687165274/locations/us-central1/modelDeploymentMonitoringJobs/6680511704087920640"
},
"resource": {
  "type": "aiplatform.googleapis.com/ModelDeploymentMonitoringJob",
  "labels": {
    "model_deployment_monitoring_job": "6680511704087920640",
    "location": "us-central1",
    "resource_container": "projects/677687165274"
  }
},
"timestamp": "2022-02-04T15:33:54.778883Z",
"severity": "INFO",
"logName": "projects/model-monitoring-demo/logs/staging-aiplatform.sandbox.googleapis.com%2Fmodel_monitoring",
"receiveTimestamp": "2022-02-04T15:33:56.343298321Z"
}
Notification channels
Each time a scheduled monitoring pipeline run fails, Model Monitoring sends a notification to the Cloud Monitoring notification channels you specified when creating the Model Monitoring job.
Configure alerts for feature anomalies
Model Monitoring detects an anomaly when the threshold set for a feature is exceeded. Model Monitoring automatically notifies you of detected anomalies through email, but you can also set up alerts through Cloud Logging and Cloud Monitoring notification channels.
At each monitoring interval, if the threshold of at least one feature exceeds the threshold, Model Monitoring sends an email alert to each email address you specified when creating the Model Monitoring job. The email message includes the following:
- The time at which the monitoring job ran.
- The name of the feature that has skew or drift.
- The alerting threshold as well as the recorded statistical distance measure.
Cloud Logging
To enable Cloud Logging alerts, set the enableLogging field of your ModelMonitoringAlertConfig
configuration to true.
At each monitoring interval, an anomaly log is written to Cloud Logging if the distribution of at least one feature exceeds the threshold for that feature. You can forward logs to any service that Cloud Logging supports, such as Pub/Sub.
Anomalies are written to Cloud Logging with the log name:
model_monitoring_anomaly. For example:
logName="projects/model-monitoring-demo/logs/aiplatform.googleapis.com%2Fmodel_monitoring_anomaly" resource.labels.model_deployment_monitoring_job=6680511704087920640
Here is an example of an anomaly log entry:
{
"insertId": "b0e9c0e9-0979-4aff-a5d3-4c0912469f9a@a1",
"jsonPayload": {
  "anomalyObjective": "RAW_FEATURE_SKEW",
  "endTime": "2022-02-03T19:00:00Z",
  "featureAnomalies": [
    {
      "featureDisplayName": "age",
      "deviation": 0.9,
      "threshold": 0.7
    },
    {
      "featureDisplayName": "education",
      "deviation": 0.6,
      "threshold": 0.3
    }
  ],
  "totalAnomaliesCount": 2,
  "@type": "type.googleapis.com/google.cloud.aiplatform.logging.ModelMonitoringAnomaliesLogEntry",
  "startTime": "2022-02-03T18:00:00Z",
  "modelDeploymentMonitoringJob": "projects/677687165274/locations/us-central1/modelDeploymentMonitoringJobs/6680511704087920640",
  "deployedModelId": "1645828169292316672"
},
"resource": {
  "type": "aiplatform.googleapis.com/ModelDeploymentMonitoringJob",
  "labels": {
    "model_deployment_monitoring_job": "6680511704087920640",
    "location": "us-central1",
    "resource_container": "projects/677687165274"
  }
},
"timestamp": "2022-02-03T19:00:00Z",
"severity": "WARNING",
"logName": "projects/model-monitoring-demo/logs/staging-aiplatform.sandbox.googleapis.com%2Fmodel_monitoring_anomaly",
"receiveTimestamp": "2022-02-03T19:59:52.121398388Z"
}
Notification channels
At each monitoring interval, if the threshold of at least one feature exceeds the threshold, Model Monitoring sends an alert to the Cloud Monitoring notification channels you specified when creating the Model Monitoring job. The alert includes information about the Model Monitoring job that triggered the alert.
Update a Model Monitoring job
You can view, update, pause, and delete a Model Monitoring job. You must pause a job before you can delete it.
Console
Pausing and deleting are not supported in the Google Cloud console; use the gcloud CLI instead.
To update parameters for a Model Monitoring job:
In the Google Cloud console, go to the Vertex AI Endpoints page.
Click the name of the endpoint you want to edit.
Click Edit settings.
In the Edit endpoint pane, select Model monitoring or Monitoring objectives.
Update the fields you want to change.
Click Update.
To view metrics, alerts, and monitoring properties for a model:
In the Google Cloud console, go to the Vertex AI Endpoints page.
Click the name of the endpoint.
In the Monitoring column for the model you want to view, click Enabled.
gcloud
Run the following command:
gcloud ai model-monitoring-jobs COMMAND MONITORING_JOB_ID \
  --PARAMETER=VALUE --project=PROJECT_ID --region=LOCATION
where:
COMMAND is the command you want to perform on the monitoring job. For example,
update,pause,resume, ordelete. For more information, see the gcloud CLI reference.MONITORING_JOB_ID is the ID of your monitoring job. For example,
123456789. You can find the ID by [retrieving the endpoint information][retrieve-id] or viewing Monitoring properties for a model in the Google Cloud console. The ID is included in the monitoring job resource name in the formatprojects/PROJECT_NUMBER/locations/LOCATION/modelDeploymentMonitoringJobs/MONITORING_JOB_ID.(optional) PARAMETER=VALUE is the parameter you want to update. This flag is required only when using the
updatecommand. For example,monitoring-frequency=2. For a list of parameters you can update, see the gcloud CLI reference.PROJECT_ID is the ID for your Google Cloud project. For example,
my-project.LOCATION is the location for your monitoring job. For example,
us-central1.
REST API
Pause a job
Before using any of the request data, make the following replacements:
- PROJECT_NUMBER: The number of your Google Cloud project. For
example,
1234567890. - LOCATION: Location for your monitoring job. For example,
us-central1. - MONITORING_JOB_ID: ID of your monitoring job. For
example,
0987654321.
To send your request, expand one of these options:
You should receive a JSON response similar to the following:
{}
Delete a job
Before using any of the request data, make the following replacements:
- PROJECT_NUMBER: The number of your Google Cloud project. For
example,
my-project. - LOCATION: Location for your monitoring job. For example,
us-central1. - MONITORING_JOB_ID: ID of your monitoring job. For
example,
0987654321.
To send your request, expand one of these options:
You should receive a JSON response similar to the following:
{
  "name": "projects/PROJECT_NUMBER/locations/LOCATION/operations/MONITORING_JOB_ID",
  ...
  "done": true,
  ...
}
Analyze skew and drift data
You can use the Google Cloud console to visualize the distributions of each monitored feature and learn which changes led to skew or drift over time. You can view the feature value distributions as a histogram.
Console
To navigate to the feature distribution histograms in the Google Cloud console, go to the Endpoints page.
On the Endpoints page, click the endpoint you want to analyze.
On the detail page for the endpoint you selected, there is a list of all the models deployed on that endpoint. Click the name of a model to analyze.
The details page for the model lists the model's input features, along with pertinent information, such as the alert threshold for each feature and the number of prior alerts for the feature.
To analyze a feature, click the name of the feature. A page shows the feature distribution histograms for that feature.
For each monitored feature, you can view the distributions of the 50 most recent monitoring jobs in the Google Cloud console. For skew detection, the training data distribution is displayed right next to the input data distribution:
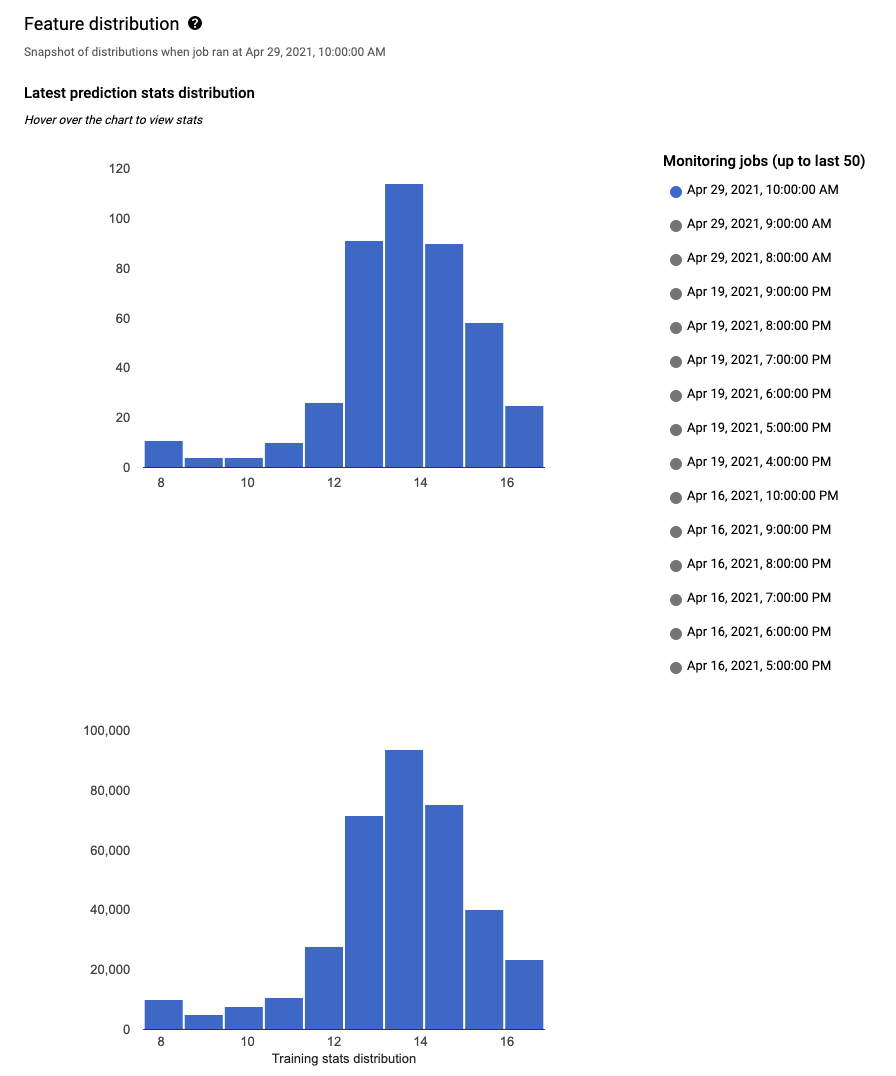
Visualizing data distribution as histograms lets you quickly focus on the changes that occurred in the data. Afterward, you might decide to adjust your feature generation pipeline or retrain the model.
What's next
- Work with Model Monitoring following the API docs.
- Work with Model Monitoring following the gcloud CLI docs.
- Try the example notebook in Colab or view it on GitHub.
- Learn how Model Monitoring calculates training-serving skew and prediction drift.