Get query performance insights
The execution graph for a query is a visual representation of the steps that BigQuery takes to execute the query. This document describes how to use the query execution graph to diagnose query performance issues, and to see query performance insights.
BigQuery offers strong query performance, but it is also a complex distributed system with many internal and external factors that can affect query speed. The declarative nature of SQL can also hide the complexity of query execution. This means that when your queries are running slower than anticipated, or slower than prior runs, understanding what happened can be a challenge.
The query execution graph provides a dynamic graphical interface for inspecting the query plan and query performance details. You can review the query execution graph for any running or completed query.
You can also use the query execution graph to get performance insights for queries. Performance insights provide best-effort suggestions to help you improve query performance. Since query performance is multi-faceted, performance insights might only provide a partial picture of the overall query performance.
Required permissions
To use the query execution graph, you must have the following permissions:
bigquery.jobs.getbigquery.jobs.listAll
These permissions are available through the following BigQuery predefined Identity and Access Management (IAM) roles:
roles/bigquery.adminroles/bigquery.resourceAdminroles/bigquery.resourceEditorroles/bigquery.resourceViewer
Execution graph structure
The query execution graph provides a graphical view of the query plan in the console. Each box represents a stage in the query plan such as the following:
- Input: Reading data from a table or selecting specific columns
- Join: Merging data from two tables based on the
JOINcondition - Aggregate: Performing calculations such as
SUM - Sort: Ordering the results
Stages are made up of
steps
that describe the individual operations that each worker within a stage
executes. You can click a stage to open it and view its
steps. Stages also include
relative and absolute timing information.
Stage names summarize the steps they perform. For example, a stage with
join in its name means that the principal step in the stage is a JOIN
operation. Stage names that have + at the end mean that
they perform additional important steps. For example, a stage with JOIN+ in
its name means that the
stage performs a join operation and other important steps.
The lines that connect stages represent the exchange of intermediary data between stages. BigQuery stores the intermediary data in shuffle memory while stages are executing. Numbers on the edges indicate the estimated number of rows exchanged between stages. Shuffle memory quota is correlated with the number of slots allocated to the account. If the shuffle quota is exceeded, shuffle memory can spill to disk and cause query performance to slow dramatically.
View query performance insights
Console
Follow these steps to see query performance insights:
Open the BigQuery page in the Google Cloud console.
In the left pane, click Explorer:
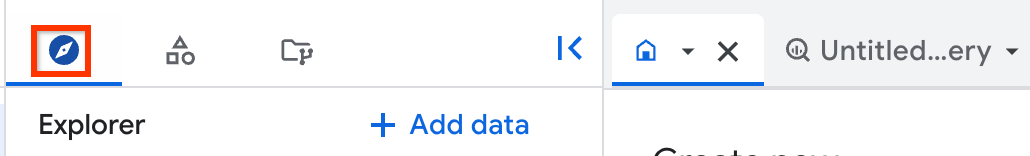
If you don't see the left pane, click Expand left pane to open the pane.
In the Explorer pane, click Job history.
Click either Personal History or Project History.
In the list of jobs, identify the query job that interests you. Click Actions, and choose View job in editor.
Select the Execution graph tab to see a graphical representation of each stage of the query:
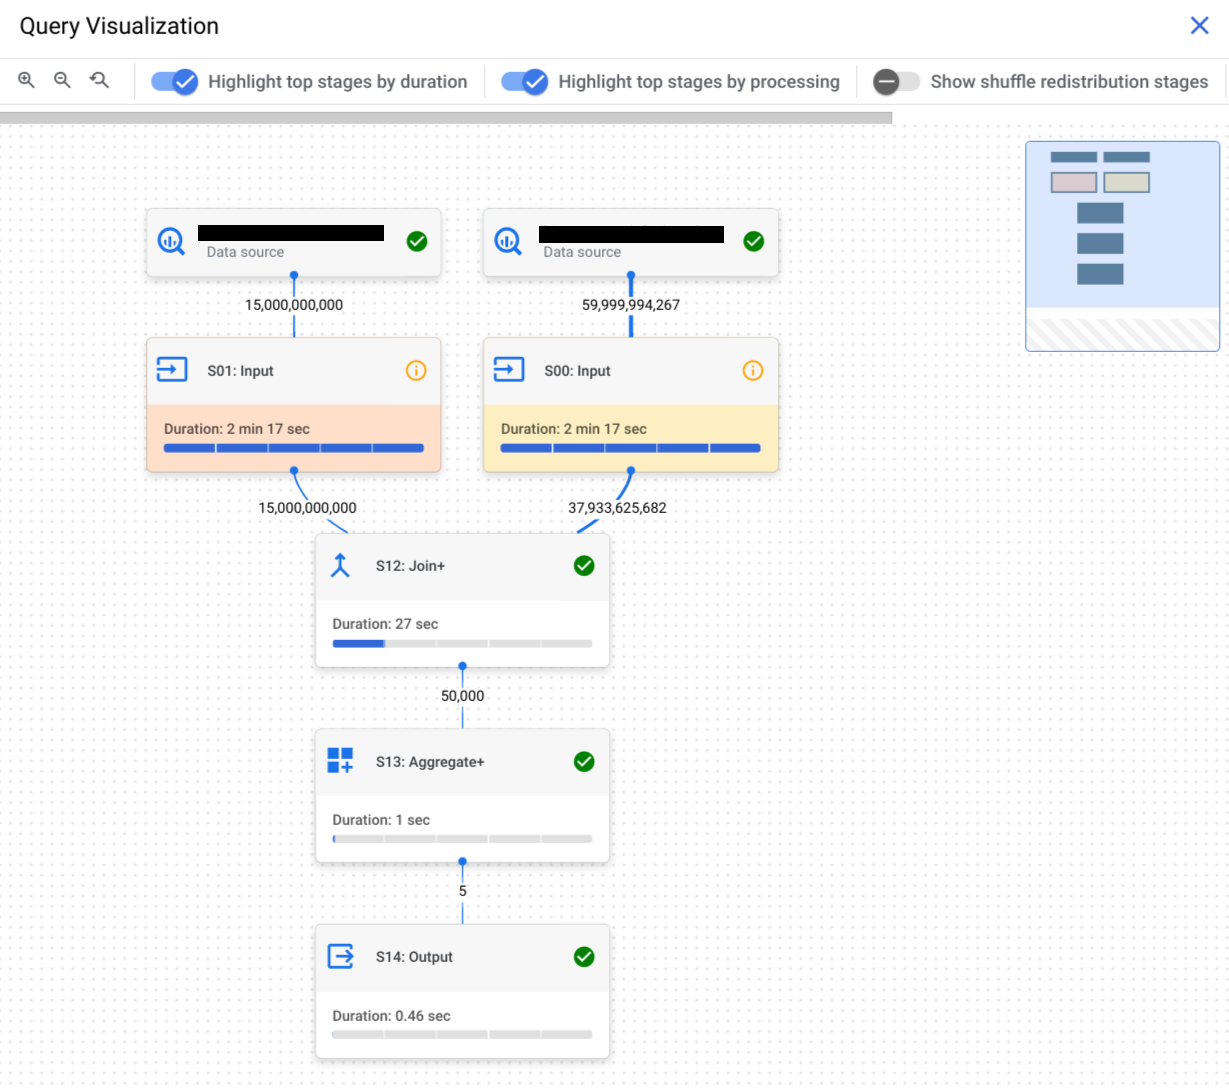
To determine if a query stage has performance insights, look at the icon it displays. Stages that have an information icon have performance insights. Stages that have a check icon don't.
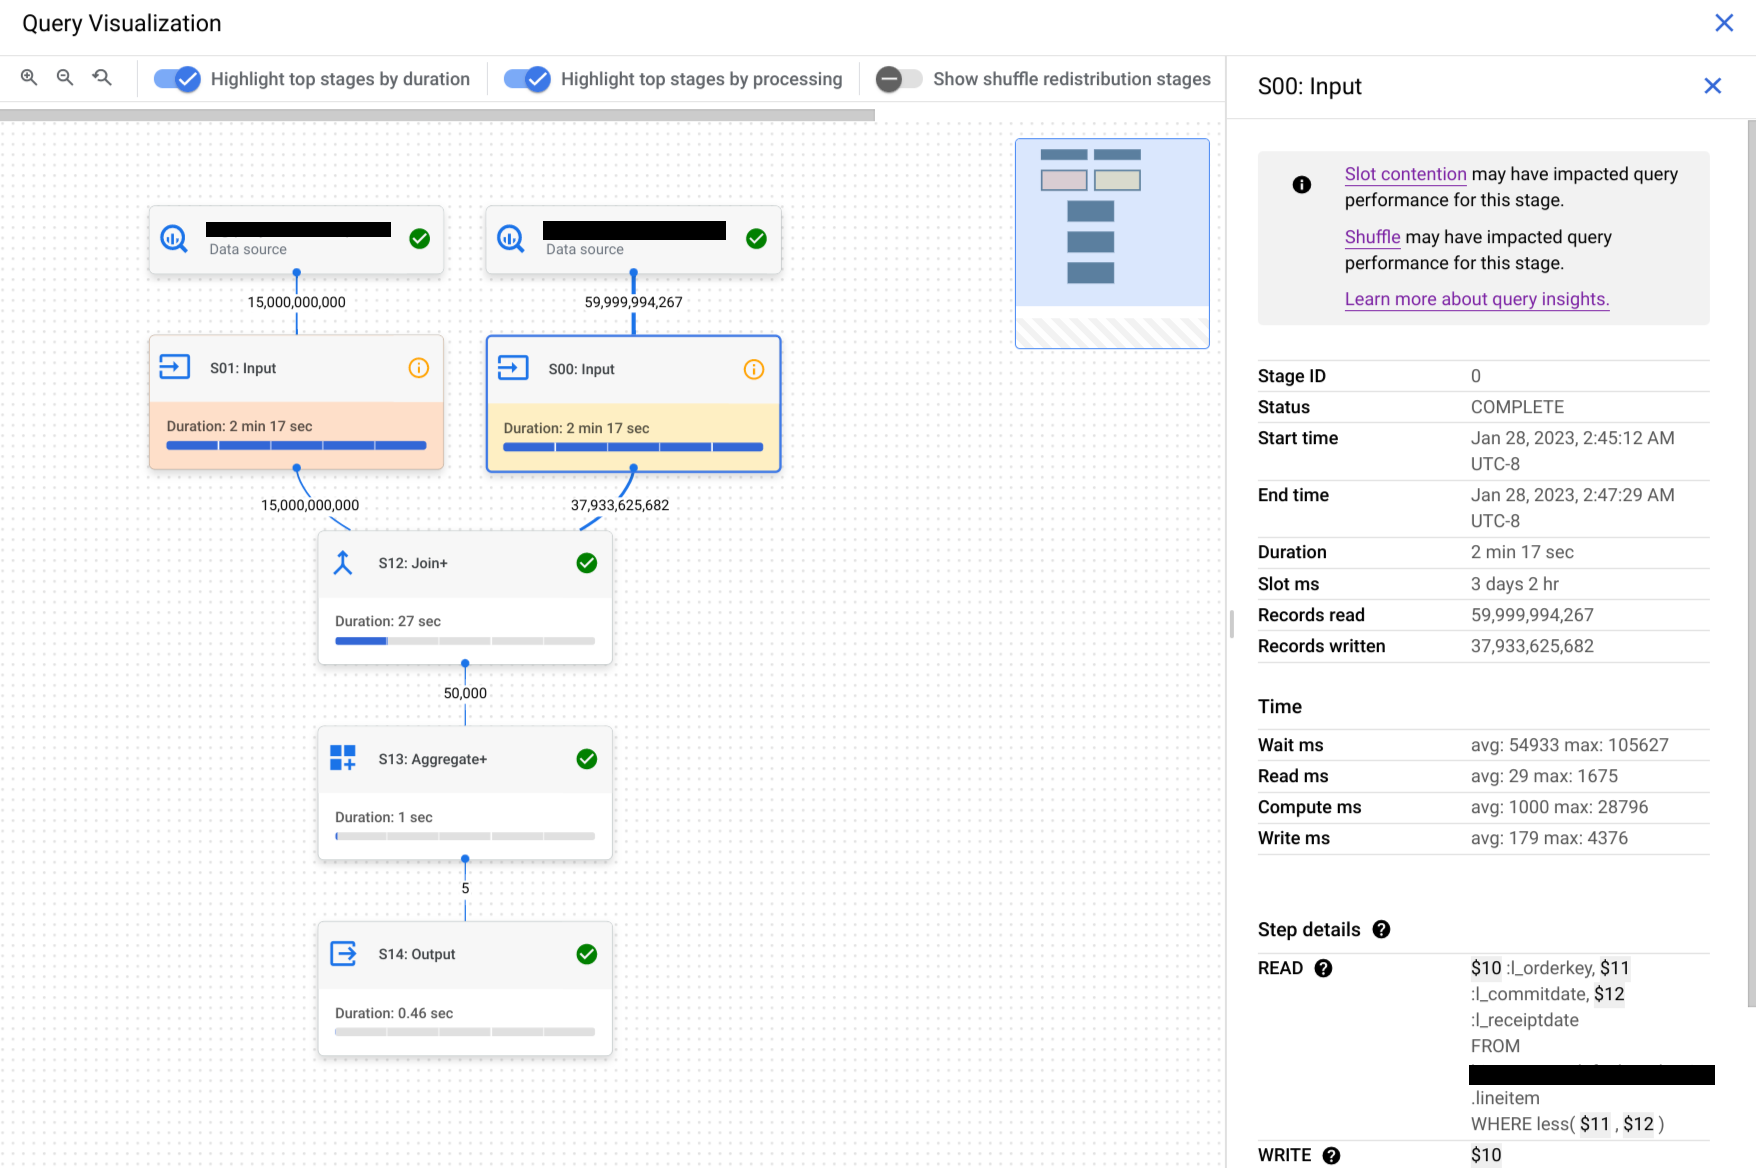
Click a stage to open the stage details pane, where you can see the following information:
- Query plan information for the stage.
- The steps executed in the stage.
- Any applicable performance insights.
Optional: If you are inspecting a running query, click Sync to update the execution graph so that it reflects the query's current status.

Optional: To highlight the top stages by stage duration on the graph, click Highlight top stages by duration.

Optional: To highlight the top stages by slot time used on the graph, click Highlight top stages by processing.

Optional: To include shuffle redistribution stages on the graph, click Show shuffle redistribution stages.

Use this option to show the repartition and coalesce stages that are hidden in the default execution graph.
Repartition and coalesce stages are introduced while the query is running, and are used to improve data distribution across the workers processing the query. Since these stages are not related to your query text, they are hidden to simplify the query plan that is displayed.
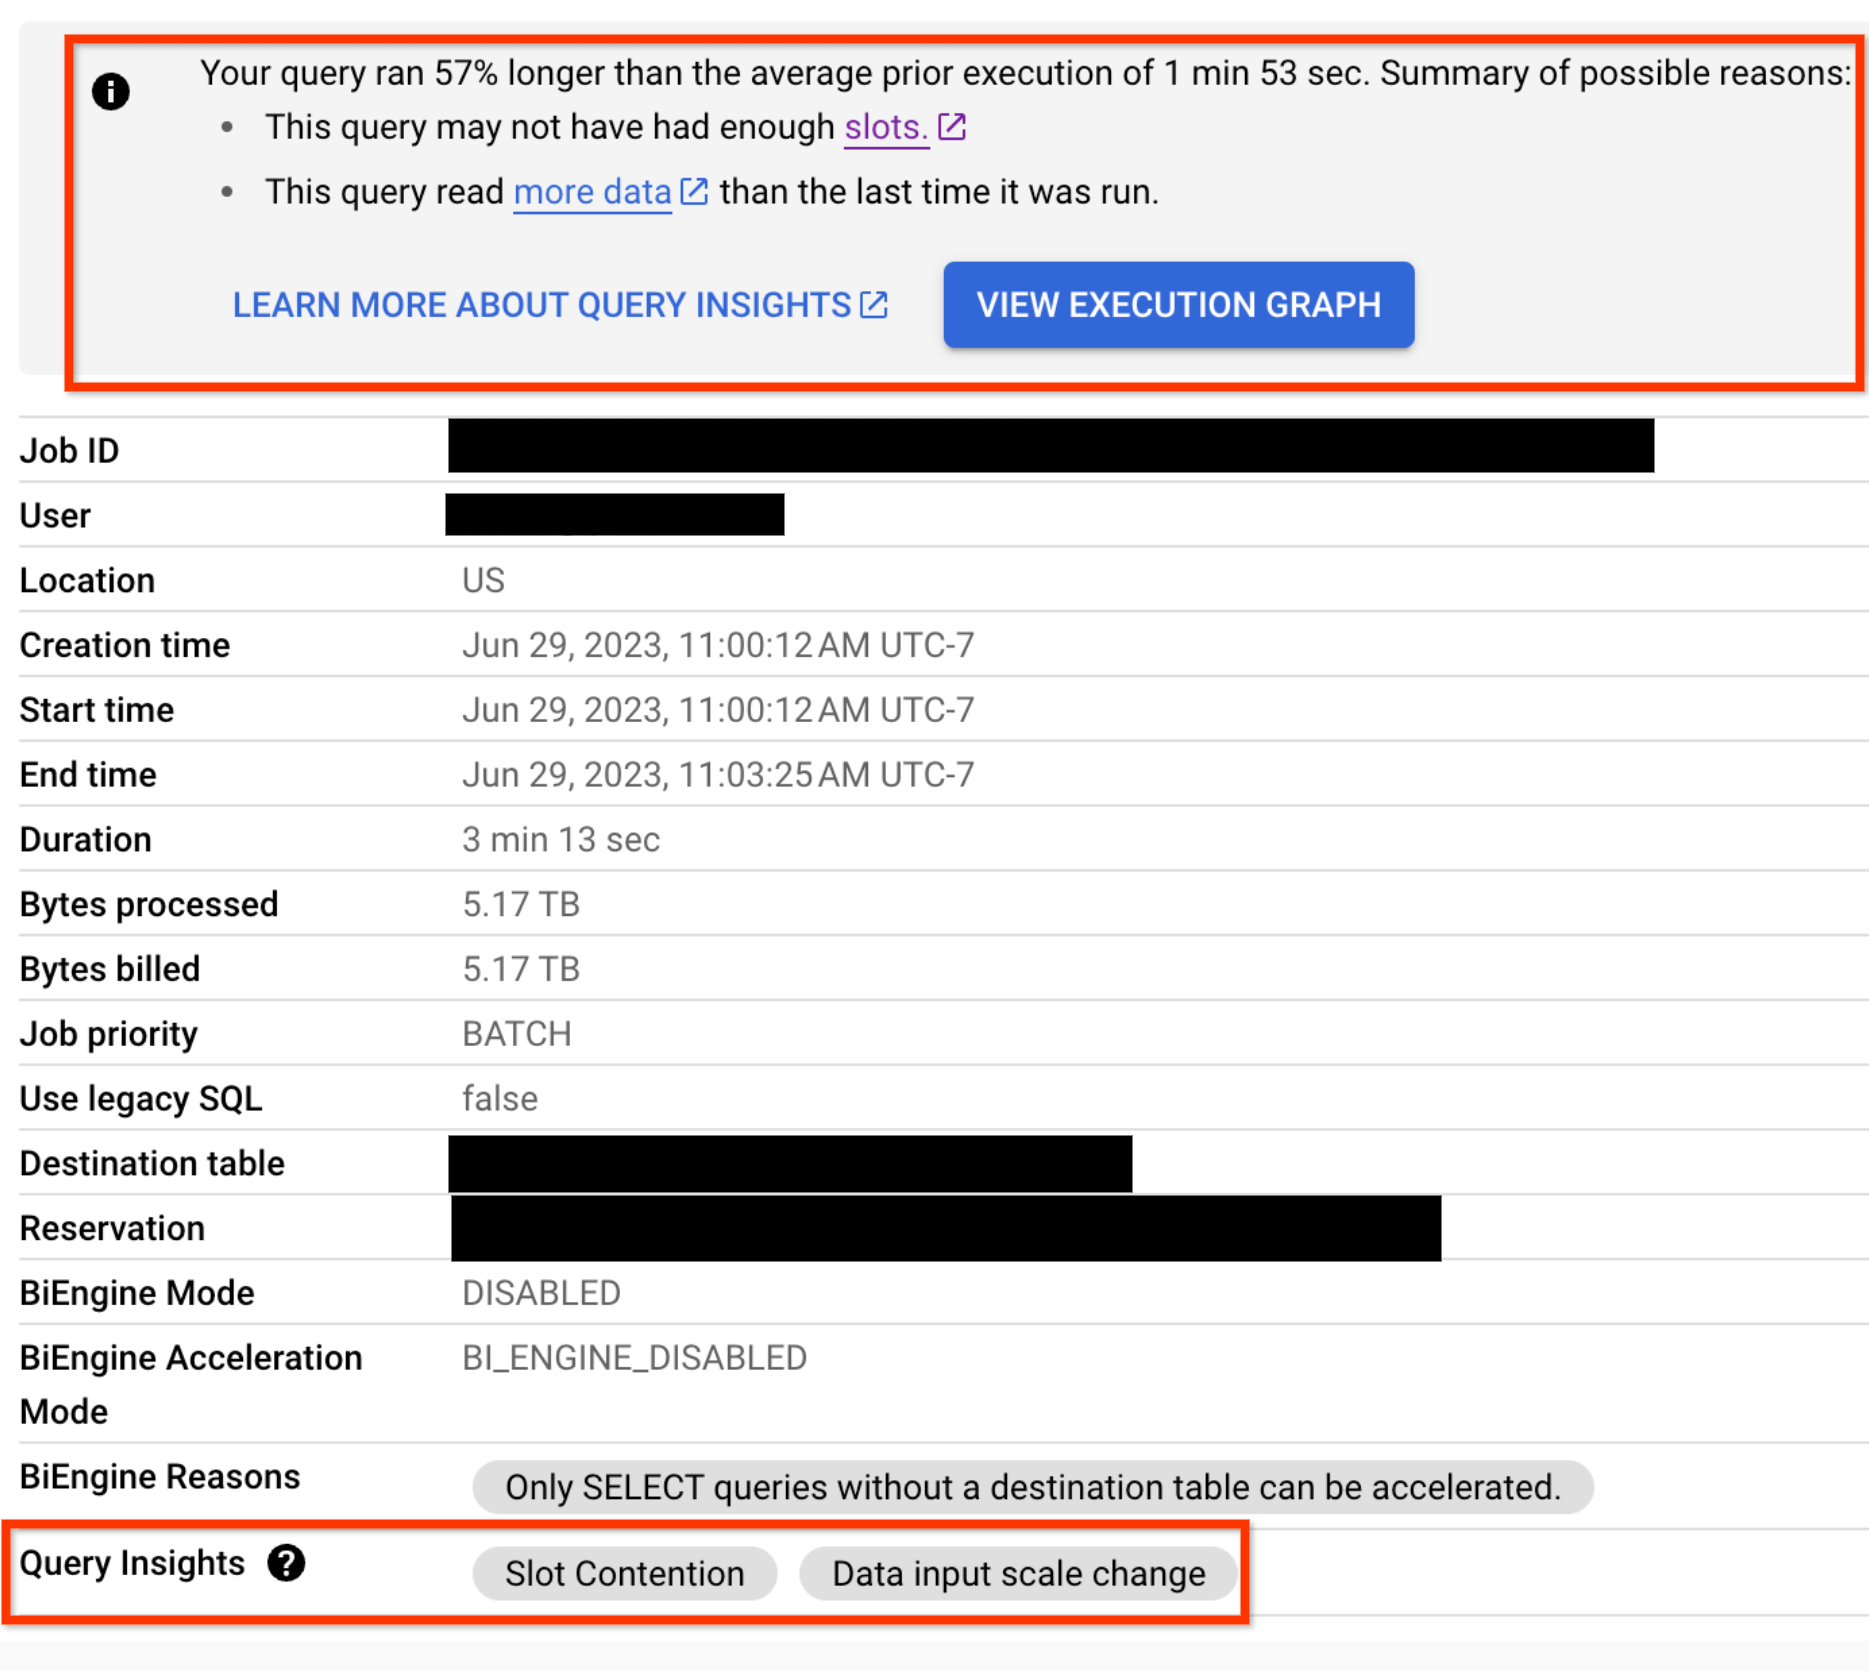
For any query that has performance regression issues, performance insights are also displayed on the Job Information tab for the query:
SQL
In the Google Cloud console, go to the BigQuery page.
In the query editor, enter the following statement:
SELECT
  `bigquery-public-data`.persistent_udfs.job_url(
    project_id || ':us.' || job_id) AS job_url,
  query_info.performance_insights
FROM
  `region-REGION_NAME`.INFORMATION_SCHEMA.JOBS_BY_PROJECT
WHERE
  DATE(creation_time) >= CURRENT_DATE - 30 -- scan 30 days of query history
  AND job_type = 'QUERY'
  AND state = 'DONE'
  AND error_result IS NULL
  AND statement_type != 'SCRIPT'
  AND EXISTS ( -- Only include queries which had performance insights
    SELECT 1
    FROM UNNEST(
      query_info.performance_insights.stage_performance_standalone_insights
    )
    WHERE slot_contention OR insufficient_shuffle_quota
    UNION ALL
    SELECT 1
    FROM UNNEST(
      query_info.performance_insights.stage_performance_change_insights
    )
    WHERE input_data_change.records_read_diff_percentage IS NOT NULL
  );
Click Run.
For more information about how to run queries, see Run an interactive query.
API
You can get query performance insights in a non-graphical format by
calling the jobs.list
API method and inspecting the
JobStatistics2
information that is returned.
Interpret query performance insights
Use this section to learn more about what performance insights mean and how to address them.
Performance insights are intended for two audiences:
Analysts: you run queries in a project. You are interested in finding out why a query you have run before is unexpectedly running slower, and in getting tips on how to improve a query's performance. You have the permissions described in Required permissions.
Data lake or data warehouse administrators: you manage your organization's BigQuery resources and reservations. You have the permissions associated with the BigQuery Admin role.
Each of the following sections provides guidance on what you can do to address a performance insight you receive, based on which of these roles you occupy.
Slot contention
When you run a query, BigQuery attempts to break up the work needed by your query into tasks. A task is a single slice of data that is input into and output from a stage. A single slot picks up a task and executes that slice of data for the stage. Ideally, BigQuery slots execute these tasks in parallel to achieve high performance. Slot contention occurs when your query has many tasks ready to start executing, but BigQuery can't get enough available slots to execute them.
What to do if you're an analyst
Reduce the data you are processing in your query by following the guidance in Reduce data processed in queries.
What to do if you're an administrator
Increase slot availability or decrease slot usage by taking the following actions:
- If you use BigQuery's on-demand pricing, your queries use a shared pool of slots. Consider switching to capacity-based analysis pricing by purchasing reservations instead. Reservations let you reserve dedicated slots for your organization's queries.
If you are using BigQuery reservations, ensure that there are enough slots in the reservation that is assigned to the project that was running the query. The reservation might not have enough slots in these scenarios:
- There are other jobs that are consuming reservation slots. You can use Admin Resource Charts to see how your organization is using the reservation.
- The reservation does not have enough assigned slots to run queries fast enough. You can use the slot estimator to get an estimate of how large your reservations should be to efficiently process your queries' tasks.
To address this, you can try one of the following solutions:
- Add more slots (either baseline slots or max reservation slots) to that reservation.
- Create an additional reservation and assign it to the project running the query.
- Spread out resource-intensive queries, either over time within a reservation or over different reservations.
Ensure that the tables you are querying are clustered. Clustering helps to ensure that BigQuery can quickly read columns with correlated data.
Ensure that the tables you are querying are partitioned. For unpartitioned tables, BigQuery reads the entire table. Partitioning your tables helps ensure that you query only the subset of your tables that you are interested in.
Insufficient shuffle quota
Before running your query, BigQuery breaks up your query's logic into stages. BigQuery slots execute the tasks for each stage. When a slot completes the execution of a stage's tasks, it stores the intermediate results in shuffle. Subsequent stages in your query read data from shuffle to continue your query's execution. Insufficient shuffle quota occurs when you have more data that needs to get written to shuffle than you have shuffle capacity.
What to do if you're an analyst
Similarly to slot contention, reducing the amount of data that your query processes might reduce shuffle usage. To do this, follow the guidance in Reduce data processed in queries.
Certain operations in SQL tend to make more extensive usage of shuffle,
particularly
JOIN operations
and GROUP BY clauses.
Where possible, reducing the amount of data in these operations might reduce shuffle usage.
What to do if you're an administrator
Reduce shuffle quota contention by taking the following actions:
- Similarly to slot contention, if you use BigQuery's on-demand pricing, your queries use a shared pool of slots. Consider switching to capacity-based analysis pricing by purchasing reservations instead. Reservations give you dedicated slots and shuffle capacity for your projects' queries.
If you are using BigQuery reservations, slots come with dedicated shuffle capacity. If your reservation is running some queries that make extensive use of shuffle, this might cause other queries running in parallel to not get enough shuffle capacity. You can identify which jobs use shuffle capacity extensively by querying the
period_shuffle_ram_usage_ratiocolumn in theINFORMATION_SCHEMA.JOBS_TIMELINEview.To address this, you can try one or more of the following solutions:
- Add more slots to that reservation.
- Create an additional reservation and assign it to the project running the query.
- Spread out shuffle-intensive queries, either over time within a reservation or over different reservations.
Data input scale change
Getting this performance insight indicates that your query is reading at least 50% more data for a given input table than the last time you ran the query. You can use table change history to see if the size of any of the tables used in the query has recently increased.
What to do if you're an analyst
Reduce the data you are processing in your query by following the guidance in Reduce data processed in queries.
High cardinality join
When a query contains a join with non-unique keys on both sides of the join, the size of the output table can be considerably larger than the size of either of the input tables. This insight indicates that the ratio of output rows to input rows is high and offers information about these row counts.
What to do if you're an analyst
Check your join conditions to confirm that the increase in the size of the
output table is expected. Avoid using
cross joins.
If you must use a cross join, try using a GROUP BY clause to pre-aggregate
results, or use a window function. For more information, see
Reduce data before using a JOIN.
Partition skew
To provide feedback or request support with this feature, send email to
bq-query-inspector-feedback@google.com.
Skewed data distribution can cause queries to run slowly. When a query is executing, BigQuery splits data into small partitions for parallel processing. Skew occurs when data is unevenly distributed across these partitions, often due to frequently occurring values in join or grouping keys, making some partitions significantly larger than others. Since a single slot processes an entire partition and cannot share the work, an oversized partition can slow down processing, cause "resource exceeded" errors, and in extreme cases crash the slot.
While you run a JOIN operation, BigQuery partitions the data
on the left and right sides of the join based on the join keys. If a partition
is too large, BigQuery attempts to rebalance the data. If the
skew is too severe to be fully rebalanced, a partition skew insight is added to
the JOIN stage in the execution graph.
Identify partition skew
Use the Execution graph tab in BigQuery Studio to find which stage of the query is experiencing the partition skew. The insight is flagged on the stage. From the stage details, you can determine the relevant part of the query text and the tables being processed. For more information, see Understand steps with query text.
Example
The following query joins repository information with file information. Skew can occur if some repositories have vastly more files than others.
SELECT r.repo_name, COUNT(f.path) AS file_count
FROM `bigquery-public-data.github_repos.sample_repos` AS r
JOIN `bigquery-public-data.github_repos.sample_files` AS f
  ON r.repo_name = f.repo_name
WHERE r.watch_count > 10
GROUP BY r.repo_name
The join key is repo_name. In the sample_repos table, repo_name is
expected to be unique. However, in the sample_files table, repo_name can
appear many times. If a few repo_name values appear disproportionately
frequently in sample_files, this creates data skew.
To confirm if data skew exists, analyze the distribution of the join key in the
larger table (sample_files in this case). Run the following query to assess
the distribution of repo_name:
SELECT repo_name, COUNT(*) AS occurrences
FROM `bigquery-public-data.github_repos.sample_files`
GROUP BY repo_name
ORDER BY occurrences DESC
For very large tables, use the APPROX_TOP_COUNT
function to efficiently estimate the most frequent values.
SELECT APPROX_TOP_COUNT(repo_name, 100)
FROM `bigquery-public-data.github_repos.sample_files`
If the counts for the top values are orders of magnitude larger than others, data skew is present.
Mitigate partition skew
You can use the following strategies to address partition skew:
- Filter your data early. Reduce the amount of data being processed by
applying filters as early as possible in your query. This can decrease the
number of rows associated with skewed keys before they reach operations like
JOINorGROUP BY. Split the query to isolate skewed keys. If skew is caused by a few specific key values, similar to the
repo_namefield in the preceding example, consider splitting the query. Process the data for the skewed keys separately from the rest of the data, then combine the results usingUNION ALL.Example: Isolating a frequently used key.
-- Query for the skewed key
SELECT r.repo_name, COUNT(f.path) AS file_count
FROM `bigquery-public-data.github_repos.sample_repos` AS r
JOIN `bigquery-public-data.github_repos.sample_files` AS f
  ON r.repo_name = f.repo_name
WHERE r.watch_count > 10 AND r.repo_name = 'popular_repo'
GROUP BY r.repo_name

UNION ALL

-- Query for all other keys
SELECT r.repo_name, COUNT(f.path) AS file_count
FROM `bigquery-public-data.github_repos.sample_repos` AS r
JOIN `bigquery-public-data.github_repos.sample_files` AS f
  ON r.repo_name = f.repo_name
WHERE r.watch_count > 10 AND r.repo_name != 'popular_repo'
GROUP BY r.repo_name
Handle
NULLand default values: A common cause of skew is a large number of rows withNULLor empty string values in key columns. If you don't need these rows for analysis, filter them out using aWHEREclause before theJOINorGROUP BY.Reorder operations: In queries with multiple joins, the order can matter. If possible, perform joins that significantly reduce row counts earlier in the query.
Use approximate functions: For aggregations on skewed data, consider if an approximate result is acceptable. Functions like
APPROX_COUNT_DISTINCTare more tolerant of data skew than exact functions likeCOUNT(DISTINCT).
Interpret query stage information
In addition to using query performance insights, you can also use the following guidelines when you are reviewing query stage details to help determine if there is an issue with a query:
- If the Wait ms value for one or more stages is high compared to previous
runs of the query:
- See if you have enough slots available to accommodate your workload. If not, load-balance when you run resource-intensive queries so they don't compete with each other.
- If the Wait ms value is higher than it has been for just one stage, look at the stage prior to it to see if a bottleneck has been introduced there. Things like substantial changes to the data or schema of the tables involved in the query might affect the query performance.
- If the Shuffle output bytes value for a stage is high compared to
previous runs of the query, or compared to a previous stage, evaluate the
steps processed in that stage to see if any create unexpectedly large amounts
of data. One common cause for this is when a step processes an
INNER JOINwhere there are duplicate keys on both sides of the join. This can return an unexpectedly large amount of data. - Use the execution graph to look at the top stages by duration and processing. Consider the amount of data they produce and whether it is commensurate with the size of the tables referenced in the query. If it isn't, review the steps in those stages to see if any of them might produce an unexpected amount of interim data.
What's next
- Review the query optimization guidelines for tips on improving query performance.