대시보드, 차트, 알림 만들기
이 문서에서는 Cloud Monitoring을 사용하여 BigQuery 리소스를 모니터링하는 차트와 알림을 만드는 방법을 설명합니다.
시작하기 전에
Cloud Monitoring을 사용하기 전에 다음이 있는지 확인합니다.
- Cloud Billing 계정
- 결제가 사용 설정된 BigQuery 프로젝트
이 두 가지가 모두 있는지 확인하는 방법 중 하나는 빠른 시작: Google Cloud 콘솔 사용을 완료하는 것입니다.
대시보드, 차트, 알림 보기 및 만들기
Cloud Monitoring 대시보드 보기
Cloud Monitoring을 사용하여 BigQuery 프로젝트를 모니터링하려면 다음 안내를 따르세요.
Google Cloud 콘솔에서 Monitoring 페이지로 이동합니다.
페이지 상단에서 프로젝트 이름을 선택합니다(아직 선택하지 않은 경우).
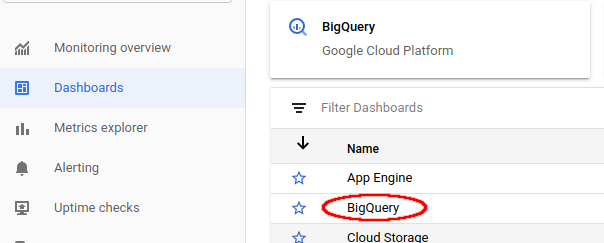
BigQuery 리소스를 보려면 대시보드 > BigQuery를 선택합니다. 이 페이지에는 사용자가 구성할 수 있는 테이블, 이벤트, 사고 보고 목록과 프로젝트 측정항목 또는 데이터 세트 측정항목의 차트가 표시됩니다.
사용 가능한 슬롯 및 할당된 슬롯 시각화
사용 가능한 슬롯과 프로젝트에 할당된 슬롯을 시각화하려면 Cloud Monitoring 대시보드 보기의 설명대로 BigQuery용 대시보드로 이동합니다.
Google Cloud 콘솔에서 Monitoring 페이지로 이동합니다.
대시보드 > BigQuery를 선택합니다.
BigQuery용 Cloud Monitoring 대시보드에서 슬롯 사용률 차트로 스크롤합니다.
Cloud Monitoring 기본 대시보드와 BigQuery용 Cloud Monitoring 대시보드 모두에 슬롯 사용률 차트가 나타납니다.
대시보드 및 차트 만들기
Cloud Monitoring에서 수집한 측정항목을 자체 차트 및 대시보드에 표시합니다.
Google Cloud 콘솔에서 Monitoring 페이지로 이동합니다.
대시보드 > 대시보드 만들기를 선택합니다.
차트 추가를 클릭합니다. 차트 추가 페이지가 표시됩니다.
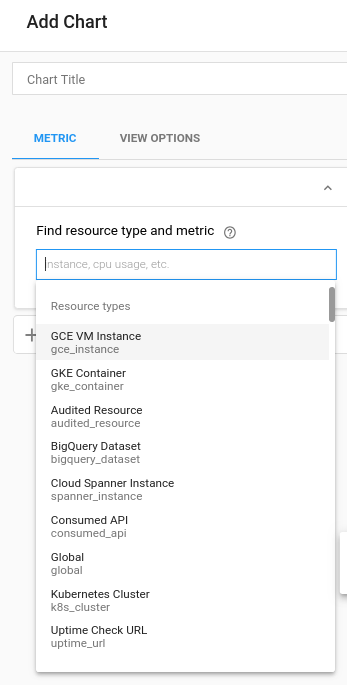
리소스 유형 및 측정항목 찾기 패널 필드에서 다음 작업을 수행합니다.
- 리소스 유형 드롭다운 목록에서 전역을 선택합니다. 전역 옵션을 표시하려면 리소스 유형 목록을 확장해야 할 수도 있습니다.
- 측정항목 드롭다운 목록에서 쿼리 실행 시간을 선택합니다.
집계 창 필드에서는 실행 시간 데이터가 표시되는 방법을 제어합니다. 이 필드의 기본 설정을 수정할 수 있습니다.
저장을 클릭합니다.
할당량 사용량 및 한도 보기
Cloud Monitoring에서 할당량 사용량 및 한도에 대한 측정항목을 볼 수 있습니다.
Google Cloud 콘솔에서 Monitoring 페이지로 이동합니다.
탐색창에서
 측정항목 탐색기를 선택합니다.
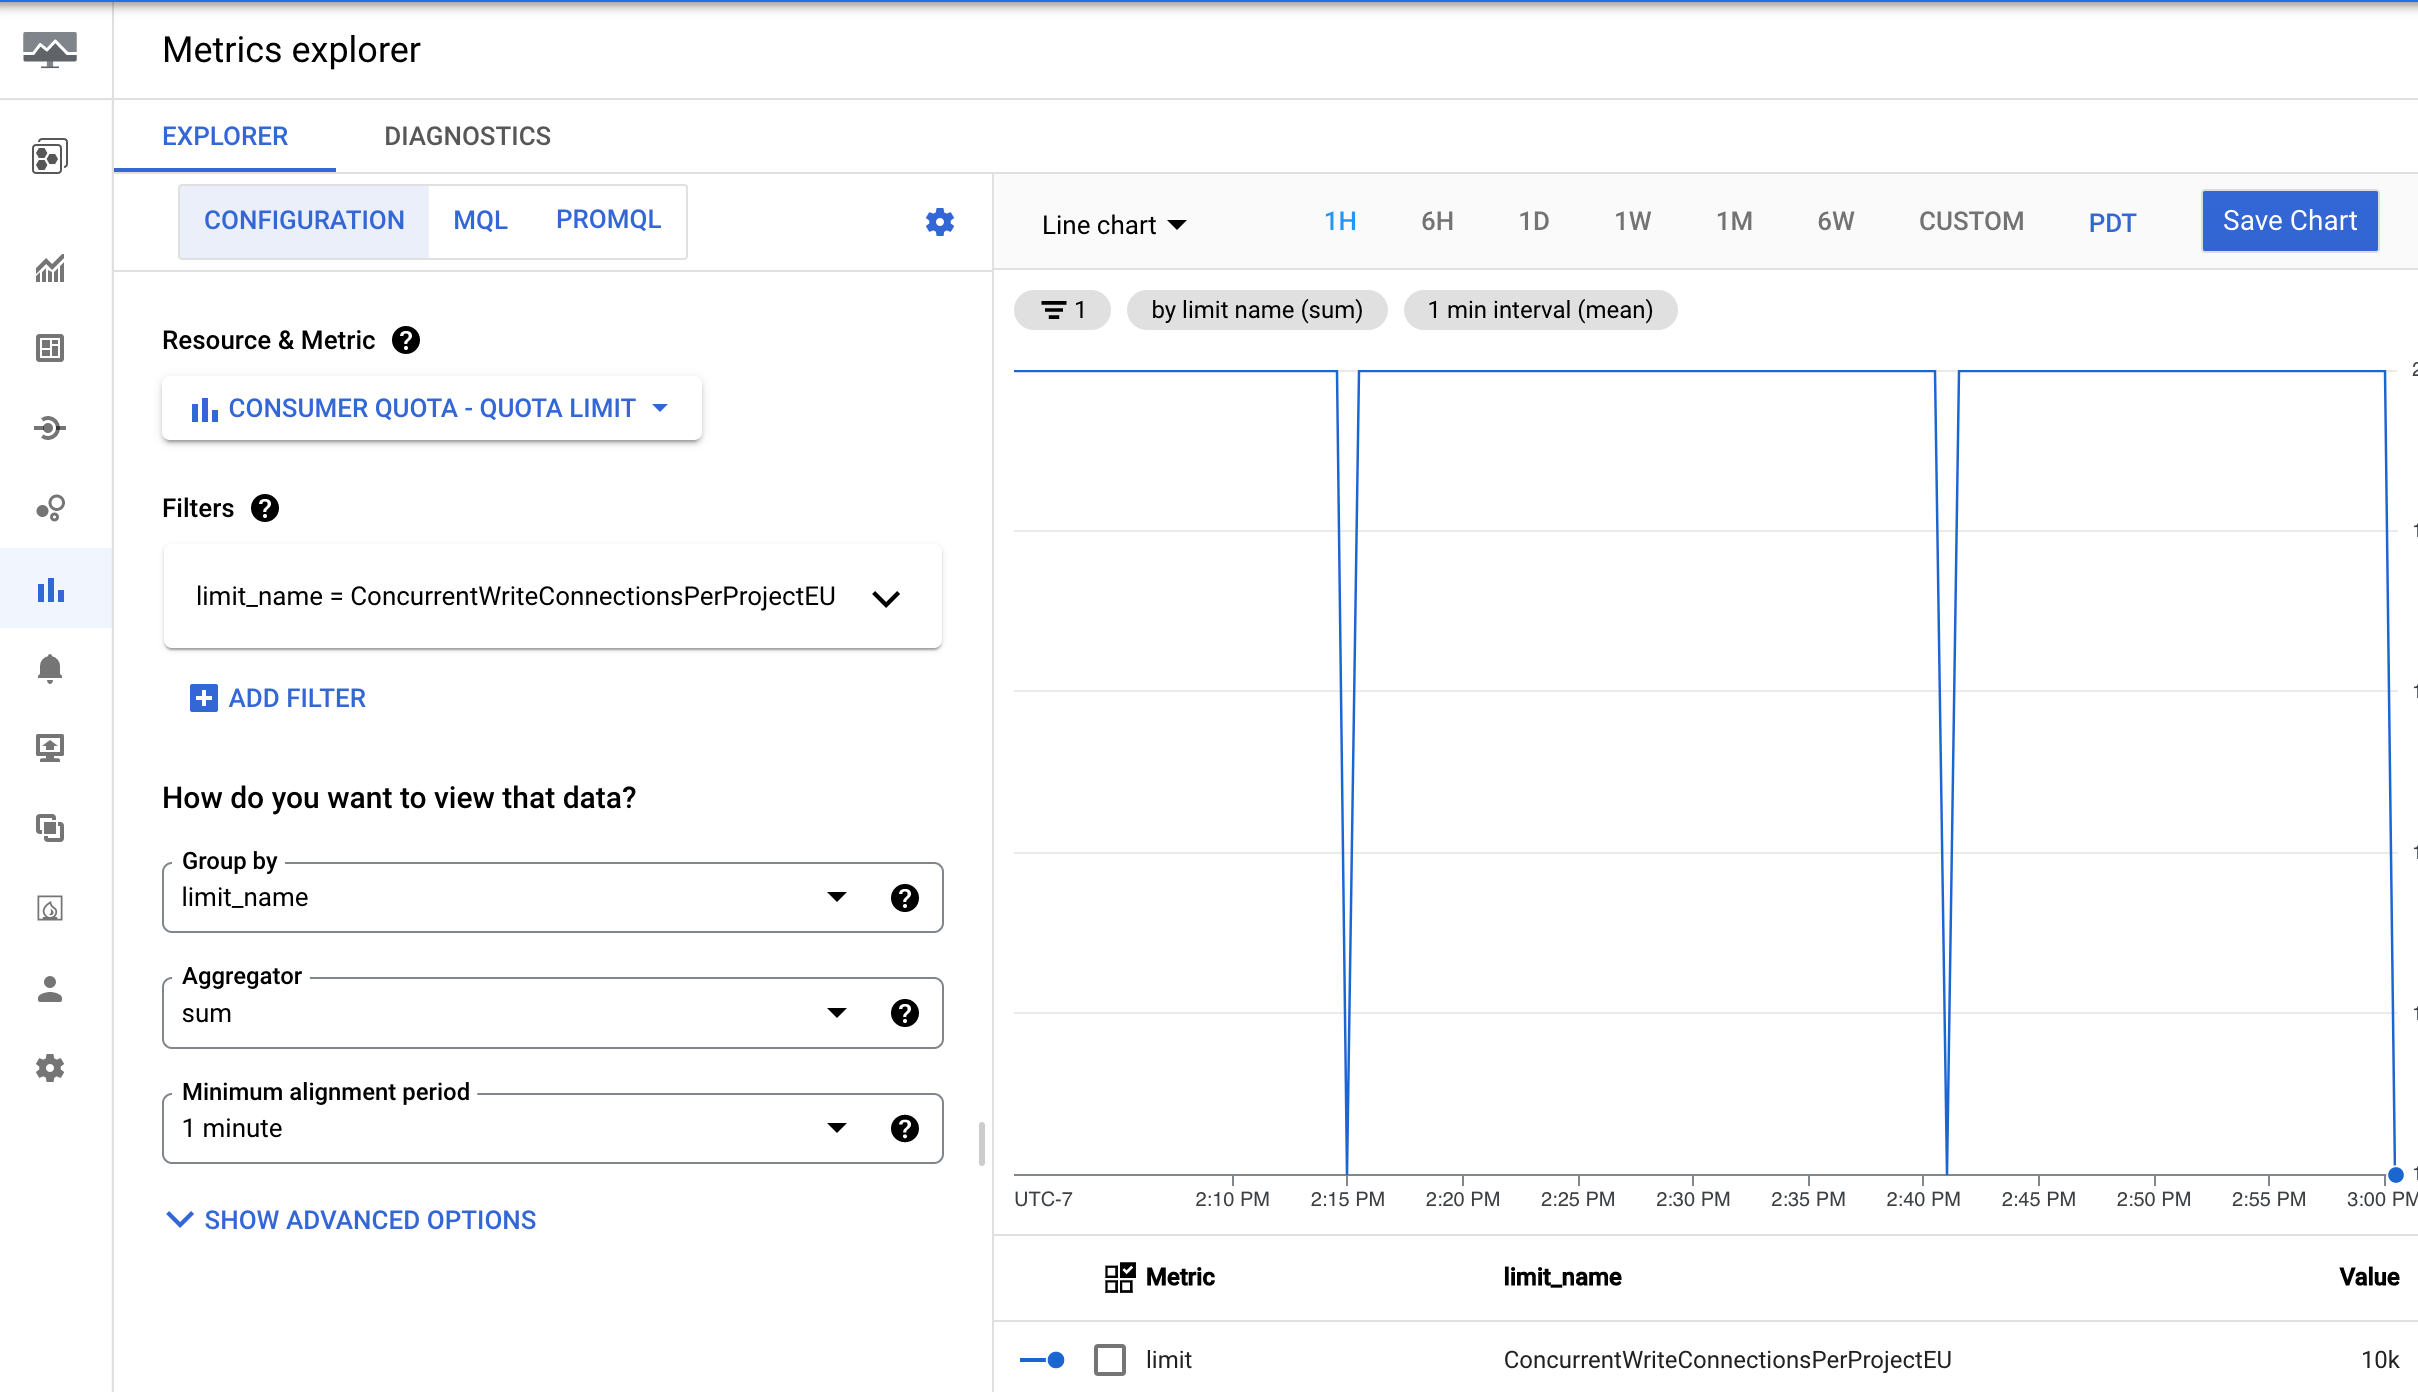
툴바에서 탐색기 > 구성을 선택합니다.
리소스 및 측정항목 섹션에서 측정항목 선택을 클릭합니다.
소비자 할당량 > 할당량 > 할당량 한도를 선택한 다음 적용을 클릭합니다.
필터 추가를 클릭한 다음 라벨 메뉴에서 limit_name을 선택합니다.
값 메뉴에서 측정항목을 보려는 할당량을 선택합니다.
알림 만들기
BigQuery 쿼리 실행 시간의 99번째 백분위 수가 사용자 정의 제한을 초과할 때 트리거되는 알림 정책을 만들려면 다음 설정을 사용합니다.
| 새 조건 필드 |
값 |
|---|---|
| 리소스 및 측정항목 | 리소스 메뉴에서 BigQuery 프로젝트를 선택합니다. 측정항목 카테고리 메뉴에서 쿼리를 선택합니다. 측정항목 메뉴에서 쿼리 실행 시간을 선택합니다. |
| 필터 | |
| 시계열 시계열 그룹화 기준 |
priority |
| 시계열 시계열 집계 |
99th percentile |
| 순환 기간 | 5 m |
| 순환 윈도우 함수 | sum |
| 알림 트리거 구성 필드 |
값 |
|---|---|
| 조건 유형 | Threshold |
| 알림 트리거 | Any time series violates |
| 기준 위치 | Above threshold |
| 기준 값 | 이 값을 결정합니다. 하지만 60초의 기준이 권장됩니다. |
| 재테스트 범위 | most recent value |
BigQuery 프로젝트에 청구된 총 스캔 바이트가 사용자 정의 한도를 초과할 때 트리거되는 알림 정책을 만들려면 다음 알림 정책 구성을 사용하세요.
|
새 조건 필드 |
값 |
|---|---|
| 리소스 및 측정항목 |
리소스 메뉴에서 BigQuery 프로젝트를 선택합니다. 측정항목 카테고리 메뉴에서 쿼리를 선택합니다. 측정항목 메뉴에서 청구된 문장 스캔 바이트를 선택합니다. |
| 필터 | (프로젝트 전체 알림에는 필터가 필요하지 않음) |
|
시계열 시계열 그룹화 기준 |
(모든 계열을 집계하려면 비워 두세요.) |
|
시계열 시계열 집계 |
sum |
| 순환 기간 |
5 m |
| 순환 윈도우 함수 |
sum
|
|
알림 트리거 구성 필드 |
값 |
|---|---|
| 조건 유형 |
Threshold
|
| 알림 트리거 |
Any time series violates
|
| 기준 위치 |
Above threshold
|
| 기준 값 |
이 값은 사용자가 결정합니다. 예를 들어 사용량이 1TiB를 초과할 때 알림을 트리거하려면 1000000000000를 입력합니다.
|
알림 정책은 스캔된 총 바이트를 모니터링하지만 특정 예산을 기준으로 기준점을 설정할 수 있습니다. 이 예산 기반 알림 정책을 구현하려면 먼저 원하는 비용 기준점을 이에 상응하는 바이트 수로 변환해야 합니다. 이 공식은 BigQuery 주문형 컴퓨팅 가격 책정을 기반으로 합니다. 자세한 내용은 주문형 컴퓨팅 가격 책정을 참고하세요.
다음 공식을 사용하여 비용 기준점을 바이트로 변환할 수 있습니다.
Threshold in Bytes = (Target Amount / (price per TiB)) * 1,000,000,000,000예: 사용량이 100달러를 초과할 때 알림 트리거
프로젝트의 쿼리 비용이 $100를 초과할 때 알림을 받으려고 한다고 가정해 보겠습니다.
- TiB의 해당 데이터 볼륨을 계산합니다.
$100 / (price per TiB) = Equivalent Data Volume in TiB - 데이터 볼륨을 바이트로 변환:
(Equivalent Data Volume in TiB) * 1,000,000,000,000 = Threshold Value in Bytes - 기준값 설정:
정책의 알림 트리거 구성 섹션에서 '바이트 단위 기준값'을 기준값으로 입력합니다.
이제 롤링 창에서 청구된 총 스캔 바이트가 주문형 쿼리 비용으로 약 $100에 해당하면 알림 정책이 트리거됩니다.
시각화에 사용할 수 있는 측정항목
다음과 같은 측정항목을 사용할 수 있으며 최대 몇 시간까지 지연 시간이 발생할 수 있습니다.
| 리소스 유형 | 이름 | 단위 | 설명 |
|---|---|---|---|
| BigQuery | Scanned bytes |
분당 바이트 수 | 검색된 바이트 수입니다. |
| BigQuery | Scanned bytes billed |
분당 바이트 수 | 주문형 분석 모델을 사용할 때 청구 대상인 전송 바이트 수입니다. 쿼리당 처리되는 최소 데이터 양을 사용해 요금이 반올림되면서 검색된 바이트와 검색된 청구 대상 바이트가 다를 수 있습니다. |
| BigQuery | BI Engine Query Fallback Count (Preview) |
쿼리 | BI Engine을 비율로 사용하지 않은 쿼리의 양입니다. 그룹화 기준 옵션을 reason으로 설정하면 다음을 포함한 여러 대체 이유로 수를 구분할 수 있습니다.
|
| BigQuery | Query count |
쿼리 | 처리 중인 쿼리입니다. |
| BigQuery | Query execution count (Preview) |
쿼리 | 실행된 쿼리 수 |
| BigQuery |
Query execution times
|
초 | 캐시되지 않은 쿼리 실행 시간입니다. |
| BigQuery | Slots used by project |
슬롯 | 프로젝트의 쿼리 작업에 할당된 BigQuery 슬롯 수입니다. 슬롯은 결제 계정별로 할당되며 여러 프로젝트가 동일한 슬롯 예약을 공유할 수 있습니다. |
| BigQuery | Slots used by project and job type |
슬롯 | 특정 시점에 프로젝트에 할당된 슬롯의 작업 유형별 수입니다.
이 수는 해당 프로젝트에서 사용 중인 슬롯 수로 간주될 수 있습니다. 로드 및 추출 작업은 무료 작업이므로 공개 리소스 풀에서 실행됩니다.
슬롯은 결제 계정별로 할당되며 여러 프로젝트가 동일한 슬롯 예약을 공유할 수 있습니다. |
| BigQuery | Slots used by project, reservation, and job type |
슬롯 | 프로젝트에 할당된 BigQuery 슬롯 수입니다. 슬롯 할당은 예약 및 작업 유형을 기준으로 분류할 수 있습니다. |
| BigQuery | Total slots |
슬롯 | 프로젝트에서 사용할 수 있는 슬롯의 총 수입니다. 프로젝트가 슬롯 예약을 다른 프로젝트와 공유하는 경우, 다른 프로젝트에서 사용 중인 슬롯은 반영되지 않습니다. |
| BigQuery | Slots used across projects in reservations |
슬롯 | 예약에 있는 프로젝트 간에 할당된 BigQuery 슬롯 수입니다. 하나 이상의 프로젝트가 예약에 할당되고 슬롯을 사용하는 동안에만 측정항목 데이터가 보고됩니다. 대안으로 INFORMATION_SCHEMA의 예약 정보를 쿼리하는 것이 좋습니다.
|
| BigQuery | Slots used by project in reservation |
슬롯 | 예약에서 프로젝트에 할당된 BigQuery 슬롯 수입니다. |
| BigQuery 연속 작업 | Estimated backlog logical bytes |
바이트 | 연속 작업의 각 단계에 대한 백로그의 바이트 수입니다. |
| BigQuery 연속 작업 | Estimated backlog records |
레코드 | 연속 작업의 각 단계에 대해 예상되는 백로그 레코드 수입니다. |
| BigQuery 연속 작업 | Estimated bytes processed |
바이트 | 연속 작업의 각 단계에서 처리된 예상 바이트 수입니다. |
| BigQuery 연속 작업 | Output watermark |
타임스탬프 | 에포크 이후 이 연속 작업 단계에서 모든 데이터가 처리될 때까지의 가장 최근 타임스탬프(마이크로초)입니다. |
| BigQuery 연속 작업 | Records read |
레코드 | 연속 작업의 각 단계에서 읽은 입력 레코드 수입니다. |
| BigQuery 연속 작업 | Records written |
레코드 | 연속 작업의 각 단계에 대해 작성된 출력 레코드 수입니다. |
| BigQuery 연속 작업 | Slots used |
슬롯 밀리초 | 연속 작업에서 사용한 총 슬롯 밀리초입니다. |
| BigQuery 데이터 세트 | Stored bytes |
바이트 | 데이터 세트에 저장된 바이트 수 - 데이터 세트에서 가장 큰 100개의 테이블에 대해 각 테이블의 저장된 바이트 수가 테이블 이름별로 표시됩니다. 데이터 세트의 가장 큰 테이블 100개를 제외한 모든 추가 테이블은 단일 합계로 보고되고 요약의 테이블 이름은 빈 문자열입니다. |
| BigQuery 데이터 세트 | Table count |
테이블 | 데이터 세트의 테이블 수입니다. |
| BigQuery 데이터 세트 | Uploaded bytes |
분당 바이트 수 | 데이터 세트의 모든 테이블로 업로드된 바이트 수입니다. |
| BigQuery 데이터 세트 | 업로드된 행 | 분당 행 수 | 데이터 세트의 모든 테이블로 업로드된 레코드의 수입니다. |
사용 가능한 Google Cloud 측정항목의 전체 목록은 Google Cloud 측정항목을 참조하세요.
알려진 문제
실행 중인 쿼리가 없으면 할당된 슬롯, 사용 가능한 슬롯, 기타 쿼리 관련 변수에 대한 데이터가 반환되지 않습니다. 데이터를 보려면 표시 영역을 축소해야 합니다.
쿼리가 US와 EU 모두에서 실행되는 경우 할당된 슬롯과 사용 가능한 슬롯이 정확하지 않을 수 있습니다.
할당된 슬롯은 특정 기간의 평균값으로 보고됩니다(기간 길이는 차트의 확대/축소 수준에 따라 다름). 확대 및 축소 수준에 따라 할당된 슬롯 값이 바뀔 수 있습니다. 1시간 이하의 기간으로 확대하면 실제 할당된 슬롯 값이 표시됩니다. 차트에 표시되는 시간 범위는
avg(slots allocated) = slots allocated입니다.Cloud Monitoring 차트의 데이터는 선택한 프로젝트에만 적용됩니다.
측정항목은 특정 시점에 샘플링되는 일회성 값이며 샘플 간격 사이에 데이터 포인트가 누락될 수 있습니다. 예를 들어 작업 수 측정항목은 1분마다 샘플링됩니다. 값은 특정 시점의 작업 수이며, 1분 전체의 최대 작업 수입니다.