本教學課程將說明如何使用 BigQuery ML 中的 k-means 模型,找出資料集中的叢集。
將資料分組成叢集的 k-means 演算法,是一種非監督式機器學習。監督式機器學習是關於預測性分析,而非監督式機器學習著重在描述性分析。非監督式機器學習可協助您瞭解資料,進而制定資料導向的決策。
本教學課程中的查詢使用地理空間分析服務提供的地理位置函式,詳情請參閱「地理空間數據分析簡介」。
本教學課程使用倫敦自行車租用公開資料集。資料包括租用開始和結束的時間戳記、車站名稱,以及騎乘時間。
目標
本教學課程會逐步引導您完成下列工作:- 檢查用於訓練模型的資料。
- 建立 k-means 分群模型。
- 使用 BigQuery ML 的叢集視覺化功能,解讀產生的資料叢集。
- 在 k-means 模型上執行
ML.PREDICT函式,預測一組自行車租借站可能屬於哪個叢集。
費用
本教學課程使用 Google Cloud的計費元件,包括:
- BigQuery
- BigQuery ML
如要瞭解 BigQuery 費用,請參閱 BigQuery 定價頁面。
如要瞭解 BigQuery ML 費用,請參閱 BigQuery ML 定價。
事前準備
- Sign in to your Google Cloud account. If you're new to Google Cloud, create an account to evaluate how our products perform in real-world scenarios. New customers also get $300 in free credits to run, test, and deploy workloads.
-
In the Google Cloud console, on the project selector page, select or create a Google Cloud project.
-
Verify that billing is enabled for your Google Cloud project.
-
In the Google Cloud console, on the project selector page, select or create a Google Cloud project.
-
Verify that billing is enabled for your Google Cloud project.
- 新專案會自動啟用 BigQuery。如要在現有的專案中啟用 BigQuery,請前往
Enable the BigQuery API.
如要建立資料集,您需要
bigquery.datasets.createIAM 權限。如要建立模型,您必須具備下列權限:
bigquery.jobs.createbigquery.models.createbigquery.models.getDatabigquery.models.updateData
如要執行推論,您需要下列權限:
bigquery.models.getDatabigquery.jobs.create
所需權限
如要進一步瞭解 BigQuery 中的 IAM 角色和權限,請參閱「IAM 簡介」。
建立資料集
建立 BigQuery 資料集來儲存 k-means 模型:
前往 Google Cloud 控制台的「BigQuery」頁面。
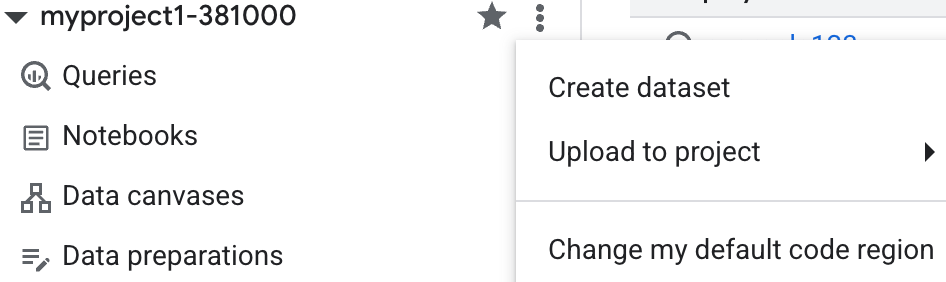
在「Explorer」窗格中,按一下專案名稱。
依序點按 「View actions」(查看動作) >「Create dataset」(建立資料集)。
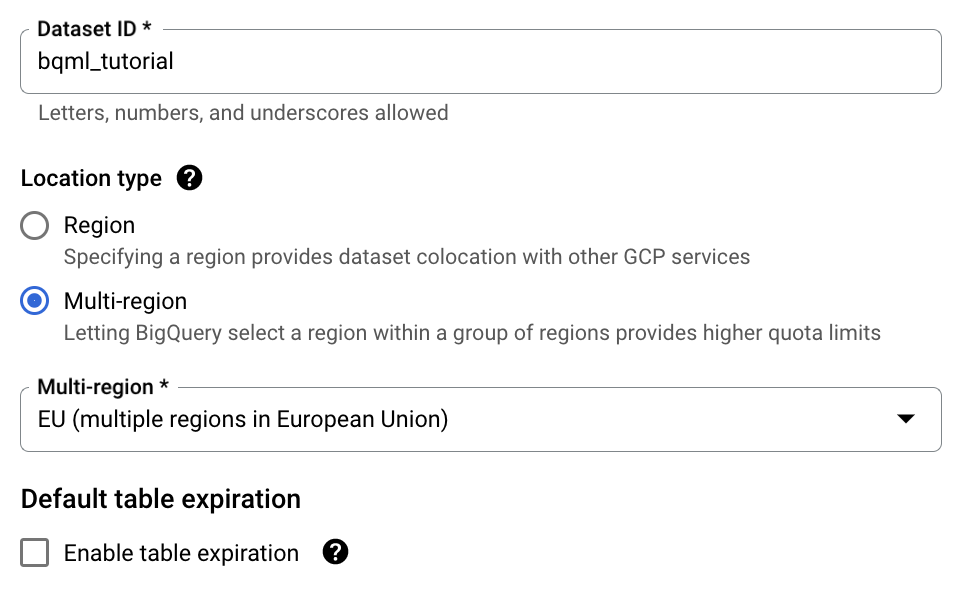
在「建立資料集」頁面中,執行下列操作:
在「Dataset ID」(資料集 ID) 中輸入
bqml_tutorial。針對「Location type」(位置類型) 選取「Multi-region」(多區域),然後選取「EU (multiple regions in European Union)」(歐盟 (多個歐盟區域))。
倫敦自行車租用公開資料集存放在
EU多地區。資料集必須位於相同位置。其餘設定保留預設值,然後點選「建立資料集」。
檢查訓練資料
檢查要用來訓練 k-means 模型的資料。在本教學課程中,您將根據下列屬性來將自行車站分群:
- 租用時間
- 每日租用次數
- 距市中心的距離
SQL
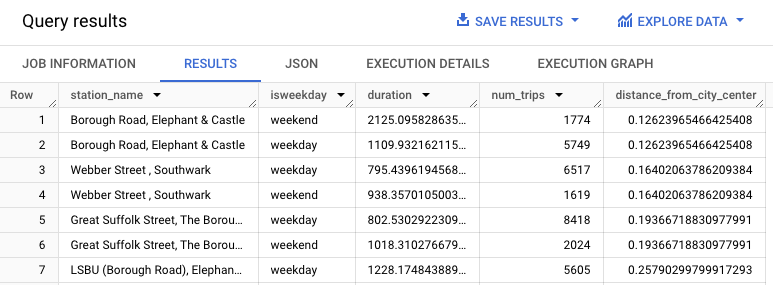
這項查詢會擷取自行車的租用資料 (包括 start_station_name 和 duration 資料欄),並將該資料與車站資訊結合。這包括建立計算結果欄,其中包含車站與市中心的距離。然後,查詢會計算 stationstats 資料欄中的車站屬性 (包括平均騎乘時間和租用次數),以及計算出的 distance_from_city_center 資料欄。
請按照下列步驟檢查訓練資料:
前往 Google Cloud 控制台的「BigQuery」頁面。
在查詢編輯器中貼上以下查詢,然後點選「執行」:
WITH
hs AS (
  SELECT
    h.start_station_name AS station_name,
    IF(
      EXTRACT(DAYOFWEEK FROM h.start_date) = 1
        OR EXTRACT(DAYOFWEEK FROM h.start_date) = 7,
      'weekend',
      'weekday') AS isweekday,
    h.duration,
    ST_DISTANCE(ST_GEOGPOINT(s.longitude, s.latitude), ST_GEOGPOINT(-0.1, 51.5)) / 1000
      AS distance_from_city_center
  FROM
    `bigquery-public-data.london_bicycles.cycle_hire` AS h
  JOIN
    `bigquery-public-data.london_bicycles.cycle_stations` AS s
    ON
      h.start_station_id = s.id
  WHERE
    h.start_date
    BETWEEN CAST('2015-01-01 00:00:00' AS TIMESTAMP)
    AND CAST('2016-01-01 00:00:00' AS TIMESTAMP)
),
stationstats AS (
  SELECT
    station_name,
    isweekday,
    AVG(duration) AS duration,
    COUNT(duration) AS num_trips,
    MAX(distance_from_city_center) AS distance_from_city_center
  FROM
    hs
  GROUP BY
    station_name, isweekday
)
SELECT *
FROM
stationstats
ORDER BY
distance_from_city_center ASC;
結果應如下所示:
BigQuery DataFrames
在嘗試這個範例之前,請按照使用 BigQuery DataFrames 的 BigQuery 快速入門導覽課程中的 BigQuery DataFrames 設定說明操作。 詳情請參閱 BigQuery DataFrames 參考說明文件。
如要驗證 BigQuery,請設定應用程式預設憑證。 詳情請參閱「為本機開發環境設定 ADC」。
建立 k-means 模型
使用倫敦自行車租用訓練資料建立 k-means 模型。
SQL
在下列查詢中,CREATE MODEL 陳述式會指定要使用的叢集數量 (四個)。在 SELECT 陳述式中,EXCEPT 子句會排除 station_name 資料欄,因為這個資料欄不含特徵。該查詢會為每個 station_name 建立專屬的資料列,至於 SELECT 陳述式中則僅會納入特徵。
請按照下列步驟建立 k-means 模型:
前往 Google Cloud 控制台的「BigQuery」頁面。
在查詢編輯器中貼上以下查詢,然後點選「執行」:
CREATE OR REPLACE MODEL `bqml_tutorial.london_station_clusters`
OPTIONS (
  model_type = 'kmeans',
  num_clusters = 4)
AS
WITH
hs AS (
  SELECT
    h.start_station_name AS station_name,
    IF(
      EXTRACT(DAYOFWEEK FROM h.start_date) = 1
        OR EXTRACT(DAYOFWEEK FROM h.start_date) = 7,
      'weekend',
      'weekday') AS isweekday,
    h.duration,
    ST_DISTANCE(ST_GEOGPOINT(s.longitude, s.latitude), ST_GEOGPOINT(-0.1, 51.5)) / 1000
      AS distance_from_city_center
  FROM
    `bigquery-public-data.london_bicycles.cycle_hire` AS h
  JOIN
    `bigquery-public-data.london_bicycles.cycle_stations` AS s
    ON
      h.start_station_id = s.id
  WHERE
    h.start_date
    BETWEEN CAST('2015-01-01 00:00:00' AS TIMESTAMP)
    AND CAST('2016-01-01 00:00:00' AS TIMESTAMP)
),
stationstats AS (
  SELECT
    station_name,
    isweekday,
    AVG(duration) AS duration,
    COUNT(duration) AS num_trips,
    MAX(distance_from_city_center) AS distance_from_city_center
  FROM
    hs
  GROUP BY
    station_name, isweekday
)
SELECT *
EXCEPT (station_name, isweekday)
FROM
stationstats;
BigQuery DataFrames
在嘗試這個範例之前,請按照使用 BigQuery DataFrames 的 BigQuery 快速入門導覽課程中的 BigQuery DataFrames 設定說明操作。 詳情請參閱 BigQuery DataFrames 參考說明文件。
如要驗證 BigQuery,請設定應用程式預設憑證。 詳情請參閱「為本機開發環境設定 ADC」。
解讀資料叢集
模型「評估」分頁中的資訊可協助您解讀模型產生的叢集。
如要查看模型的評估資訊,請按照下列步驟操作:
前往 Google Cloud 控制台的「BigQuery」頁面。
在「Explorer」窗格中,依序展開專案、「
bqml_tutorial」資料集和「Models」資料夾。選取「
london_station_clusters」模型。選取「評估」分頁標籤。這個分頁會顯示 k-means 模型識別出的叢集視覺化資料。在「數值特徵」部分,長條圖會顯示每個群集中心最重要的數值特徵值。每個質心代表一組資料叢集。你可以從下拉式選單中選取要顯示的特徵。
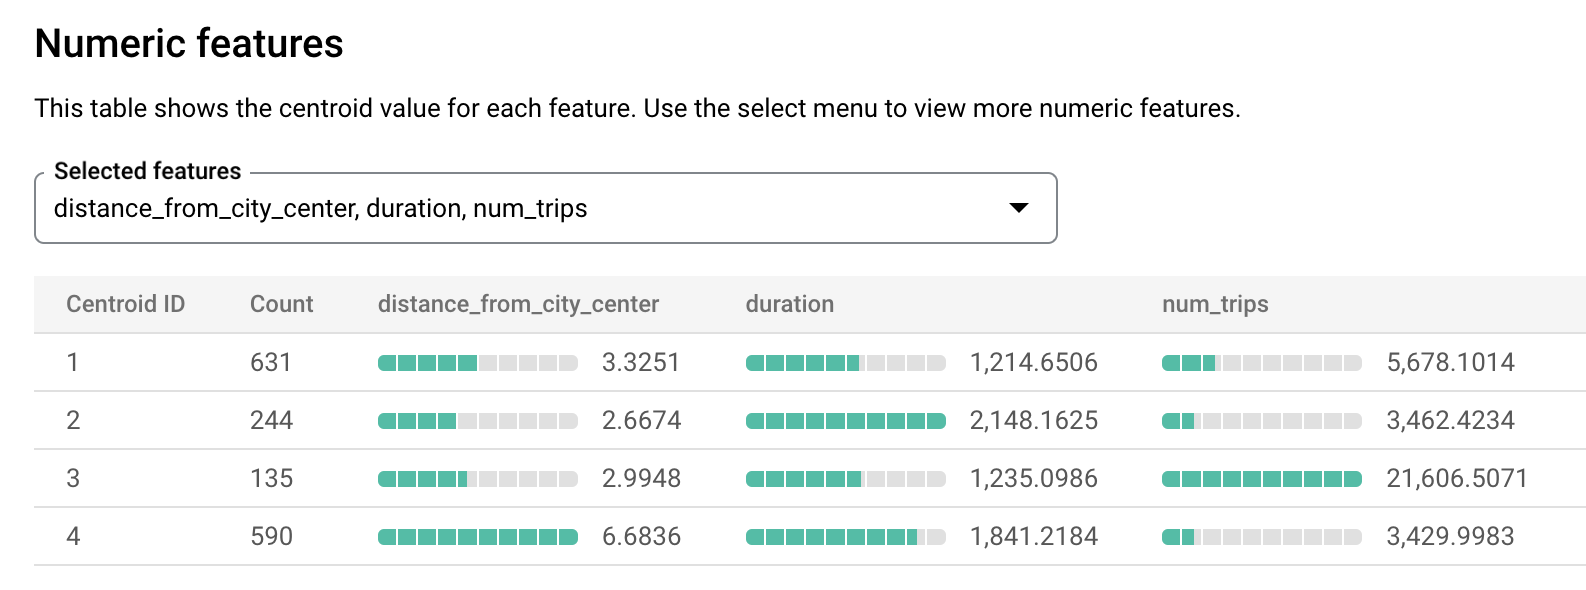
這個模型會建立下列質心:
- 重心 1 顯示較不繁忙的市區車站,租借時間較短。
- 重心 2 顯示第二個城市車站,這個車站較不繁忙,且租用時間較長。
- 中心點 3 顯示繁忙的市區車站,靠近市中心。
- 重心 4 顯示郊區車站,騎乘時間較長。
如果您經營自行車租賃業務,可以運用這項資訊制定業務決策。例如:
假設您需要實驗某個新的鎖,您應該要選擇哪個車站叢集來做為實驗對象呢?centroid 1、centroid 2 或 centroid 4 中的車站似乎是合乎邏輯的選擇,因為這些車站並非最繁忙的車站。
假設您想要在某些車站擺放競速自行車,您應該要選擇哪些車站呢?質心 4 是距市中心最遠的車站群組,且騎乘距離最長。因此這些可以成為擺放競速自行車的候選車站。
使用 ML.PREDICT 函式預測車站的叢集
使用 ML.PREDICT SQL 函式或 predict BigQuery DataFrames 函式,找出特定車站所屬的叢集。
SQL
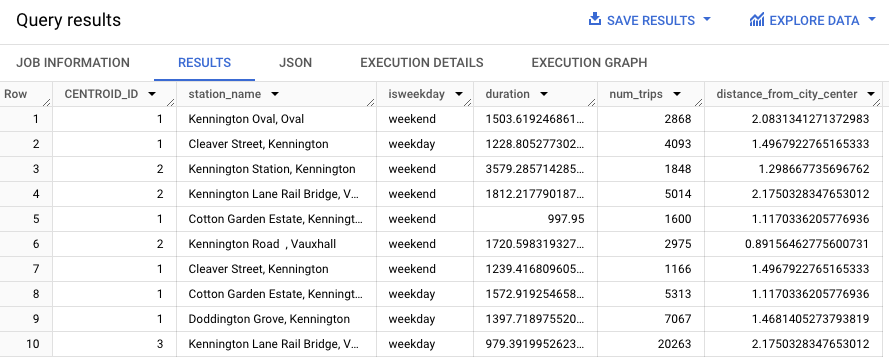
下列查詢會使用 REGEXP_CONTAINS 函式,找出 station_name 資料欄中包含字串 Kennington 的所有項目。ML.PREDICT 函式會使用這些值,來預測哪些叢集可能包含這些車站。
如要預測每個名稱有 Kennington 字串的車站所屬的叢集,請按照下列步驟操作:
前往 Google Cloud 控制台的「BigQuery」頁面。
在查詢編輯器中貼上以下查詢,然後點選「執行」:
WITH
hs AS (
  SELECT
    h.start_station_name AS station_name,
    IF(
      EXTRACT(DAYOFWEEK FROM h.start_date) = 1
        OR EXTRACT(DAYOFWEEK FROM h.start_date) = 7,
      'weekend',
      'weekday') AS isweekday,
    h.duration,
    ST_DISTANCE(ST_GEOGPOINT(s.longitude, s.latitude), ST_GEOGPOINT(-0.1, 51.5)) / 1000
      AS distance_from_city_center
  FROM
    `bigquery-public-data.london_bicycles.cycle_hire` AS h
  JOIN
    `bigquery-public-data.london_bicycles.cycle_stations` AS s
    ON
      h.start_station_id = s.id
  WHERE
    h.start_date
    BETWEEN CAST('2015-01-01 00:00:00' AS TIMESTAMP)
    AND CAST('2016-01-01 00:00:00' AS TIMESTAMP)
),
stationstats AS (
  SELECT
    station_name,
    isweekday,
    AVG(duration) AS duration,
    COUNT(duration) AS num_trips,
    MAX(distance_from_city_center) AS distance_from_city_center
  FROM
    hs
  GROUP BY
    station_name, isweekday
)
SELECT *
EXCEPT (nearest_centroids_distance)
FROM
ML.PREDICT(
  MODEL `bqml_tutorial.london_station_clusters`,
  (
    SELECT *
    FROM
      stationstats
    WHERE
      REGEXP_CONTAINS(station_name, 'Kennington')
  ));
結果應如下所示。
BigQuery DataFrames
在嘗試這個範例之前,請按照使用 BigQuery DataFrames 的 BigQuery 快速入門導覽課程中的 BigQuery DataFrames 設定說明操作。 詳情請參閱 BigQuery DataFrames 參考說明文件。
如要驗證 BigQuery,請設定應用程式預設憑證。 詳情請參閱「為本機開發環境設定 ADC」。
清除所用資源
如要避免系統向您的 Google Cloud 帳戶收取本教學課程中所用資源的相關費用,請刪除含有該項資源的專案,或者保留專案但刪除個別資源。
- 您可以刪除建立的專案。
- 或者您可以保留專案並刪除資料集。
刪除資料集
刪除專案將移除專案中所有的資料集與資料表。若您希望重新使用專案,您可以刪除本教學課程中所建立的資料集。
如有必要,請在Google Cloud 控制台中開啟 BigQuery 頁面。
在導覽窗格中,按一下您建立的 bqml_tutorial 資料集。
按一下視窗右側的「刪除資料集」。 這個動作會刪除資料集和模型。
在「Delete dataset」(刪除資料集) 對話方塊中,輸入資料集的名稱 (
bqml_tutorial),然後按一下「Delete」(刪除) 來確認刪除指令。
刪除專案
如要刪除專案,請進行以下操作:
- In the Google Cloud console, go to the Manage resources page.
- In the project list, select the project that you want to delete, and then click Delete.
- In the dialog, type the project ID, and then click Shut down to delete the project.
後續步驟
- 如需 BigQuery ML 的總覽,請參閱 BigQuery ML 簡介。
- 如要瞭解如何建立模型,請參閱
CREATE MODEL語法頁面。