使用预定查询设置提醒
本文档介绍如何使用 BigQuery 预定查询设置提醒。此方法支持由查询逻辑定义的自定义应用场景。
准备工作
在使用 Cloud Monitoring 之前,请确保您具有以下各项:
- Cloud Billing 账号。
- 启用了结算功能的 BigQuery 项目。
确保以上两个条件同时满足的一种方法是完成快速入门:使用 Google Cloud 控制台。
创建 SQL 查询
在 BigQuery 中创建并运行 SQL 查询,以生成提醒的输出。查询会捕获您要监控的逻辑。 如需了解详情,请参阅运行查询。
设置预定查询
您可以安排查询定期运行,运行频率从每 15 分钟一次到每隔几个月一次不等。您可以针对日志存储桶编写任何查询。如需了解详情,请参阅安排查询。
了解行数指标
预定查询会在 Cloud Monitoring 中自动创建指标。此指标用于记录 SQL 查询在上次评估期间返回的行数。您可以在 Monitoring 中创建用于监控此行数指标的提醒政策。
以下指标是一个计量标准,其中包含预定查询的最新行数:
bigquerydatatransfer.googleapis.com/transfer_config/last_execution_job_rows
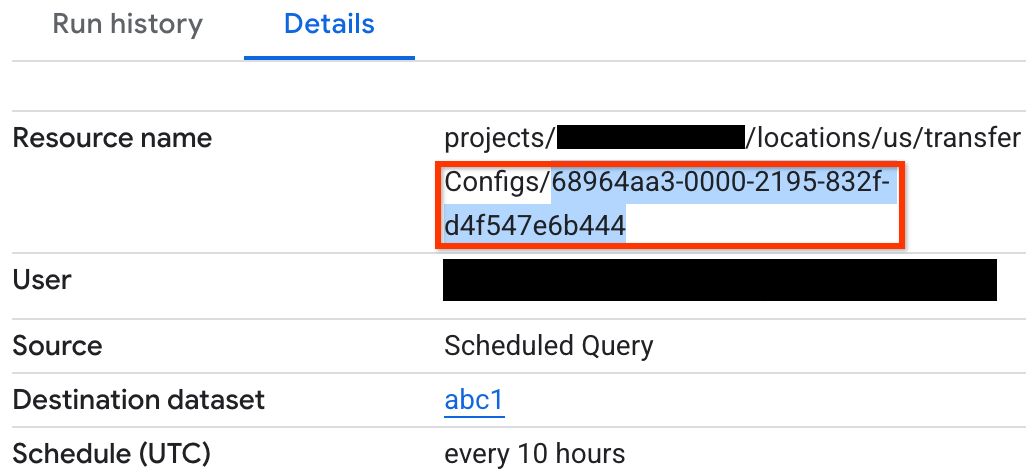
所有预定查询都会使用不同的标签将行数写入此指标。定义提醒政策时,您需要 config_id 标签。如需查找 config_id 标签,请按照以下步骤操作:
在 Google Cloud 控制台中,前往预定查询页面:
点击要为其创建提醒的预定查询。
点击详细信息标签页。
检查资源名称中的最后一个字符串,如以下屏幕截图所示:
如果预定查询出现问题,系统会在预定查询的运行历史记录标签页中显示一条错误消息。
监控预定查询
监控预定查询,确保成功执行:
- 在预定查询的运行历史记录标签页中查找错误。
- 检查存储在
bigquerydatatransfer.googleapis.com/transfer_config/completed_runs指标的completion_state字段中的每个预定执行的最终状态。 - 在 BigQuery Data Transfer Service 日志中查找错误。
创建提醒政策
使用指标阈值提醒来检测预定查询返回的行数何时与阈值不同。
如需针对预定查询返回的行数设置提醒,请按照以下步骤操作:
-
在 Google Cloud 控制台中,前往 notifications 提醒页面:
如果您使用搜索栏查找此页面,请选择子标题为监控的结果。
点击创建政策。
为预定查询选择行数指标。在选择指标菜单中,依次点击 BigQuery DTS 配置 > Transfer_config > 上次执行的作业行数。
在添加过滤条件中,点击添加过滤条件。
在过滤条件菜单中,选择 config_id。
在值菜单中,选择要为其创建提醒的预定查询的
config_id: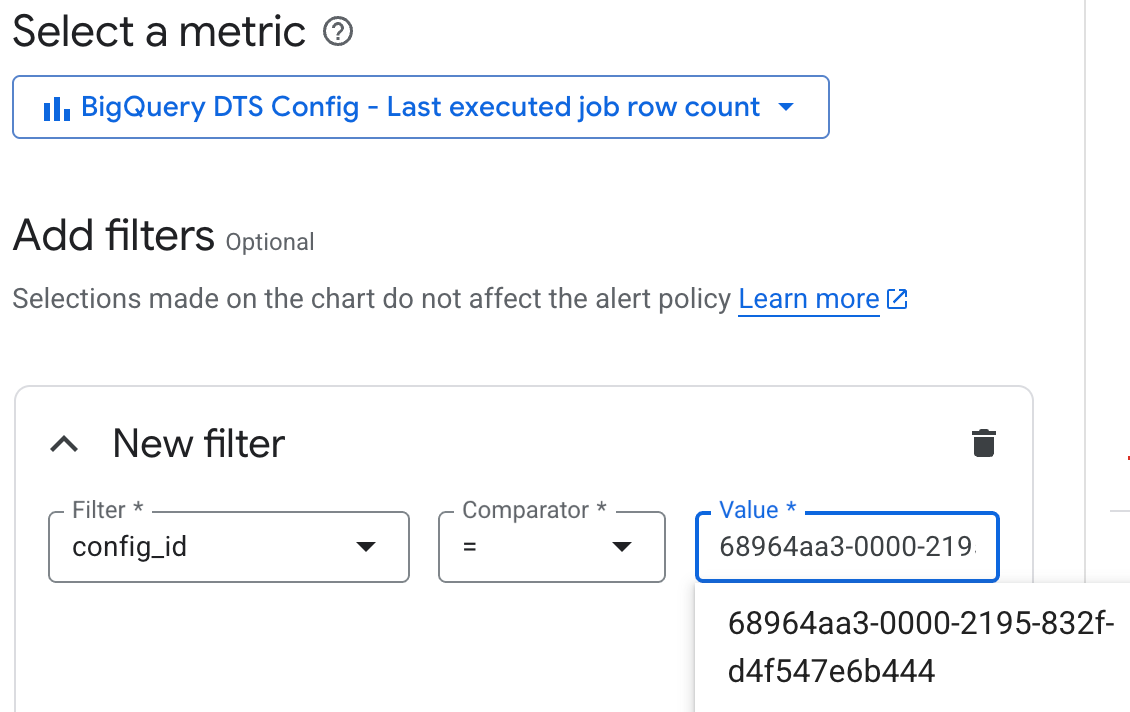
如果您不设置过滤条件,则提醒会测试每个预定查询的输出。如需查找预定查询的
config_id,请参阅了解行数指标。保留默认的转换数据设置,然后点击下一步。
对于条件类型,选择阈值。
选择所需的条件。例如,如需在查询返回任何行时触发提醒,请设置以下条件:
- 在提醒触发器部分,选择任何时序违反。
- 在阈值位置部分,选择高于阈值。
- 在阈值中,输入
0。
保留默认的高级选项,然后点击下一步。
可选:如需为提醒配置通知,请点击使用通知渠道切换开关,然后为通知设置渠道和主题行。您还可以设置突发事件关闭通知。
如果您不想接收通知,请取消选择使用通知渠道切换开关。
可选:如果您有许多提醒政策,可以为其添加注释标签,以表明它们源自预定查询。
可选:在文档字段中,您可以添加有助于解读提醒的链接。例如,您可以添加一个指向 Logs Explorer 页面的链接,其中包含类似的查询,以便您可以探索触发了相应提醒的数据。您还可以链接到特定预定查询的详细信息页面。
在为提醒政策命名中,输入提醒的名称。
点击创建政策。
限制
针对预定查询的提醒政策受限于以下限制:
- 预定查询执行频率和注入延迟会影响从日志发出到收到提醒的总时间。例如,如果您的查询每 30 分钟运行一次,并且您为注入延迟添加了 15 分钟的延迟时间,那么在发出违规日志条目后大约 15 分钟,系统就会触发提醒。在某些情况下,可能需要长达 45 分钟的时间。
- 预定查询与提醒政策之间的配置不会关联或同步。在一个位置修改配置可能会破坏启用提醒功能的关系。
后续步骤
- 了解如何创建和运行预定查询。