Mantieni tutto organizzato con le raccolte
Salva e classifica i contenuti in base alle tue preferenze.
Configurare avvisi con query pianificate
Questo documento descrive come configurare un avviso utilizzando una query pianificata BigQuery. Questo approccio supporta i casi d'uso personalizzati definiti dalla logica delle query.
Prima di iniziare
Prima di utilizzare Cloud Monitoring, assicurati di disporre di quanto segue:
Crea ed esegui una query SQL in BigQuery che generi l'output per l'avviso. La query acquisisce la logica che vuoi monitorare.
Per maggiori informazioni, vedi Eseguire una query.
Configurare una query programmata
Puoi pianificare l'esecuzione delle query su base ricorrente, da ogni 15 minuti
a ogni diversi mesi. Puoi scrivere qualsiasi query sui bucket di log. Per ulteriori
informazioni, consulta la sezione Pianificazione delle query.
Informazioni sulla metrica Conteggio righe
Le query pianificate creano automaticamente una metrica in Cloud Monitoring. Questa
metrica registra il numero di righe restituite dalla query SQL durante l'ultima
valutazione. Puoi creare un criterio di avviso che monitora questa metrica del conteggio delle righe
in Monitoring.
La seguente metrica
è un indicatore che contiene il conteggio delle righe più recente di una query pianificata:
Tutte le query pianificate scrivono il conteggio delle righe in questa metrica, utilizzando etichette diverse. Quando definisci un criterio di avviso, devi utilizzare l'etichetta config_id. Per trovare l'etichetta config_id, segui questi passaggi:
Nella console Google Cloud , vai alla pagina Query programmate:
Fai clic sulla query programmata per cui vuoi creare un avviso.
Vai alla scheda Dettagli.
Controlla l'ultima stringa in Nome risorsa, come mostrato nello
screenshot seguente:
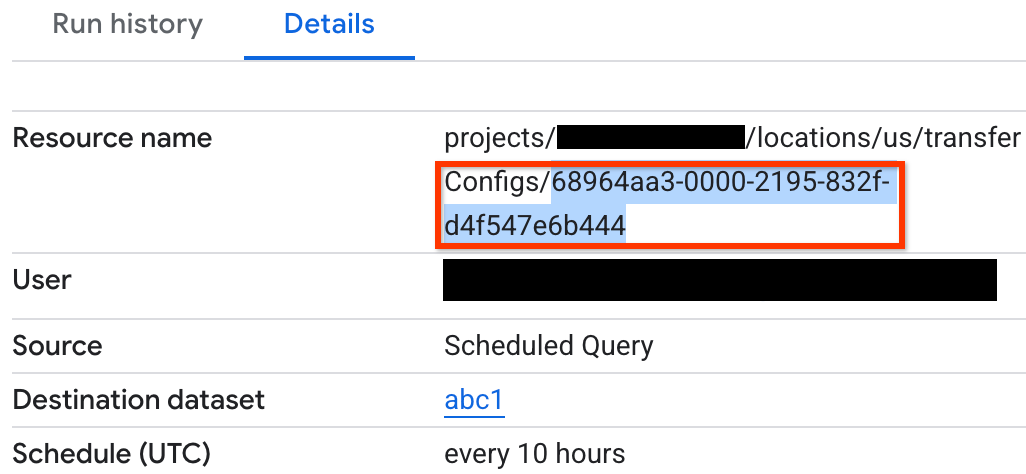
Se si verifica un problema con la query pianificata, viene visualizzato un messaggio di errore nella scheda
Cronologia esecuzioni della query pianificata.
Monitorare le query pianificate
Monitora le query pianificate per assicurarti che vengano eseguite correttamente:
Controlla la presenza di errori nella scheda Cronologia esecuzioni della query pianificata.
Se utilizzi la barra di ricerca per trovare questa pagina, seleziona il risultato con il sottotitolo
Monitoring.
Fai clic su Crea criterio.
Seleziona la metrica del conteggio delle righe per la query pianificata. Nel menu
Seleziona una metrica, fai clic su Configurazione DTS BigQuery > Transfer_config > Conteggio righe dell'ultimo job eseguito.
In Aggiungi filtri, fai clic su Aggiungi un filtro.
Nel menu Filtro, seleziona config_id.
Nel menu Valore, seleziona il config_id della query pianificata per cui vuoi creare un avviso:
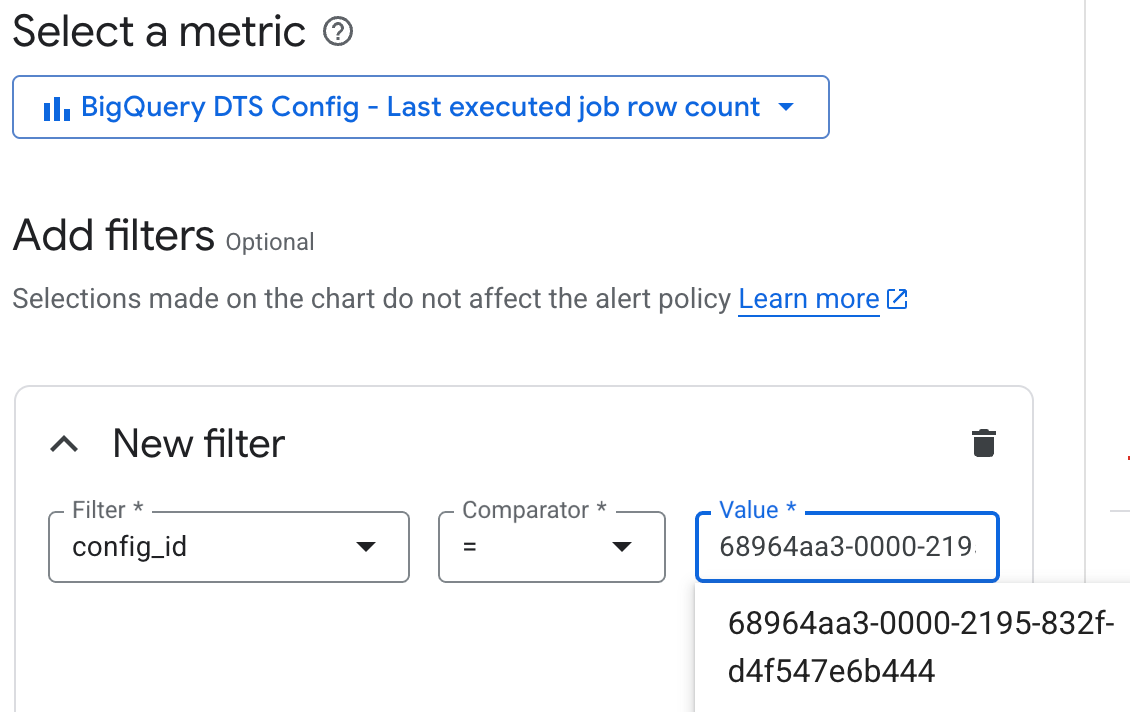
Se non imposti un filtro, l'avviso verifica l'output di ogni query pianificata. Per trovare il config_id della query pianificata, consulta
Informazioni sulla metrica Conteggio righe.
Mantieni le impostazioni predefinite di Trasforma i dati e fai clic su Avanti.
Per Tipi di condizione, seleziona Soglia.
Seleziona la condizione che preferisci. Ad esempio, per attivare il trigger quando la query
restituisce righe, imposta la seguente condizione:
Per Attivatore di avvisi, seleziona Qualsiasi violazione della serie temporale.
In Posizione soglia, seleziona Sopra la soglia.
In Valore soglia, inserisci 0.
Mantieni le Opzioni avanzate predefinite e fai clic su Avanti.
(Facoltativo) Per configurare le notifiche per l'avviso, fai clic sul pulsante di attivazione/disattivazione
Usa canale di notifica, quindi imposta i canali e l'oggetto
per le notifiche. Puoi anche impostare notifiche per la chiusura degli incidenti.
Se non vuoi ricevere notifiche, deseleziona il pulsante di attivazione/disattivazione Usa canale di notifica.
(Facoltativo) Se hai molte norme di avviso, puoi annotare le etichette
per indicare che derivano da query pianificate.
(Facoltativo) Nel campo Documentazione, puoi aggiungere link che aiutano a
interpretare l'avviso. Ad esempio, puoi aggiungere un link alla pagina Esplora log con una query simile, in modo da poter esplorare i dati che hanno generato l'avviso. Puoi anche inserire un link alla pagina dei dettagli della query di pianificazione specifica.
In Assegna un nome alla policy di avviso, inserisci un nome per l'avviso.
Fai clic su Crea criterio.
Limitazioni
I criteri di avviso per le query pianificate sono soggetti alle seguenti limitazioni:
La frequenza di esecuzione delle query pianificate e il ritardo di importazione influiscono sul tempo totale
dall'emissione del log all'avviso. Ad esempio, se la query viene eseguita ogni 30 minuti
e aggiungi un ritardo di 15 minuti per l'importazione, l'avviso viene attivato
circa 15 minuti dopo l'emissione di una voce di log incriminata. In alcuni
casi, l'operazione potrebbe richiedere fino a 45 minuti.
La configurazione tra una query pianificata e un criterio di avviso non è collegata
o sincronizzata. La modifica della configurazione in un'unica posizione potrebbe interrompere la relazione che attiva la funzione di avviso.
[[["Facile da capire","easyToUnderstand","thumb-up"],["Il problema è stato risolto","solvedMyProblem","thumb-up"],["Altra","otherUp","thumb-up"]],[["Difficile da capire","hardToUnderstand","thumb-down"],["Informazioni o codice di esempio errati","incorrectInformationOrSampleCode","thumb-down"],["Mancano le informazioni o gli esempi di cui ho bisogno","missingTheInformationSamplesINeed","thumb-down"],["Problema di traduzione","translationIssue","thumb-down"],["Altra","otherDown","thumb-down"]],["Ultimo aggiornamento 2025-09-04 UTC."],[],[],null,["# Set up alerts with scheduled queries\n====================================\n\nThis document describes how to set up an alert using a BigQuery\nscheduled query. This approach supports custom use cases defined by query logic.\n\nBefore you begin\n----------------\n\nBefore you use Cloud Monitoring, ensure that you have the following:\n\n- A Cloud Billing account.\n- A BigQuery project with billing enabled.\n\nOne way to ensure that you have both is to complete the\n[Quickstart using the Google Cloud console](/bigquery/docs/quickstarts/query-public-dataset-console#before-you-begin).\n\nCreate a SQL query\n------------------\n\nCreate and run a SQL query in BigQuery that generates the\noutput for your alert. The query captures the logic that you want to monitor.\nFor more information, see [Run a query](/bigquery/docs/running-queries).\n\nSet up a scheduled query\n------------------------\n\nYou can schedule queries to run on a recurring basis, from every 15 minutes\nto every several months. You can write any query over your log buckets. For more\ninformation, see [Scheduling queries](/bigquery/docs/scheduling-queries).\n\n### Understand the row count metric\n\nScheduled queries automatically create a metric in Cloud Monitoring. This\nmetric records the number of rows that the SQL query returned during its last\nevaluation. You can create an alert policy that monitors this row count metric\nin Monitoring.\n\nThe following [metric](/monitoring/api/metrics_gcp_a_b#gcp-bigquerydatatransfer)\nis a gauge that contains the most recent row count of a scheduled query:\n\n`bigquerydatatransfer.googleapis.com/transfer_config/last_execution_job_rows`\n\nAll scheduled queries write their row count to this metric, using different labels. You need the `config_id` label when you define an alert policy. To find the `config_id` label, follow these steps:\n\n1. In Google Cloud console, go to the **Scheduled queries** page:\n\n [Go to Scheduled queries](https://console.cloud.google.com/bigquery/scheduled-queries)\n2. Click the scheduled query for which you want to create an alert.\n\n3. Go to the **Details** tab.\n\n4. Check the last string in **Resource name**, as shown in the following\n screenshot:\n\n| **Note:** The last known value for the row count repeats continuously for 5 weeks. If you deactivate a scheduled query or the query fails, the metric remains constant at its last known value for 35 days. After 35 days, the metric disappears.\n\nIf a problem occurs with the scheduled query, an error message appears in the\n**Run history** tab of your scheduled query.\n\n### Monitor scheduled queries\n\nMonitor scheduled queries to ensure successful executions:\n\n- Look for errors in the **Run history** tab of the scheduled query.\n- Check the final status of each scheduled execution that is stored in the `completion_state` field of the [`bigquerydatatransfer.googleapis.com/transfer_config/completed_runs` metric](/monitoring/api/metrics_gcp_a_b#gcp-bigquerydatatransfer).\n- Look for errors in the [BigQuery Data Transfer Service logs](/bigquery/docs/dts-monitor#logs).\n\nCreate an alert policy\n----------------------\n\nUse a [metric-threshold alert](/monitoring/alerts/using-alerting-ui) to detect\nwhen the number of rows returned by the scheduled query differs from a threshold.\n\nTo set up an alert on the number of rows a scheduled query returns, follow these\nsteps:\n\n1. In the Google Cloud console, go to the\n *notifications* **Alerting** page:\n\n [Go to **Alerting**](https://console.cloud.google.com/monitoring/alerting)\n\n \u003cbr /\u003e\n\n If you use the search bar to find this page, then select the result whose subheading is\n **Monitoring**.\n2. Click **Create policy**.\n\n3. Select the row count metric for the scheduled query. In the\n **Select a metric** menu, click **BigQuery DTS Config \\\u003e Transfer_config \\\u003e Last executed job row count**.\n\n4. In **Add filters** , click **Add a filter**.\n\n5. In the **Filter** menu, select **config_id**.\n\n6. In the **Value** menu, select the `config_id` of the scheduled query for\n which you want to create an alert:\n\n If you don't set a filter, your alert tests the output of every scheduled\n query. To find the `config_id` of your scheduled query, see\n [Understand the row count metric](#understand_the_row_count_metric).\n7. Keep the default **Transform data** settings and click **Next**.\n\n8. For **Condition types** , select **Threshold**.\n\n9. Select the condition that you want. For example, to trigger when the query\n returns any rows, set the following condition:\n\n 1. For **Alert trigger** , select **Any time series violates**.\n 2. For **Threshold position** , select **Above threshold**.\n 3. In **Threshold value** , enter `0`.\n10. Keep the default **Advanced Options** and click **Next**.\n\n11. Optional: To configure notifications for your alert, click the\n **Use notification channel** toggle, and then set channels and subject line\n for your notifications. You can also set notifications for incident closure.\n\n If you don't want notifications, deselect the **Use notification channel**\n toggle.\n12. Optional: If you have many alert policies, you can [annotate labels](/monitoring/alerts/labels)\n on them to indicate that they are derived from scheduled queries.\n\n13. Optional: In the **Documentation** field, you can add links that help to\n interpret the alert. For example, you can add a link to the **Logs Explorer**\n page with a similar query, so that you can explore the data that raised the\n alert. You can also link to the specific schedule query's details page.\n\n14. In **Name the alert policy**, enter a name for your alert.\n\n15. Click **Create Policy**.\n\nLimitations\n-----------\n\nAlert policies for scheduled queries are subject to the following limitations:\n\n- Scheduled query execution frequency and ingestion delay impact the total time from log emission to alert. For example, if your query runs every 30 minutes and you add a 15-minute lag for ingestion delay, your alert fires approximately 15 minutes after an offending log entry is emitted. In some cases, it might take up to 45 minutes.\n- The configuration between a scheduled query and an alert policy isn't linked or synchronized. Editing the configuration in one place might break the relationship that enables the alert function.\n\nWhat's next\n-----------\n\n- Learn how to create and run [scheduled queries](/bigquery/docs/scheduling-queries)."]]