Tetap teratur dengan koleksi
Simpan dan kategorikan konten berdasarkan preferensi Anda.
Menyiapkan pemberitahuan dengan kueri terjadwal
Dokumen ini menjelaskan cara menyiapkan pemberitahuan menggunakan kueri terjadwal BigQuery. Pendekatan ini mendukung kasus penggunaan kustom yang ditentukan oleh logika kueri.
Sebelum memulai
Sebelum menggunakan Cloud Monitoring, pastikan Anda memiliki hal berikut:
Buat dan jalankan kueri SQL di BigQuery yang menghasilkan
output untuk pemberitahuan Anda. Kueri ini mencakup logika yang ingin Anda pantau.
Untuk mengetahui informasi selengkapnya, lihat Menjalankan kueri.
Menyiapkan kueri terjadwal
Anda dapat menjadwalkan kueri untuk dijalankan secara berulang, mulai dari setiap 15 menit hingga setiap beberapa bulan. Anda dapat menulis kueri apa pun di bucket log Anda. Untuk mengetahui informasi selengkapnya, lihat Menjadwalkan kueri.
Memahami metrik jumlah baris
Kueri terjadwal otomatis membuat metrik di Cloud Monitoring. Metrik
ini mencatat jumlah baris yang ditampilkan kueri SQL selama evaluasi
terakhirnya. Anda dapat membuat kebijakan pemberitahuan yang memantau metrik jumlah baris ini di Monitoring.
Metrik berikut
adalah pengukur yang berisi jumlah baris terbaru dari kueri terjadwal:
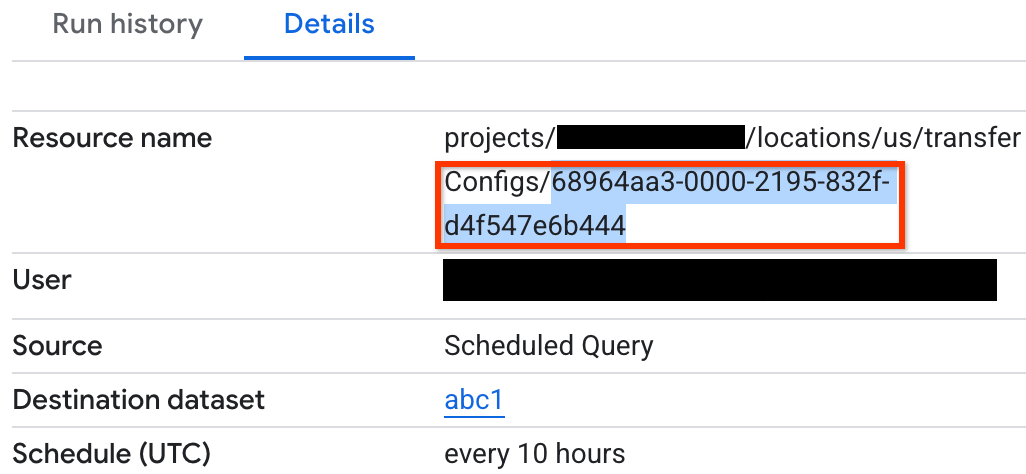
Semua kueri terjadwal menulis jumlah barisnya ke metrik ini, menggunakan label yang berbeda. Anda memerlukan label config_id saat menentukan kebijakan pemberitahuan. Untuk menemukan label config_id, ikuti langkah-langkah berikut:
Di konsol Google Cloud , buka halaman Kueri terjadwal:
Jika Anda menggunakan kotak penelusuran untuk menemukan halaman ini, pilih hasil yang subjudulnya adalah Monitoring.
Klik Create policy.
Pilih metrik jumlah baris untuk kueri terjadwal. Di menu
Select a metric, klik BigQuery DTS Config > Transfer_config > Last executed job row count.
Di Tambahkan filter, klik Tambahkan filter.
Di menu Filter, pilih config_id.
Di menu Nilai, pilih config_id kueri terjadwal yang ingin Anda buatkan pemberitahuan:
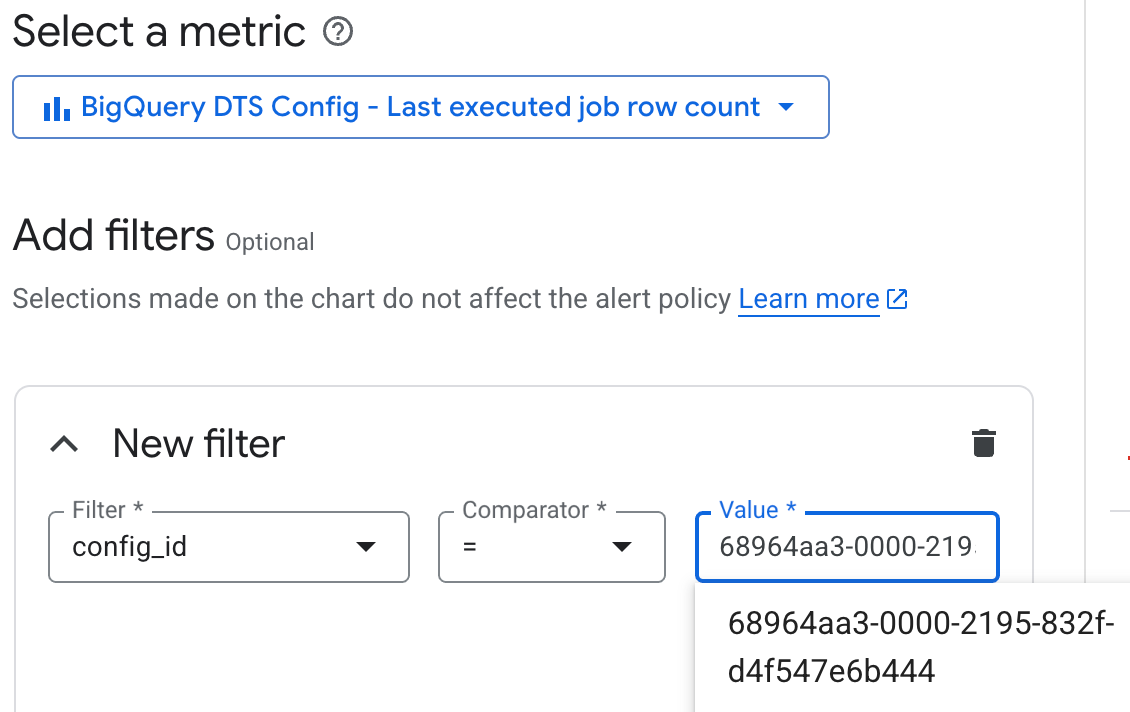
Jika Anda tidak menyetel filter, pemberitahuan akan menguji output setiap kueri
terjadwal. Untuk menemukan config_id kueri terjadwal, lihat
Memahami metrik jumlah baris.
Tetap gunakan setelan Transform data default, lalu klik Next.
Untuk Jenis kondisi, pilih Batas.
Pilih kondisi yang Anda inginkan. Misalnya, untuk memicu saat kueri menampilkan baris apa pun, tetapkan kondisi berikut:
Untuk Pemicu pemberitahuan, pilih Deret waktu mana pun melanggar.
Untuk Posisi nilai minimum, pilih Di atas nilai minimum.
Di Nilai minimum, masukkan 0.
Biarkan Opsi Lanjutan default dan klik Berikutnya.
Opsional: Untuk mengonfigurasi notifikasi untuk pemberitahuan, klik tombol
Gunakan saluran notifikasi, lalu tetapkan saluran dan baris subjek
untuk notifikasi Anda. Anda juga dapat menyetel notifikasi untuk penutupan insiden.
Jika Anda tidak ingin menerima notifikasi, hapus pilihan tombol Gunakan saluran notifikasi.
Opsional: Jika memiliki banyak kebijakan pemberitahuan, Anda dapat menganotasi label
pada kebijakan tersebut untuk menunjukkan bahwa kebijakan tersebut berasal dari kueri terjadwal.
Opsional: Di kolom Dokumentasi, Anda dapat menambahkan link yang membantu
menafsirkan pemberitahuan. Misalnya, Anda dapat menambahkan link ke halaman Logs Explorer dengan kueri serupa, sehingga Anda dapat menjelajahi data yang memicu pemberitahuan. Anda juga dapat menautkan ke halaman detail kueri jadwal tertentu.
Di Name the alert policy, masukkan nama untuk pemberitahuan Anda.
Klik Create Policy.
Batasan
Kebijakan pemberitahuan untuk kueri terjadwal tunduk pada batasan berikut:
Frekuensi eksekusi kueri terjadwal dan penundaan penyerapan memengaruhi total waktu dari emisi log hingga pemberitahuan. Misalnya, jika kueri Anda berjalan setiap 30 menit
dan Anda menambahkan jeda 15 menit untuk penundaan penyerapan, pemberitahuan akan diaktifkan
sekitar 15 menit setelah entri log yang melanggar dikeluarkan. Dalam beberapa
kasus, mungkin diperlukan waktu hingga 45 menit.
Konfigurasi antara kueri terjadwal dan kebijakan pemberitahuan tidak ditautkan
atau disinkronkan. Mengedit konfigurasi di satu tempat dapat merusak hubungan yang memungkinkan fungsi pemberitahuan.
[[["Mudah dipahami","easyToUnderstand","thumb-up"],["Memecahkan masalah saya","solvedMyProblem","thumb-up"],["Lainnya","otherUp","thumb-up"]],[["Sulit dipahami","hardToUnderstand","thumb-down"],["Informasi atau kode contoh salah","incorrectInformationOrSampleCode","thumb-down"],["Informasi/contoh yang saya butuhkan tidak ada","missingTheInformationSamplesINeed","thumb-down"],["Masalah terjemahan","translationIssue","thumb-down"],["Lainnya","otherDown","thumb-down"]],["Terakhir diperbarui pada 2025-09-04 UTC."],[],[],null,["# Set up alerts with scheduled queries\n====================================\n\nThis document describes how to set up an alert using a BigQuery\nscheduled query. This approach supports custom use cases defined by query logic.\n\nBefore you begin\n----------------\n\nBefore you use Cloud Monitoring, ensure that you have the following:\n\n- A Cloud Billing account.\n- A BigQuery project with billing enabled.\n\nOne way to ensure that you have both is to complete the\n[Quickstart using the Google Cloud console](/bigquery/docs/quickstarts/query-public-dataset-console#before-you-begin).\n\nCreate a SQL query\n------------------\n\nCreate and run a SQL query in BigQuery that generates the\noutput for your alert. The query captures the logic that you want to monitor.\nFor more information, see [Run a query](/bigquery/docs/running-queries).\n\nSet up a scheduled query\n------------------------\n\nYou can schedule queries to run on a recurring basis, from every 15 minutes\nto every several months. You can write any query over your log buckets. For more\ninformation, see [Scheduling queries](/bigquery/docs/scheduling-queries).\n\n### Understand the row count metric\n\nScheduled queries automatically create a metric in Cloud Monitoring. This\nmetric records the number of rows that the SQL query returned during its last\nevaluation. You can create an alert policy that monitors this row count metric\nin Monitoring.\n\nThe following [metric](/monitoring/api/metrics_gcp_a_b#gcp-bigquerydatatransfer)\nis a gauge that contains the most recent row count of a scheduled query:\n\n`bigquerydatatransfer.googleapis.com/transfer_config/last_execution_job_rows`\n\nAll scheduled queries write their row count to this metric, using different labels. You need the `config_id` label when you define an alert policy. To find the `config_id` label, follow these steps:\n\n1. In Google Cloud console, go to the **Scheduled queries** page:\n\n [Go to Scheduled queries](https://console.cloud.google.com/bigquery/scheduled-queries)\n2. Click the scheduled query for which you want to create an alert.\n\n3. Go to the **Details** tab.\n\n4. Check the last string in **Resource name**, as shown in the following\n screenshot:\n\n| **Note:** The last known value for the row count repeats continuously for 5 weeks. If you deactivate a scheduled query or the query fails, the metric remains constant at its last known value for 35 days. After 35 days, the metric disappears.\n\nIf a problem occurs with the scheduled query, an error message appears in the\n**Run history** tab of your scheduled query.\n\n### Monitor scheduled queries\n\nMonitor scheduled queries to ensure successful executions:\n\n- Look for errors in the **Run history** tab of the scheduled query.\n- Check the final status of each scheduled execution that is stored in the `completion_state` field of the [`bigquerydatatransfer.googleapis.com/transfer_config/completed_runs` metric](/monitoring/api/metrics_gcp_a_b#gcp-bigquerydatatransfer).\n- Look for errors in the [BigQuery Data Transfer Service logs](/bigquery/docs/dts-monitor#logs).\n\nCreate an alert policy\n----------------------\n\nUse a [metric-threshold alert](/monitoring/alerts/using-alerting-ui) to detect\nwhen the number of rows returned by the scheduled query differs from a threshold.\n\nTo set up an alert on the number of rows a scheduled query returns, follow these\nsteps:\n\n1. In the Google Cloud console, go to the\n *notifications* **Alerting** page:\n\n [Go to **Alerting**](https://console.cloud.google.com/monitoring/alerting)\n\n \u003cbr /\u003e\n\n If you use the search bar to find this page, then select the result whose subheading is\n **Monitoring**.\n2. Click **Create policy**.\n\n3. Select the row count metric for the scheduled query. In the\n **Select a metric** menu, click **BigQuery DTS Config \\\u003e Transfer_config \\\u003e Last executed job row count**.\n\n4. In **Add filters** , click **Add a filter**.\n\n5. In the **Filter** menu, select **config_id**.\n\n6. In the **Value** menu, select the `config_id` of the scheduled query for\n which you want to create an alert:\n\n If you don't set a filter, your alert tests the output of every scheduled\n query. To find the `config_id` of your scheduled query, see\n [Understand the row count metric](#understand_the_row_count_metric).\n7. Keep the default **Transform data** settings and click **Next**.\n\n8. For **Condition types** , select **Threshold**.\n\n9. Select the condition that you want. For example, to trigger when the query\n returns any rows, set the following condition:\n\n 1. For **Alert trigger** , select **Any time series violates**.\n 2. For **Threshold position** , select **Above threshold**.\n 3. In **Threshold value** , enter `0`.\n10. Keep the default **Advanced Options** and click **Next**.\n\n11. Optional: To configure notifications for your alert, click the\n **Use notification channel** toggle, and then set channels and subject line\n for your notifications. You can also set notifications for incident closure.\n\n If you don't want notifications, deselect the **Use notification channel**\n toggle.\n12. Optional: If you have many alert policies, you can [annotate labels](/monitoring/alerts/labels)\n on them to indicate that they are derived from scheduled queries.\n\n13. Optional: In the **Documentation** field, you can add links that help to\n interpret the alert. For example, you can add a link to the **Logs Explorer**\n page with a similar query, so that you can explore the data that raised the\n alert. You can also link to the specific schedule query's details page.\n\n14. In **Name the alert policy**, enter a name for your alert.\n\n15. Click **Create Policy**.\n\nLimitations\n-----------\n\nAlert policies for scheduled queries are subject to the following limitations:\n\n- Scheduled query execution frequency and ingestion delay impact the total time from log emission to alert. For example, if your query runs every 30 minutes and you add a 15-minute lag for ingestion delay, your alert fires approximately 15 minutes after an offending log entry is emitted. In some cases, it might take up to 45 minutes.\n- The configuration between a scheduled query and an alert policy isn't linked or synchronized. Editing the configuration in one place might break the relationship that enables the alert function.\n\nWhat's next\n-----------\n\n- Learn how to create and run [scheduled queries](/bigquery/docs/scheduling-queries)."]]