예약된 쿼리로 알림 설정
이 문서에서는 BigQuery 예약된 쿼리를 사용하여 알림을 설정하는 방법을 설명합니다. 이 접근 방식은 쿼리 로직으로 정의된 커스텀 사용 사례를 지원합니다.
시작하기 전에
Cloud Monitoring을 사용하기 전에 다음이 있는지 확인합니다.
- Cloud Billing 계정
- 결제가 사용 설정된 BigQuery 프로젝트
이 두 가지가 모두 있는지 확인하는 방법 중 하나는 빠른 시작: Google Cloud 콘솔 사용을 완료하는 것입니다.
SQL 쿼리 만들기
BigQuery에서 알림의 출력을 생성하는 SQL 쿼리를 만들고 실행합니다. 쿼리는 모니터링하려는 로직을 캡처합니다. 자세한 내용은 쿼리 실행을 참조하세요.
예약된 쿼리 설정
15분에서 몇 개월마다 반복적으로 실행되도록 쿼리를 예약할 수 있습니다. 로그 버킷에 대한 쿼리를 작성할 수 있습니다. 자세한 내용은 쿼리 예약을 참조하세요.
행 수 측정항목 이해하기
예약된 쿼리는 Cloud Monitoring에서 측정항목을 자동으로 만듭니다. 이 측정항목은 마지막 평가 중에 SQL 쿼리가 반환한 행 수를 기록합니다. Monitoring에서 이 행 수 측정항목을 모니터링하는 알림 정책을 만들 수 있습니다.
다음 측정항목은 예약된 쿼리의 가장 최근 행 수를 포함하는 게이지입니다.
bigquerydatatransfer.googleapis.com/transfer_config/last_execution_job_rows
모든 예약된 쿼리는 서로 다른 라벨을 사용하여 행 수를 이 측정항목에 씁니다. 알림 정책을 정의할 때는 config_id 라벨이 필요합니다. config_id 라벨을 찾으려면 다음 단계를 따르세요.
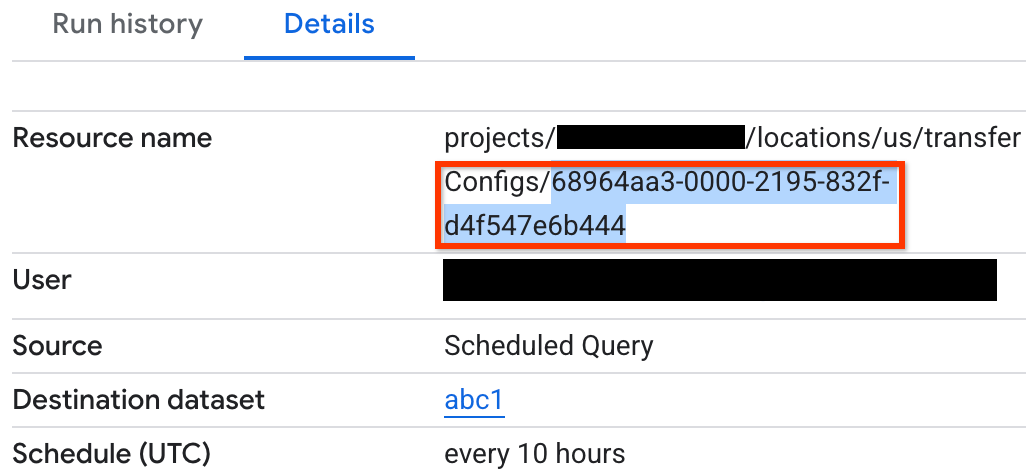
Google Cloud 콘솔에서 예약된 쿼리 페이지로 이동합니다.
알림을 만들 예약된 쿼리를 클릭합니다.
세부정보 탭으로 이동합니다.
다음 스크린샷과 같이 리소스 이름의 마지막 문자열을 확인합니다.
예약된 쿼리에 문제가 발생하면 예약된 쿼리의 실행 기록 탭에 오류 메시지가 표시됩니다.
예약된 쿼리 모니터링
예약된 쿼리를 모니터링하여 성공적으로 실행되었는지 확인합니다.
- 예약된 쿼리의 실행 기록 탭에서 오류를 찾습니다.
bigquerydatatransfer.googleapis.com/transfer_config/completed_runs측정항목의completion_state필드에 저장된 각 예약된 실행의 최종 상태를 확인합니다.- BigQuery Data Transfer Service 로그에서 오류를 찾습니다.
알림 정책 만들기
측정항목-기준점 알림을 사용하여 예약된 쿼리에서 반환된 행 수가 기준점과 다른 경우를 감지합니다.
예약된 쿼리에서 반환하는 행 수에 대한 알림을 설정하려면 다음 단계를 따르세요.
-
Google Cloud 콘솔에서 notifications 알림 페이지로 이동합니다.
검색창을 사용하여 이 페이지를 찾은 경우 부제목이 Monitoring인 결과를 선택합니다.
정책 만들기를 클릭합니다.
예약된 쿼리의 행 수 측정항목을 선택합니다. 측정항목 선택 메뉴에서 BigQuery DTS 구성 > Transfer_config > 마지막으로 실행된 작업 행 수를 클릭합니다.
필터 추가에서 필터 추가를 클릭합니다.
필터 메뉴에서 config_id를 선택합니다.
값 메뉴에서 알림을 만들 예약된 쿼리의
config_id를 선택합니다.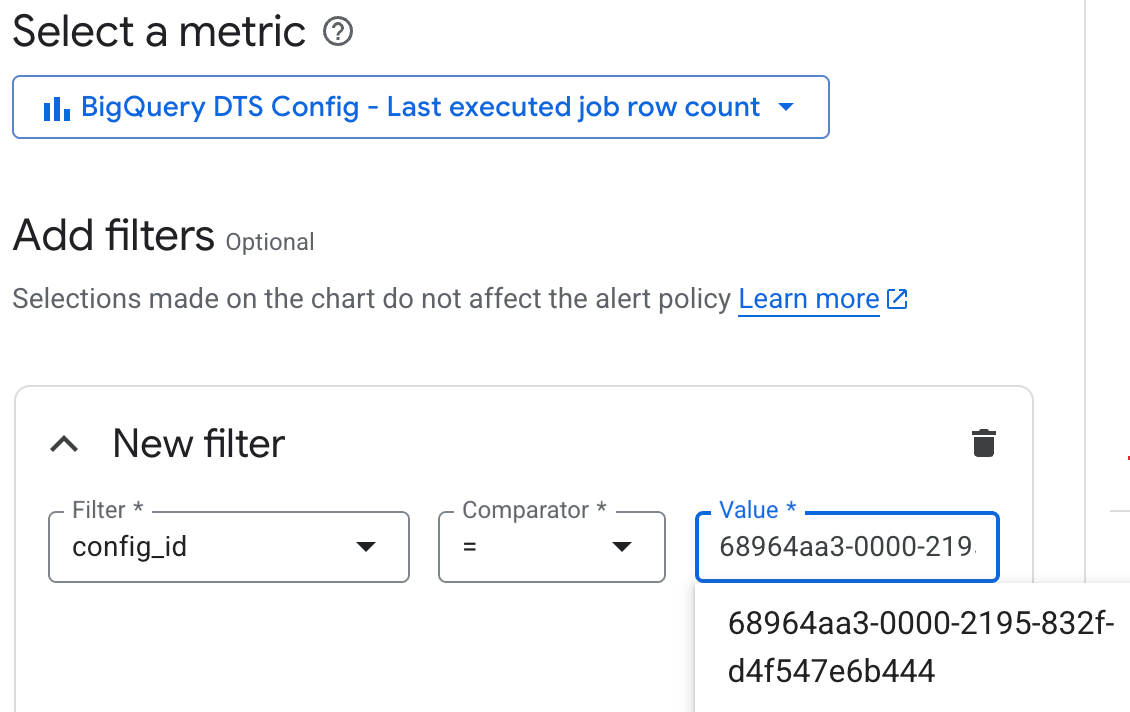
필터를 설정하지 않으면 알림에서 예약된 모든 쿼리의 출력을 테스트합니다. 예약된 쿼리의
config_id를 확인하려면 행 수 측정항목 이해하기를 참조하세요.데이터 변환 설정을 기본값으로 유지하고 다음을 클릭합니다.
조건 유형에 기준점을 선택합니다.
원하는 조건을 선택합니다. 예를 들어 쿼리에서 행이 반환될 때 트리거되도록 하려면 다음 조건을 설정합니다.
- 알림 트리거에서 모든 시계열 위반을 선택합니다.
- 기준 위치에서 기준 초과를 선택합니다.
- 기준 값에
0를 입력합니다.
고급 옵션을 기본값으로 유지하고 다음을 클릭합니다.
선택사항: 알림에 대한 알림을 구성하려면 알림 채널 사용 전환 버튼을 클릭한 다음 알림의 채널과 제목을 설정합니다. 사고 종료에 대한 알림을 설정할 수도 있습니다.
알림을 받지 않으려면 알림 채널 사용 전환 버튼을 선택 해제합니다.
선택사항: 알림 정책이 많은 경우 예약된 쿼리에서 파생되었음을 나타내기 위해 알림 정책에 라벨을 주석으로 추가할 수 있습니다.
(선택사항) 문서 필드에 알림을 해석하는 데 도움이 되는 링크를 추가할 수 있습니다. 예를 들어 유사한 쿼리를 사용하여 로그 탐색기 페이지로 연결되는 링크를 추가하여 알림을 발생시킨 데이터를 탐색할 수 있습니다. 특정 예약된 쿼리의 세부정보 페이지로 연결할 수도 있습니다.
알림 정책 이름 지정에 알림 이름을 입력합니다.
정책 만들기를 클릭합니다.
제한사항
예약된 쿼리의 알림 정책에는 다음과 같은 제한사항이 적용됩니다.
- 예약된 쿼리 실행 빈도와 수집 지연은 로그 내보내기부터 알림까지의 총 시간에 영향을 미칩니다. 예를 들어 쿼리가 30분마다 실행되고 수집 지연을 위해 15분 지연을 추가하면 위반 로그 항목을 내보낸 후 약 15분 후에 알림이 실행됩니다. 경우에 따라 최대 45분이 걸릴 수 있습니다.
- 예약된 쿼리와 알림 정책 간의 구성이 연결되거나 동기화되지 않습니다. 한 곳에서 구성을 수정하면 알림 기능을 사용 설정하는 관계가 깨질 수 있습니다.
다음 단계
- 예약된 쿼리를 만들고 실행하는 방법 알아보기