이 페이지에서는 Ray 클러스터와 연결된 추적 로그를 보고 Vertex AI 기반 Ray 측정항목을 모니터링하는 방법을 설명합니다. Ray 클러스터 디버깅에 관한 안내도 제공됩니다.
로그 보기
Vertex AI 기반 Ray 클러스터를 사용하여 태스크를 수행하면 추적 로그가 자동으로 생성되고 Cloud Logging 및 오픈소스 Ray 대시보드 모두에 저장됩니다. 이 섹션에서는 Google Cloud 콘솔을 통해 생성된 로그에 액세스하는 방법을 설명합니다.
시작하기 전에 Vertex AI의 Ray 개요를 읽고 필요한 모든 기본 요건 도구를 설정해야 합니다.Ray OSS 대시보드
Ray OSS 대시보드를 통해 오픈소스 Ray 로그 파일을 볼 수 있습니다.
Google Cloud 콘솔에서 Vertex AI 기반 Ray 페이지로 이동합니다.
만든 클러스터 행에서 작업 더보기 메뉴를 클릭합니다.
Ray OSS 대시보드 링크를 선택합니다. 대시보드가 다른 탭에서 열립니다.
메뉴의 오른쪽 상단에 있는 로그 보기로 이동합니다.
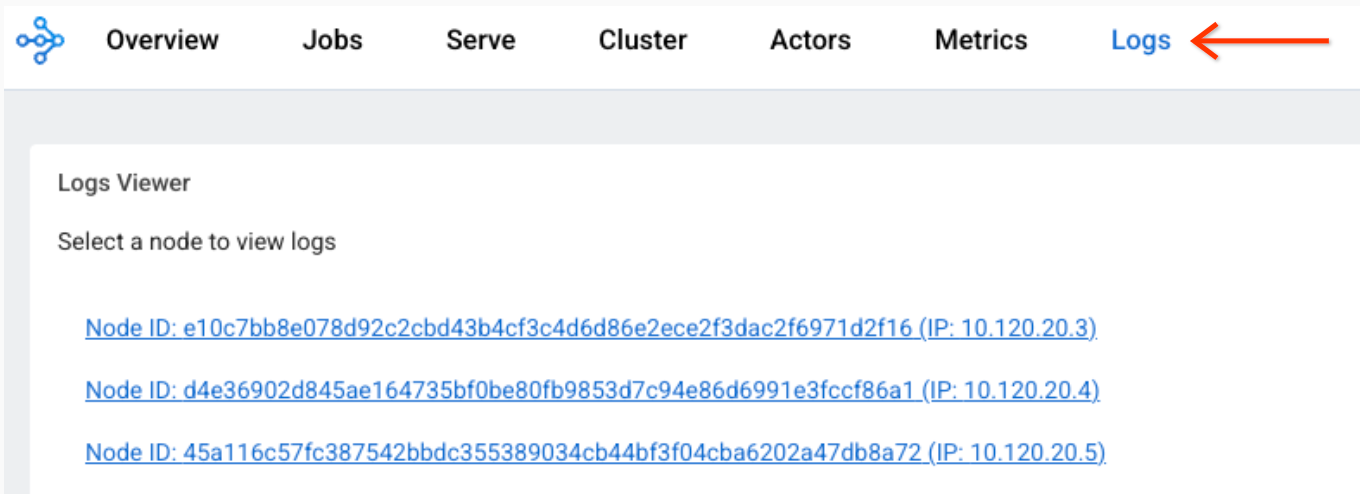
각 노드를 클릭하여 해당 노드와 연결된 로그 파일을 확인합니다.
Cloud Logging 콘솔
-
Google Cloud 콘솔에서 로그 탐색기 페이지로 이동합니다.
검색창을 사용하여 이 페이지를 찾은 경우 부제목이 Logging인 결과를 선택합니다.
기존 Google Cloud 프로젝트, 폴더 또는 조직을 선택합니다.
모든 Ray 로그를 표시하려면 다음 쿼리를 쿼리 편집기 필드에 입력한 후 쿼리 실행을 클릭합니다.
resource.labels.task_name="ray-cluster-logs"
특정 Ray 클러스터로 로그 범위를 좁히려면 쿼리에 다음 줄을 추가한 후 쿼리 실행을 클릭합니다.
labels."ml.googleapis.com/ray_cluster_id"=CLUSTER_NAME
CLUSTER_NAME을 Ray 클러스터 이름으로 바꿉니다. Google Cloud 콘솔에서 Vertex AI > Vertex AI 기반 Ray로 이동합니다. 여기에 각 리전의 클러스터 이름 목록이 표시됩니다.
로그 범위를
raylet.out과 같은 특정 로그 파일로 더 좁히려면 로그 필드 -> 로그 이름에서 로그 이름을 클릭합니다.유사한 로그 항목을 함께 그룹화할 수 있습니다.
쿼리 결과에서 로그 항목을 클릭하여 로그를 펼칩니다.
jsonPayload에서tailed_path값을 클릭합니다. 드롭다운 메뉴가 표시됩니다.일치하는 항목 표시를 클릭합니다.
로그 사용 중지
기본적으로 Vertex AI Cloud Logging의 Ray는 사용 설정되어 있습니다.
Ray 로그를 Cloud Logging으로 내보내기를 사용 중지하려면 다음 Vertex AI SDK for Python 명령어를 사용합니다.
vertex_ray.create_ray_cluster(..., enable_logging=False, ...)
Vertex AI Cloud Logging의 Ray 기능이 사용 중지되어 있어도 Ray 대시보드에서 Ray 로그 파일을 볼 수 있습니다.
측정항목 모니터링
Google Cloud Monitoring(GCM)을 사용하여 여러 방법으로 Vertex AI 기반 Ray 측정항목을 볼 수 있습니다. 또는 GCM에서 자체 Grafana 서버로 측정항목을 내보낼 수 있습니다.
GCM에서 측정항목 모니터링
GCM에서 Vertex AI 기반 Ray 측정항목을 볼 수 있는 두 가지 방법이 있습니다.
- 측정항목 탐색기에서 직접 보기를 사용합니다.
Grafana 대시보드를 가져옵니다.
측정항목 탐색기
측정항목 탐색기에서 직접 보기를 사용하려면 다음 단계를 따르세요.
- Google Cloud Monitoring 콘솔로 이동합니다.
- 탐색에서 측정항목 탐색기를 선택합니다.
- 활성 리소스에서 Prometheus 대상을 선택합니다. 활성 측정항목 카테고리가 표시됩니다.
Ray를 선택합니다.
측정항목 목록이 표시됩니다.
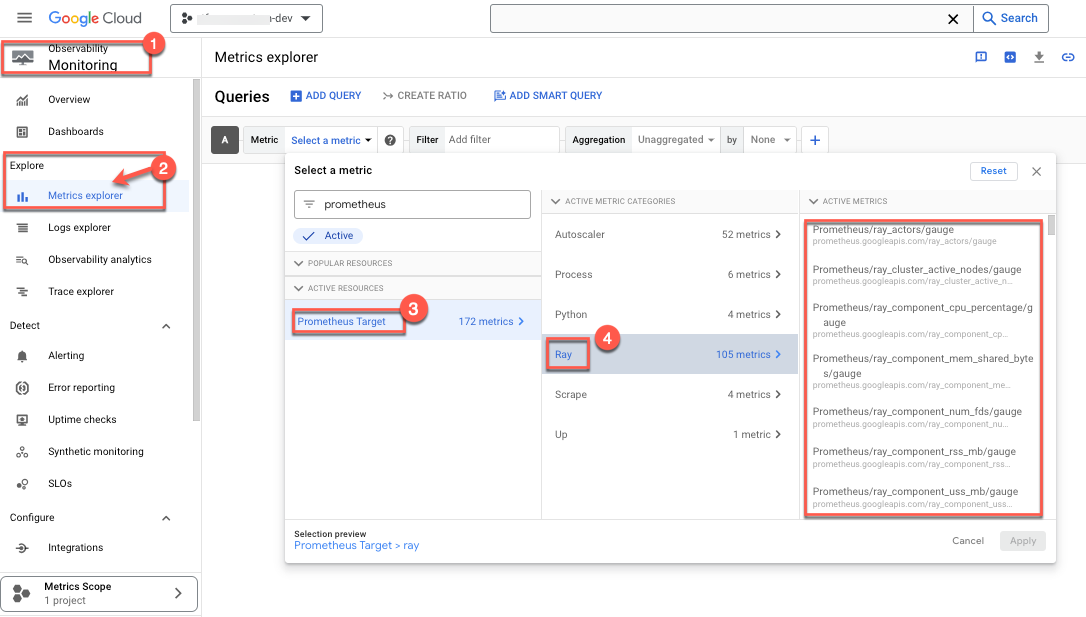
- 모니터링할 측정항목을 선택합니다. 예를 들면 다음과 같습니다.
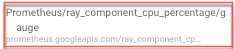
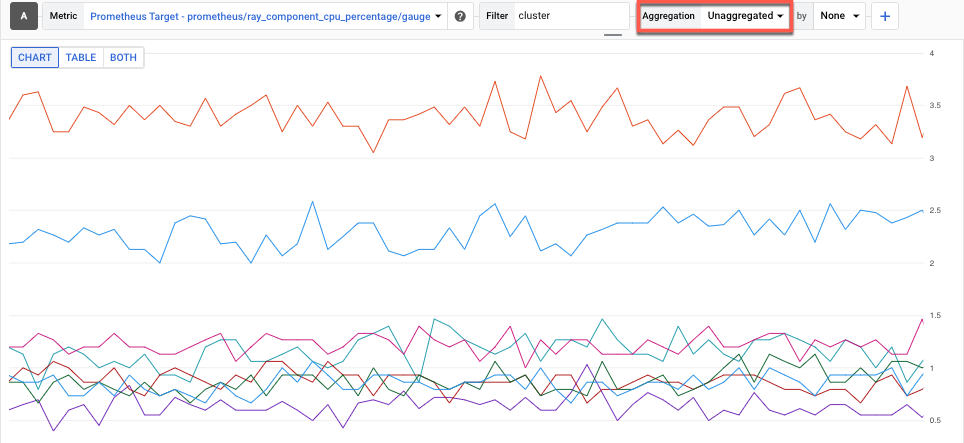
- 모니터링되는 측정항목으로 CPU 사용률을 선택합니다.
- 필터를 선택합니다. 예를 들어 클러스터를 선택합니다.
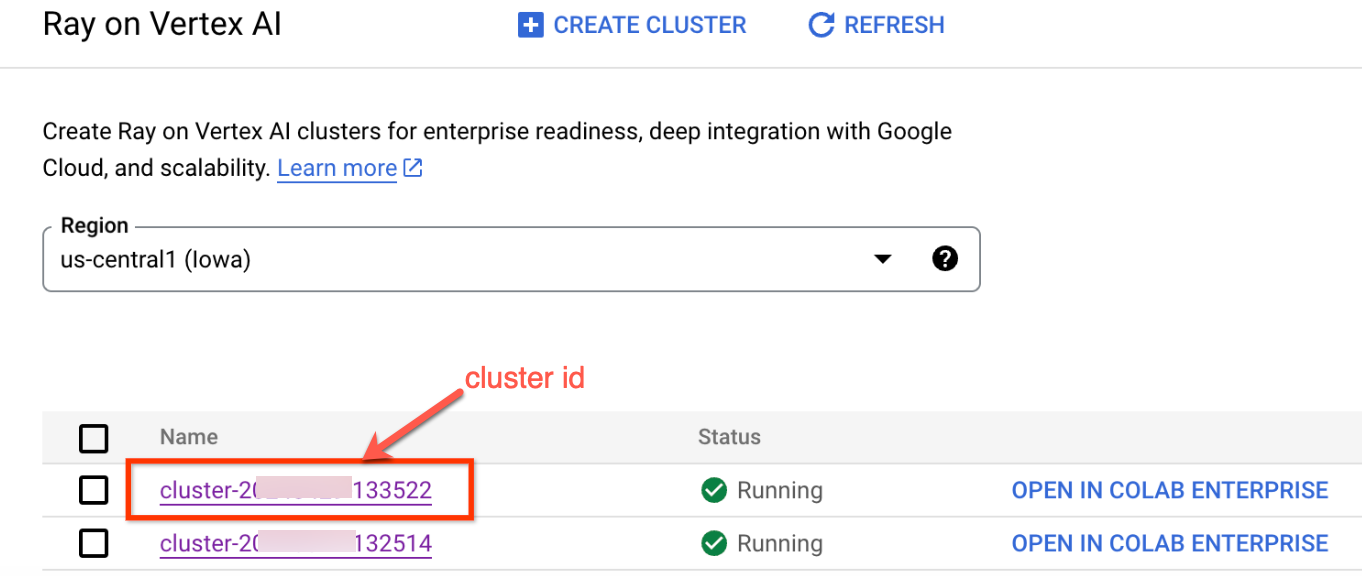
 클러스터 ID를 사용하여 특정 클러스터에 대한 위의 측정항목만 모니터링합니다. 클러스터 ID를 찾으려면 다음 단계를 따르세요.
Google Cloud 콘솔에서 Ray 페이지로 이동합니다.
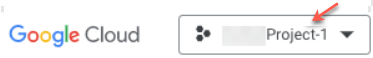
- 실험을 만들려는 프로젝트에 있는지 확인합니다.
- 이름 아래에 클러스터 ID 목록이 표시됩니다.
- 집계 방법을 선택하여 측정항목을 확인합니다. 즉, 각 Ray 프로세스의 CPU 사용률을 보여주는 집계되지 않은 측정항목을 보도록 선택할 수 있습니다.
- 모니터링되는 측정항목으로 CPU 사용률을 선택합니다.
GCM 대시보드
Vertex AI 기반 Ray용 Grafana 대시보드를 가져오려면 Cloud Monitoring 대시보드의 자체 Grafana 대시보드 가져오기 가이드라인을 따릅니다.
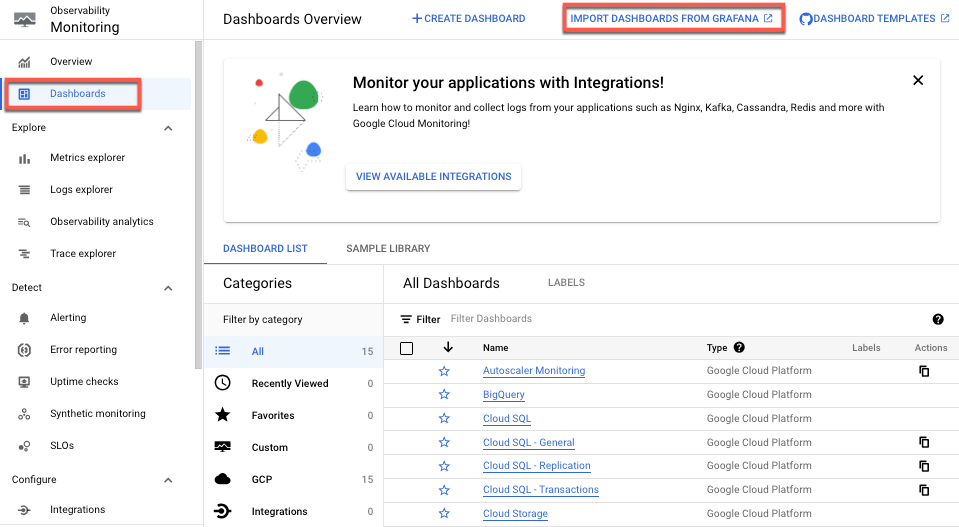
Grafana 대시보드 JSON 파일만 있으면 됩니다. OSS Ray는 기본 대시보드 Grafana JSON 파일을 제공하여 이 수동 설정을 지원합니다.
측정항목 모니터링
사용자 소유 Grafana에서
Grafana 서버가 이미 실행 중인 경우 모든 Vertex AI 기반 Ray 클러스터 Prometheus 측정항목을 기존 Grafana 서버로 내보내는 방법도 있습니다. 이렇게 하려면 GMP Grafana를 사용하여 쿼리 안내를 따르세요. 이렇게 하면 새 Grafana 데이터 소스를 기존 Grafana 서버에 추가하고 데이터 소스 동기화를 사용하여 새 Grafana Prometheus 데이터 소스를 Vertex AI 기반 Ray 측정항목에 동기화할 수 있습니다.
데이터 소스 동기화를 사용하여 새로 추가된 Grafana 데이터 소스를 구성하고 인증해야 합니다. Grafana 데이터 소스 구성 및 인증에 제공된 단계를 따릅니다.
동기화가 완료되면 Vertex AI 기반 Ray 측정항목을 기반으로 필요한 대시보드를 만들고 추가할 수 있습니다.
기본적으로 Vertex AI 기반 Ray 측정항목 수집이 사용 설정됩니다. Vertex AI SDK for Python을 사용하여 이를 사용 중지하는 방법은 다음과 같습니다.
vertex_ray.create_ray_cluster(..., enable_metrics_collection=False, ...)
Ray 클러스터 디버깅
Ray 클러스터를 디버그하려면 헤드 노드 대화형 셸을 사용하세요.
Google Cloud 콘솔
헤드 노드 대화형 셸에 액세스하려면 다음을 수행하세요.
- Google Cloud 콘솔에서 Vertex AI 기반 Ray 페이지로 이동합니다.
Vertex AI 기반 Ray로 이동 - 올바른 프로젝트에 있는지 확인하세요.
- 검사할 클러스터를 선택합니다. 기본 정보 섹션이 표시됩니다.
- 액세스 링크 섹션에서 헤드 노드 대화형 셸 링크를 클릭합니다. 헤드 노드 대화형 셸이 표시됩니다.
- 대화형 셸을 사용한 학습 모니터링 및 디버깅에 설명된 안내를 따르세요.