執行工作時,Model Monitoring v2 會取用目標和基準資料集中的資料、計算指標,並視需要產生快訊。Model Monitoring v2 提供隨選工作,可進行臨時監控或排定工作,以進行持續監控。無論選擇哪個選項,每項工作都是單一的批次執行作業。
如要進一步瞭解監控目標和支援的模型,請參閱「模型監控 v2 總覽」和「設定模型監控」。
依需求執行工作
執行一次性監控工作。設定目標和基準資料集,以及要監控目標的監控規格。如果設定了任何預設值,您的設定會覆寫模型監控器定義的預設值。
控制台
前往 Google Cloud 控制台的「Monitoring」頁面。
按一下要執行監控工作的模型監控器。
在模型監控詳細資料頁面中,按一下「立即執行」,設定監控工作。
設定工作,或使用模型監控器中定義的預設值。
按一下「執行」。
Python SDK
from vertexai.resources.preview import ml_monitoring

FEATURE_THRESHOLDS = {
  "culmen_length_mm": 0.001,
  "body_mass_g": 0.002,
}

FEATURE_DRIFT_SPEC=ml_monitoring.spec.DataDriftSpec(
  categorical_metric_type="l_infinity",
  numeric_metric_type="jensen_shannon_divergence",
  default_categorical_alert_threshold=0.001,
  default_numeric_alert_threshold=0.002,
  feature_alert_thresholds=FEATURE_THRESHOLDS,
)

PREDICTION_OUTPUT_DRIFT_SPEC=ml_monitoring.spec.DataDriftSpec(
  categorical_metric_type="l_infinity",
  numeric_metric_type="jensen_shannon_divergence",
  default_categorical_alert_threshold=0.001,
  default_numeric_alert_threshold=0.001,
)

FEATURE_ATTRIBUTION_SPEC=ml_monitoring.spec.FeatureAttributionSpec(
  default_alert_threshold=0.0003,
  feature_alert_thresholds={"cnt_ad_reward":0.0001},
)

EXPLANATION_SPEC=ExplanationSpec(
  parameters=ExplanationParameters(
      {"sampled_shapley_attribution": {"path_count": 2}}
  ),
  metadata=ExplanationMetadata(
      inputs={
          "cnt_ad_reward": ExplanationMetadata.InputMetadata({
              "input_tensor_name": "cnt_ad_reward",
              "encoding": "IDENTITY",
              "modality": "numeric"
          }),
          ...
      },
      ...
  )
)

TRAINING_DATASET=ml_monitoring.spec.MonitoringInput(
  gcs_uri=TRAINING_URI,
  data_format="csv"
)

TARGET_DATASET=ml_monitoring.spec.MonitoringInput(
  table_uri=BIGQUERY_URI
)

model_monitoring_job=my_model_monitor.run(
  display_name=JOB_DISPLAY_NAME,
  baseline_dataset=TRAINING_DATASET,
  target_dataset=TARGET_DATASET,
  tabular_objective_spec=ml_monitoring.spec.TabularObjective(
      # Optional: set to monitor input feature drift.
      feature_drift_spec=FEATURE_DRIFT_SPEC,

      # Optional: set to monitor prediction output drift.
      prediction_output_drift_spec=PREDICTION_OUTPUT_DRIFT_SPEC,

      # Optional: set to monitor feature attribution drift.
      feature_attribution_spec=FEATURE_ATTRIBUTION_SPEC
  ),

  # Optional: additional configurations to override default values.
  explanation_config=EXPLANATION_SPEC,
  notification_spec=NOTIFICATION_SPEC,
  output_spec=OUTPUT_SPEC
)
排定持續執行作業
您可以為模型監控器設定一或多個排程執行作業。如要搭配時間規格使用持續監控功能,資料集必須包含時間戳記資料欄,模型監控服務第 2 版才能從指定時間範圍擷取資料。
控制台
前往 Google Cloud 控制台的「Monitoring」頁面。
按一下要設定持續監控的模型監控器。
按一下「排定週期性執行作業」。
設定目標和基準資料集,然後按一下「繼續」。
設定要監控的目標、目標門檻,以及產生快訊時的通知設定。
按一下「繼續」。
設定週期性工作的時間表:
- 指定排程器的名稱。
- 在「開始時間」中,指定第一個工作開始的時間。
- 如要設定「頻率」,請使用 Cron 運算式,然後設定時區。
- 在「結束」部分,指定排程結束時間。
點選「建立」。
Python SDK
如要設定監控工作的頻率,請使用 Cron 運算式。
my_model_monitoring_schedule=my_model_monitor.create_schedule(
  display_name=SCHEDULE_DISPLAY_NAME,
  # Every day at 0:00(midnight)
  cron='"0 * * * *"',
  baseline_dataset=ml_monitoring.spec.MonitoringInput(
      endpoints=[ENDPOINT_RESOURCE_NAME],
      offset="24h",
      window="24h",
  ),
  target_dataset=ml_monitoring.spec.MonitoringInput(
      endpoints=[ENDPOINT_RESOURCE_NAME],
      window="24h"
  ),
  tabular_objective_spec=ml_monitoring.spec.TabularObjective(
      # Optional: set to monitor input feature drift.
      feature_drift_spec=FEATURE_DRIFT_SPEC,

      # Optional: set to monitor prediction output drift.
      prediction_output_drift_spec=PREDICTION_OUTPUT_DRIFT_SPEC,

      # Optional: set to monitor feature attribution drift.
      feature_attribution_spec=FEATURE_ATTRIBUTION_SPEC
  ),

  # Optional: additional configurations to override default values.
  explanation_config=EXPLANATION_SPEC,
  output_spec=OUTPUT_SPEC,
  notification_spec=NOTIFICATION_SPEC,
)
暫停或繼續執行排程
您可以暫停及繼續執行時間表,略過或暫時停止監控工作執行。
控制台
前往 Google Cloud 控制台的「Monitoring」頁面。
按一下要修改時間表的模型監控器。
在詳細資料頁面中,前往「時間表」分頁。
按一下要修改的排程。
按一下「暫停」或「繼續」,即可暫停或繼續排程。
Python SDK
# Pause schedule
my_model_monitor.pause_schedule(my_monitoring_schedule.name)

# Resume schedule
my_model_monitor.resume_schedule(my_monitoring_schedule.name)
刪除時間表
如果不再使用排程,請刪除。現有資料和先前建立的工作都會保留。
控制台
前往 Google Cloud 控制台的「Monitoring」頁面。
按一下要修改時間表的模型監控器。
在詳細資料頁面中,前往「時間表」分頁。
按一下要修改的排程。
按一下「刪除」,然後再次按一下「刪除」來確認操作。
Python SDK
my_model_monitor.delete_schedule(my_monitoring_schedule.name)
分析監控作業結果
您可以使用 Google Cloud 控制台,以視覺化方式呈現各監控目標的資料分布情形,並瞭解哪些變化導致模型隨時間發生漂移。
這些視覺化內容會顯示直方圖,比較目標資料和基準資料之間的資料分布情況。舉例來說,您可以根據容忍程度,決定調整特徵生成管道或重新訓練模型。
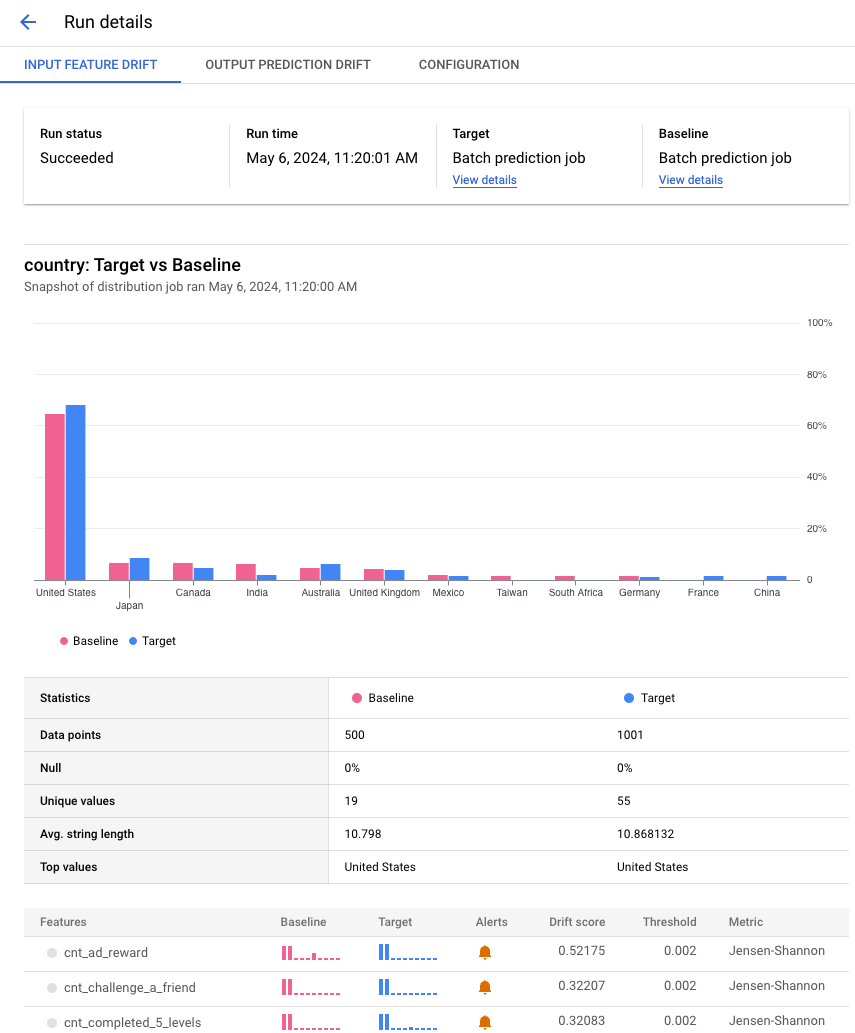
查看工作詳細資料
查看監控工作執行的詳細資料,例如受監控的特徵清單,以及產生快訊的特徵。
控制台
前往 Google Cloud 控制台的「Monitoring」頁面。
按一下包含要分析工作的模型監控器。
在「Monitor details」(監控詳細資料) 頁面上,按一下「Runs」(執行) 分頁標籤。
在執行記錄清單中,按一下執行記錄即可查看詳細資料,例如執行記錄中包含的所有功能。
下列範例顯示批次預測工作的「國家/地區」特徵分配比較。 Google Cloud 控制台也會根據指標提供比較詳細資料,例如不重複值的數量、平均值和標準差。
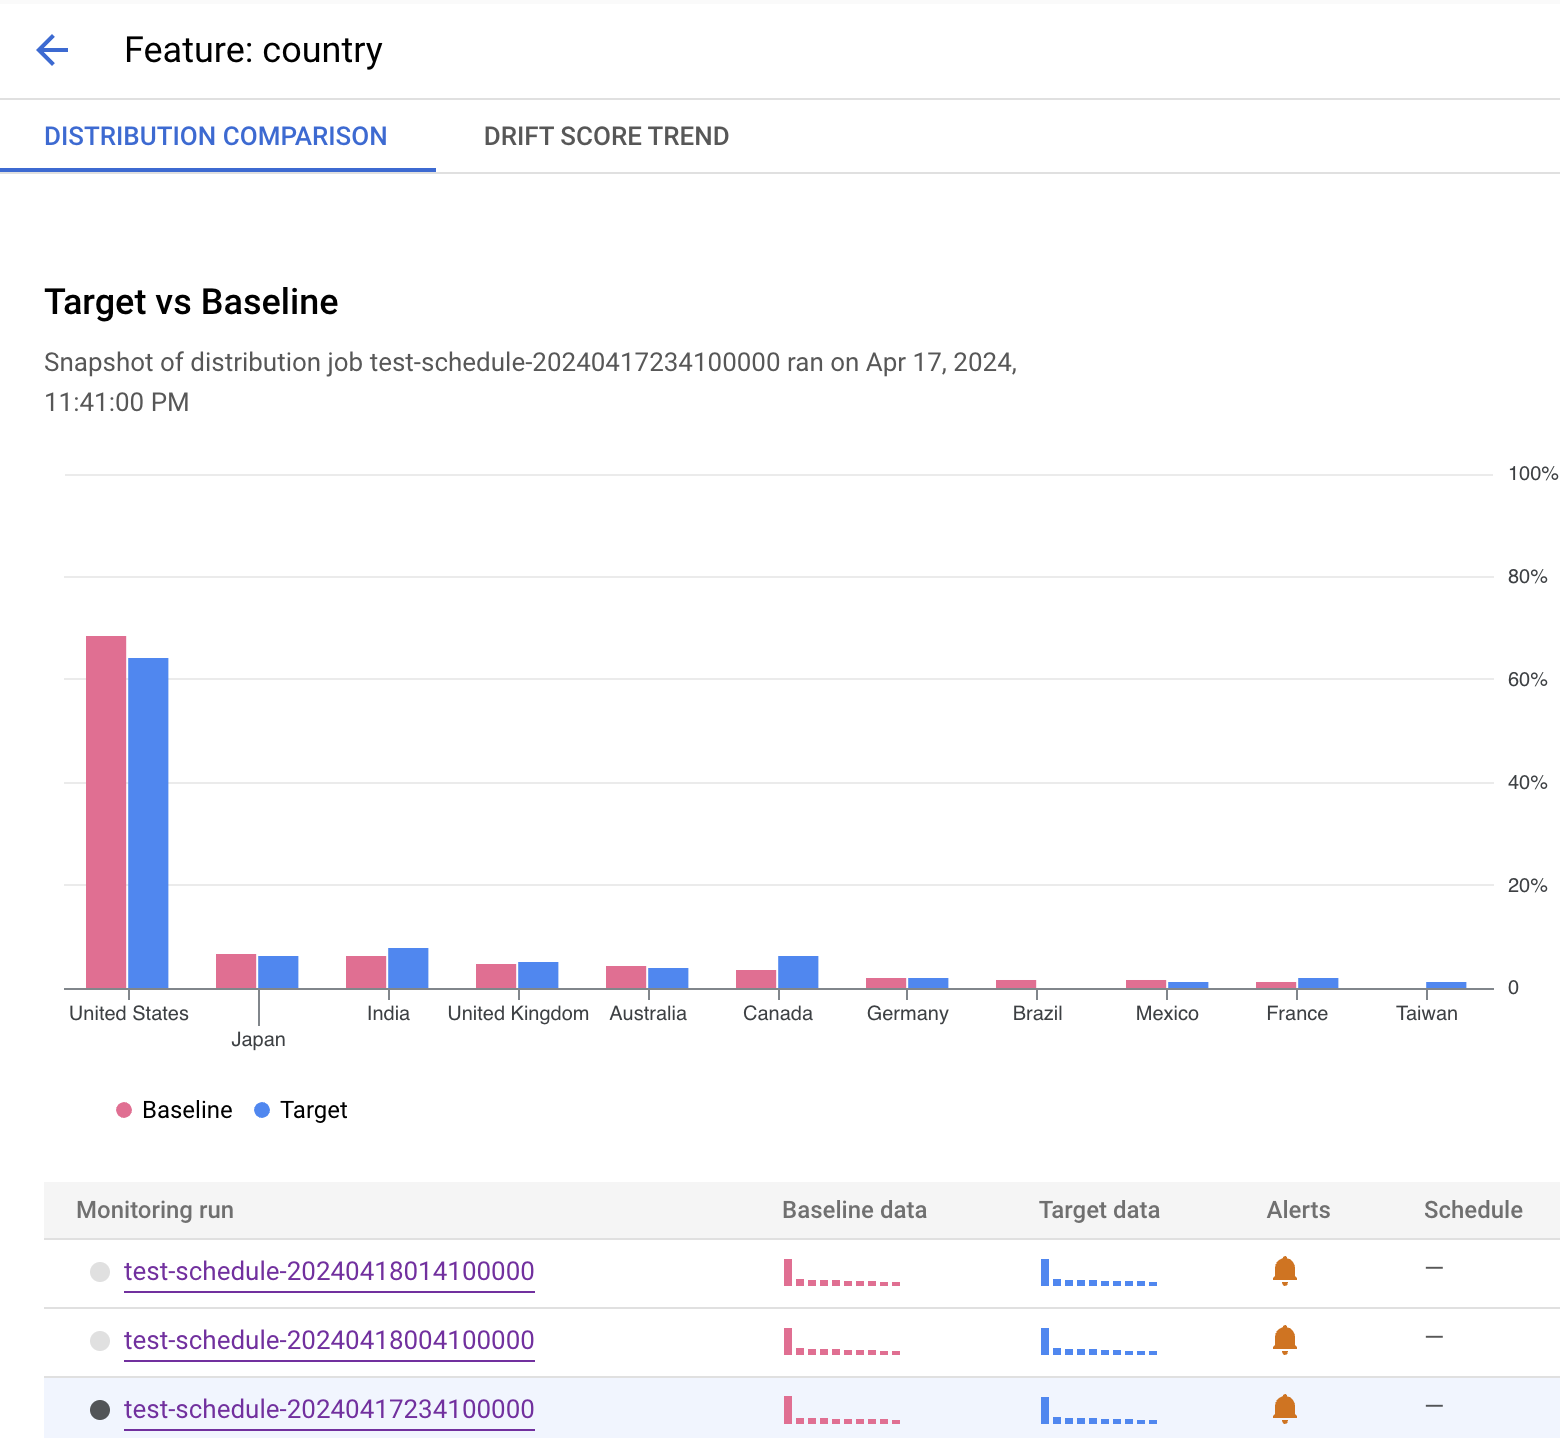
查看功能詳細資料
查看特徵的相關資訊,以及包含該特徵的監控工作清單。
控制台
前往 Google Cloud 控制台的「Monitoring」頁面。
按一下包含待分析工作的模型監控器。
在「總覽」分頁中,您可以查看摘要,包括所有受監控目標的漂移趨勢 (如果您已設定持續監控)。您也可以深入瞭解特定目標,查看詳細資料,例如受監控的特徵名稱和監控執行清單。
以下範例顯示「國家/地區」特徵的分布比較。直方圖下方會顯示產生快訊的執行作業,您也可以選取其他監控作業,查看這項特徵的監控資料。